The Size of the Affordable Mortgage Market:
2015-2017 Enterprise Single-Family Housing Goals
August 2014 Revised
iii
CONTENTS Page
CONTENTS ... iii
LIST OF FIGURES AND TABLES ...iv
PREFACE... v
A. INTRODUCTION ... 1
B. CURRENT MARKET CONDITIONS ... 5
C. ECONOMIC AND MORTGAGE MARKET DATA ... 12
D. HOUSING AND MORTGAGE MARKET FORECAST ... 14
E. STATISTICAL MODELS OF THE SINGLE-FAMILY HOUSING GOALS ... 24
F. CONCLUSIONS ... 43
APPENDIX A – LOW-INCOME BORROWERS HOME PURCHASE GOAL MODEL STATISTICS ... 44
APPENDIX B – VERY LOW-INCOME BORROWERS HOME PURCHASE GOAL MODEL STATISTICS ... 48
APPENDIX C – LOW-INCOME AREA HOME PURCHASE GOAL MODEL STATISTICS ... 52
APPENDIX D – LOW-INCOME BORROWERS REFINANCE GOAL MODEL STATISTICS ... 56
iv
FIGURES AND TABLES Page
Figure 1. Annual Economic Growth Rates ... 5
Figure 2. Housing Market Indicators ... 6
Figure 3. Total Single-Family Housing Starts ... 7
Figure 4. Mortgage Supply and Demand ... 8
Figure 5. Defaults in the Prime Mortgage Market ... 9
Figure 6. Manufactured Housing ... 11
Figure 7. Drivers of the Low-Income Borrower Home Purchase Goal Estimates ... 26
Figure 8. Low-Income Borrower Home Purchase Goal Forecast ... 29
Figure 9. Drivers of the Very Low-Income Borrower Home Purchase Goal Estimates ... 30
Figure 10. Very Low-Income Borrower Home Purchase Goal Forecast ... 33
Figure 11. Drivers of the Low-Income Areas Home Purchase Goal Estimates ... 34
Figure 12. Low-Income Area Home Purchase Subgoal Forecast ... 37
Figure 13. Drivers of the Low-Income Borrower Refinance Goal Estimates ... 38
Figure 14. Low-Income Borrower Refinance Goal Forecast ... 41
Table 1. Market Estimates 2013 - 2017 ... 3
Table 2. Economic and Mortgage Market Outlook ... 16
Table 3. Housing and Mortgage Market Outlook ... 19
Table 4. Forecasts of Market Indicators by Source (Part 1) ... 21
Table 5. Forecasts of Market Indicators by Source (Part 2) ... 22
Table 6. Low-Income Borrower Home Purchase Goal Model ... 27
Table 7. Very Low-Income Borrower Home Purchase Goal Model ... 32
Table 8. Low-Income Area Home Purchase Subgoal Model ... 35
v
PREFACE
This Federal Housing Finance Agency (FHFA) research paper discusses the forecast models used in establishing housing goal benchmarks for 2015 through 2017. The paper is part of FHFA’s ongoing effort to enhance public understanding of the nation’s housing finance system. The paper was prepared by Jay Schultz, Senior Economist, National Mortgage Database Team, Office of Chief Operating Officer.
1
The Size of the Affordable Mortgage Market: 2015-2017 Enterprise Single-Family Housing Goals
A. INTRODUCTION
The Federal Housing Enterprises Financial Safety and Soundness Act of 1992 (the Safety and Soundness Act), as amended, mandates that the Federal Housing Finance Agency (FHFA) establish housing goals for Fannie Mae and Freddie Mac (the Enterprises).1 The goals for the single-family mortgage market are based on mortgages acquired and include separate goals for home purchase and refinance mortgages. Only mortgages associated with 1-4 unit owner-occupied properties are counted.
This paper documents the methodology used to estimate the market size for the Low-Income Borrower Home Purchase Housing Goal (share of borrowers with incomes no greater than 80 percent of the area median income (AMI)), the Very Low-Income Borrower Home Purchase Housing Goal (share of borrowers with incomes no greater than 50 percent of AMI), the Low-Income Area Home Purchase Housing Subgoal (share of borrowers living in low-income areas (where census tract median low-income is no greater than 80 percent of AMI) and high minority areas), and the Low-Income Borrower Refinance Housing Goal (share of borrowers with incomes no greater than 80 percent of AMI).2
The single-family housing goals are defined in terms of percentages of mortgages on owner-occupied properties, either home purchase or refinance, acquired during a calendar year. For example, the low-income borrower home purchase goal is expressed as the percentage of home purchase mortgages where the borrower’s income is no greater than 80 percent of the area
1
12 U.S.C. 1331(a) 2
High minority areas are defined as census tracts where the percent minority is at least 30 percent of the population and the census tract median income is less than AMI. There is also a provision for designated disaster areas in the Low-Income Areas Home Purchase Goal.
2
median income. Likewise, the low-income borrower refinance mortgage acquisitions are relative to all owner-occupied property refinance mortgages acquired.3 The results of the market
estimation model are provided in Table 1, and the remainder of this paper describes the process used to produce these projections.
3
To be eligible to count toward the housing goals, mortgages acquired have to meet certain counting rules. These counting rules are defined in 12 CFR part 1282.
3 Year1 2004 2005 2006 2007 2008 2009 2010-11 Benchmarks2 20103 20113 2012-14 Benchmarks 20123 20134 23.4% ±3.0% 6.5% ±1.0% 13.4% ±1.7% 22.4% ±3.3% 20144 21.4% ±5.2% 5.5% ±1.5% 14.3% ±3.3% 27.6% ±5.4% 20154 20.9% ±6.7% 5.8% ±1.9% 14.7% ±4.3% 31.0% ±6.8% 20165 20.2% ±7.9% 5.7% ±2.1% 14.7% ±5.2% 33.5% ±8.1% 20175 19.8% ±9.0% 5.6% ±2.4% 14.2% ±6.0% 34.2% ±9.2%
1Historical market performance is based on historical HMDA data for first-lien, conventional,
ARRA-equivalent conforming limit loans, excluding higher-cost and HOEPA loans (see Section C).
2The 2010-11 refinance goal benchmark includes a +200 basis point adjustment to account for the impact of loan modifactions
on Enterprise performance.
3Historical market performance, the refinance goal market performance does not include the impact of loan modifications.
4Estimated (95% confidence), does not include adjustment for loan modifications.
5Estimated (95% confidence), primarily a function of time trends, does not include adjustment for loan modifications.
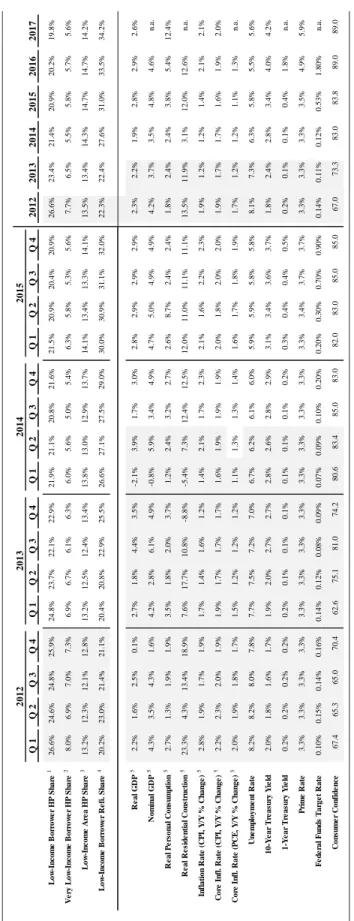
Table 1
Enterprise Single-Family Housing Goals Market Estimates 2013 - 2017
Low-Income Very Low-Income Low-Income Low-Income
Borrower Borrower Area Borrower
Home Purchase Goal Home Purchase Goal Home Purchase Goal Refinance Goal
27.2% 6.6% 16.7% 28.0% 24.2% 5.7% 15.3% 26.0% 24.0% 5.9% 15.8% 24.7% 26.0% 6.1% 16.2% 24.2% 25.3% 6.5% 14.1% 23.4% 29.6% 8.8% 13.0% 20.8% 27% 8% 13% 21% 27.2% 8.1% 12.1% 20.2% 26.5% 8.0% 11.4% 21.5% 23% 7% 11% 20% 26.6% 7.7% 13.5% 22.3%
4
Section B discusses current economic and market conditions, and provides descriptions of the economic drivers in the mortgage market. Section C describes the economic and market forecast data used to project the market size of each of the single-family mortgage housing goals. Section D presents the housing and mortgage market forecasts by government agencies and industry participants. Section E provides the four econometric time series models used to estimate affordability in the market. Finally, conclusions are provided in Section F.
5
B. CURRENT MARKET CONDITIONS
The economic recovery is in its fifth year and it’s been nearly six years since the collapse of the housing and mortgage markets. The economy has yet to grow at a rate more than three percent over an entire year since the 2009 recession, see Figure 1. Although the housing market was hit hard by the recession, Residential Fixed Investment posted growth rates above 12 percent in 2012 and 2013. Since their peak in 2007, house prices bottomed out in 2011 and are
increasing again while home sales remain generally flat.
Source: US Department of Commerce, Bureau of Economic Analysis
‐24% ‐21% ‐18% ‐15% ‐12% ‐9% ‐6% ‐3% 0% 3% 6% 9% 12% 15% 2000 2001 2002 2003 2004 2005 2006 2007 2008 2009 2010 2011 2012 2013 Figure 1
Annual Economic Growth Rates
6
Figure 2 shows both home sale volume and FHFA’s House Price Index for home
purchase mortgages. New and existing home sales remain generally flat. Home sale volume is well below the peak of 8.5 million units and is still below the pre-2004 volume of 6 million units.
Sources: US Department of Commerce, Bureau of the Census, National Association of Realtors, and the Federal Housing Finance Agency.
100 120 140 160 180 200 220 240 0 1,000 2,000 3,000 4,000 5,000 6,000 7,000 8,000 9,000 Thousands Figure 2
Housing Market Indicators
7
Housing starts have grown slowly but are still well below the levels in the early 2000s. Prior to 2004 housing starts averaged nearly 350,000 units per year. Housing starts peaked in the second quarter of 2005 at 495,000 units, see Figure 3. However, during 2012 and 2013, housing starts averaged only 150,000 starts.
Source: US Department of Commerce, Bureau of the Census.
0 100 200 300 400 500 600 20 00 Q1 20 00 Q3 20 01 Q1 20 01 Q3 20 02 Q1 20 02 Q3 20 03 Q1 20 03 Q3 20 04 Q1 20 04 Q3 20 05 Q1 20 05 Q3 20 06 Q1 20 06 Q3 20 07 Q1 20 07 Q3 20 08 Q1 20 08 Q3 20 09 Q1 20 09 Q3 20 10 Q1 20 10 Q3 20 11 Q1 20 11 Q3 20 12 Q1 20 12 Q3 20 13 Q1 20 13 Q3 Thousands Figure 3
8
As mortgage interest rates rose in 2013, demand for mortgage loans decreased, as
indicated by the quarterly Survey of Senior Loan Officers, see Figure 4.4 As Figure 4 shows, in general, mortgage demand has an inverse relationship to changes in the mortgage interest rate.
Figure 4 also shows the loan officers’ observations on underwriting standards and a notable
tightening of underwriting standards coincided with the mortgage market bubble and collapse during 2006 through 2009.
Sources: Board of Governors of the Federal Reserve System and Freddie Mac’s Primary Mortgage Market Survey..
4
Board of Governors of the Federal Reserve System, Senior Loan Officer Opinion Survey on Bank Lending Practices, http://www.federalreserve.gov/econresdata/statisticsdata.htm. 0% 1% 2% 3% 4% 5% 6% 7% 8% 9% ‐80% ‐60% ‐40% ‐20% 0% 20% 40% 60% 80% 20 00 Q1 20 00 Q3 20 01 Q1 20 01 Q3 20 02 Q1 20 02 Q3 20 03 Q1 20 03 Q3 20 04 Q1 20 04 Q3 20 05 Q1 20 05 Q3 20 06 Q1 20 06 Q3 20 07 Q1 20 07 Q3 20 08 Q1 20 08 Q3 20 09 Q1 20 09 Q3 20 10 Q1 20 10 Q3 20 11 Q1 20 11 Q3 20 12 Q1 20 12 Q3 20 13 Q1 20 13 Q3 20 14 Q1 Figure 4
Mortgage Supply and Demand
Net Percentage of Domestic Respondents Tightening Standards for Mortgage Loans (Left Axis) Net Percentage of Domestic Respondents Reporting Stronger Demand for Mortgage Loans (Left Axis)
9
Mortgage defaults are on a downward trend, although still at a higher rate than the pre-2004 average. According to the Mortgage Bankers Association’s National Delinquency Survey the number of past due mortgages were below 1 million in the first quarter of 2014 after peaking at nearly 2.5 million in the fourth quarter of 2009, see Figure 5.5 Seriously delinquent mortgages were down to 3.0 percent of all outstanding prime mortgages at the beginning of 2014, after reaching a high of 7.1 percent in the first quarter of 2010.
Source: Mortgage Bankers Association.
Manufactured housing is an important source for affordable housing. Loans used to purchase a manufactured housing unit can be placed in two categories. In the first category, the
5
Mortgage Bankers Association,
http://www.mortgagebankers.org/ResearchandForecasts/ProductsandSurveys/NationalDelinquencySurvey.htm 0% 1% 2% 3% 4% 5% 6% 7% 8% 0 500 1,000 1,500 2,000 2,500 3,000 Thousands Figure 5
Defaults in the Prime Mortgage Market
Number of Past Due Mortgages (left axis)
10
manufactured housing unit and the land on which it sits are considered real estate and the loan used to acquire it is called a mortgage loan. In the second category, the manufactured housing unit is considered personal property, or chattel, and the loan used to acquire it is called a chattel loan. A loan on manufactured housing may only count toward a housing goal if it is secured by real estate. Therefore, any purchases of chattel loans do not count as mortgage purchases for purposes of the housing goals. 6 Because it is a personal property loan, chattel loans generally have higher contract interest rates and terms than a mortgage loan would have. Over the period 2008 through 2012, a total of 235,000 home purchase loan originations (4.0 percent of all home purchase loan originations) were for purchase of manufactured housing. Of those 235,000 units, 78.3 percent were higher cost loans (see Figure 6). This compares to 4.7 percent of
non-manufactured housing mortgages being identified as higher cost.7
6
12 CFR Part 1282.1, and “2010–2011 Enterprise Housing Goals; Enterprise Book-entry Procedures; Final Rule.” 75 Federal Register 177 (14 September 2010), p. 55894.
7
11 Source: Home Mortgage Disclosure Act (HMDA) data.
0% 5% 10% 15% 20% 25% 30% 0% 5% 10% 15% 20% 25% 30% 35% 40% 45% 50% 55% 60% 65% 70% 75% 80% 85% 90% 2004 2005 2006 2007 2008 2009 2010 2011 2012 Figure 6
Manufactured Housing Home Purchase Loans
Share of Manufactered Housing Loans that are Higher Cost (Left Axis) Share of Non‐Manufactered Housing Loans that are Higher Cost (Left Axis) Share of Home Purchase loans that are for Manufactered Housing (Right Axis)
12
C. ECONOMIC AND MORTGAGE MARKET DATA
Historical monthly time series data used in the housing goals forecast models were obtained from a variety of sources. Gross Domestic Product, the unemployment rate, inflation rates, median prices for new homes, housing starts and new housing sales are from the Census Bureau, the Bureau of Economic Analysis and the Bureau of Labor Statistics.8 Constant maturity interest rates on Government notes and bonds came from the U.S. Department of the Treasury, while mortgage interest rates are provided by Freddie Mac’s Primary Mortgage Market Survey.9 Median house prices for existing homes and the Housing Affordability Index were obtained from the National Association of Realtors (NAR), and FHFA produces House Price Indices for all transactions and for home purchase loans. For 2012 and previous years the refinance rate and FHA market share were calculated from Home Mortgage Disclosure Act (HMDA) data. 10 Preliminary refinance rates for 2013 are as reported by the Mortgage Bankers Association. For the complete list of data sources, see Appendix E.
FHFA measures the market performance for the single-family owner-occupied property mortgage housing goals by analyzing HMDA data. HMDA data are loan level records of
mortgage applications, originations and acquisitions that occurred during a calendar year and are considered to be broadly representative of the mortgage market in the United States.11 The Federal Financial Institutions Examination Council (FFIEC) has made available a monthly nationwide time series from the loan level HMDA records with various attributes and
8
U.S. Department of Commerce and the U.S. Department of Labor. 9
U.S. Treasury constant maturity interest rates were obtained from the Federal Reserve Bank of St. Louis’ FRED database.
10
HMDA data are made available from the Federal Financial Institutions Examination Council,
http://www.ffiec.gov/hmda/default.htm. 11
Bhutta, Neil, et al. “Mortgage Market Conditions and Borrower Outcomes: Evidence from the 2012: HMDA Data and Matched HMDA-Credit Record Data.” Federal Reserve Bulletin, (November 2013) Vol. 99, No 1. The 2012 HMDA data covered 7,400 home lenders including the nation’s largest mortgage originators.
13
specifications, including the performance of the four single-family housing goals and the one subgoal. For the purposes of estimating the single-family mortgage market for goal qualifying loans, FHFA defines the market as conventional conforming first lien, prime home purchase (or refinance) mortgages.12
The HMDA data used to produce the market affordability forecasts begins in 2004, when HMDA data began including (1) rate-spread information for high-cost loans, an indicator for manufactured housing loans, and (2) an identifier for first-lien mortgages. The rate-spread and manufactured housing information helps to better identify subprime and chattel loans.
One of the issues with regard to HMDA data is the considerable delay in releasing the database. At this time the most current, publicly available, HMDA data are for 2012. To inform the forecasted estimates with more current information two supplemental data time series are used. Estimates of the goal qualifying shares for the three home purchase goals and subgoal are calculated from FHFA’s Monthly Interest Rate Survey (MIRS) data through December 2013. The refinance goal time series is also extended using the combined Enterprise goal performance through March 2014.
12
To be consistent with the conforming loan limits established in the American Recovery and Reinvestment Act (ARRA 2009), the conforming loan limit is defined as 1.15 times the Area Median House Price (from NAR), where the maximum (ceiling) must not exceed 1.75 times the original conforming limit for the given year. A loan is considered not prime (subprime) if the contract rate is 300 or more basis points above the 30-Year Treasury Note Yield.
14
D. HOUSING AND MORTGAGE MARKET FORECAST
On average, industry forecasters project the economy to continue to grow during the 2015 through 2017 period, with real Gross Domestic Product (GDP) growing at rates around 3.0 percent in each year. As shown in Figure 1, residential investment is correlated with swings in the growth of the economy (GDP) in general, however with much greater amplitude. Residential Fixed Investment is expected to grow by 12.0 percent in 2015 and 12.6 percent in 2016 (see
Table 2). The effects of interest rates, unemployment, inflation, refinancing, house prices, and
the overall housing market enter the estimation equations for the housing goal market performance as explanatory variables.
Interest Rates. Mortgage interest rates are affected by many factors. Trends in interest rates on longer term financial instruments such as mortgages typically follow the fluctuations of the 10-Year Treasury note yield, with approximately a 165 to 170 basis point spread reflecting the differences in liquidity and credit risk expected for the 2015 through 2017 period. This is similar to the past five years, but lower than the 181 basis point average spread during 2005 through 2008. Overall, interest rates in the United States are heavily influenced by the monetary policies of the Federal Reserve Board’s Federal Open Market Committee (FOMC). Since mid-2008, the FOMC has maintained an accommodative monetary policy in support of its dual mandate of fostering maximum employment and price stability. In its June 17-18, 2014 meeting, the FOMC stated that it is committed to a low federal funds rate policy (at 0 to 0.25 percent) in the near term:
“[t]o support continued progress toward maximum employment and price stability, the Committee today reaffirmed its view that a highly accommodative stance of monetary policy remains appropriate. In determining how long to maintain the current 0 to 1/4 percent target range for the federal funds rate, the Committee will assess progress--both realized and expected--toward its objectives of maximum employment and 2 percent inflation. This assessment will take into
15
account a wide range of information, including measures of labor market conditions, indicators of inflation pressures and inflation expectations, and
readings on financial developments. The Committee continues to anticipate, based on its assessment of these factors, that it likely will be appropriate to maintain the current target range for the federal funds rate for a considerable time after the asset purchase program ends, especially if projected inflation continues to run below the Committee's 2 percent longer-run goal, and provided that longer-term inflation expectations remain well anchored.”13
Affordability in the mortgage market depends in part on the interest rate environment. The longer term 30-year fixed-rate mortgage interest rate, after falling to a low of 3.4 percent in the fourth quarter of 2012, has gradually risen to 4.2 percent in the second quarter of 2014.14 Shorter term fixed- and adjustable-rate mortgage interest rates remain at historical lows—
Freddie Mac reported that the one-year adjustable-rate mortgage rate averaged 2.4 percent in the second quarter of 2014. As a major contributor to the cost of mortgage financing, lower interest rates directly affect the affordability of buying a home or refinancing a mortgage. As the
economic recovery continues it is expected that interest rates, particularly longer term interest rates, will rise. For the 2015-2017 period, as shown in Tables 2 and 3, forecasts show that all interest rates are expected to increase, including the interest rate on a 30-year fixed-rate mortgage, which is expected to increase to 5.0 percent by the fourth quarter of 2015 and 5.4 percent in 2016. The 10-Year Treasury Yield is expected to increase to 3.4 percent in 2015, 4.0 percent in 2016 and 4.2 percent in 2017.
13
Federal Reserve Board of Governors. Federal Open Market Committee Statement, Press Release, June 18, 2014. 14
16 L o w -I n co m e B o rro w e r H P S h a re 1 26. 6% 24. 6% 24. 8% 25. 9% 24. 8% 23. 7% 22. 1% 22. 9 % 21. 9 % 21. 1% 20. 8% 21. 6 % 21. 5 % 20. 9% 20. 4% 20. 9% 26. 6% 23. 4% 21. 4% 20. 9% 20. 2% 19. 8% V e ry L o w -I n co m e B o rro w e r H P S h a re 2 8. 0% 6. 9% 7. 0% 7. 3% 6. 9% 6. 7% 6. 1% 6. 3% 6. 0% 5. 6% 5. 0% 5. 4% 6. 3% 5. 8% 5. 3% 5. 6% 7. 7% 6. 5% 5. 5% 5. 8% 5. 7% 5. 6% Lo w -I n co m e A re a H P S h a re 3 13. 2% 12. 3% 12. 1% 12. 8% 13. 2% 12. 5% 12. 4% 13. 4 % 13. 8 % 13. 0% 12. 9% 13. 7 % 14. 1 % 13. 4% 13. 3% 14. 1% 13. 5% 13. 4% 14. 3% 14. 7% 14. 7% 14. 2% L o w -I n co m e B o rro w e r R e fi . S h a re 4 20. 2% 23. 0% 21. 4% 21. 1% 20. 4% 20. 8% 22. 9% 25. 5 % 26. 6 % 27. 1% 27. 5% 29. 0 % 30. 0 % 30. 9% 31. 1% 32. 0% 22. 3% 22. 4% 27. 6% 31. 0% 33. 5% 34. 2% Re a l G D P 5 2. 2% 1. 6% 2. 5% 0. 1% 2. 7% 1. 8% 4. 4% 3. 5% -2 .1 % 3 .9 % 1 .7 % 3 .0 % 2 .8 % 2 .9 % 2 .9 % 2 .9 % 2 .3 % 2 .2 % 1 .9 % 2 .8 % 2 .9 % 2 .6 % No m in a l G D P 5 4. 3% 3. 5% 4. 3% 1. 6% 4. 2% 2. 8% 6. 1% 4. 9% -0 .8 % 5 .9 % 3 .4 % 4 .9 % 4 .7 % 5 .0 % 4 .9 % 4 .9 % 4 .2 % 3 .7 % 3 .5 % 4 .8 % 4 .6 % n. a. R e al P e rs on al C o n su m p ti o n 5 2. 7% 1. 3% 1. 9% 1. 9% 3. 5% 1. 8% 2. 0% 3. 7% 1. 2% 2. 4% 3. 2% 2. 7% 2. 6% 8. 7% 2. 4% 2. 4% 1. 8% 2. 4% 2. 4% 3. 8% 5. 4% 12. 4% R e a l R e si de nt ia l C o ns tr uc ti o n 5 23. 3% 4. 3% 13. 4% 18. 9% 7. 6% 17. 7% 10. 8% -8 .8 % -5. 4% 7. 3% 12. 4% 12. 5 % 12. 0 % 11. 0% 11. 1% 11. 1% 13. 5% 11. 9% 3. 1% 12. 0% 12. 6% n. a. In fl at io n R a te ( C P I, Y /Y % C h an ge ) 5 2. 8% 1. 9% 1. 7% 1. 9% 1. 7% 1. 4% 1. 6% 1. 2% 1. 4% 2. 1% 1. 7% 2. 3% 2. 1% 1. 6% 2. 2% 2. 3% 1. 9% 1. 2% 1. 2% 1. 4% 2. 1% 2. 1% C o re I n fl . R a te (C P I, Y /Y % C h a n g e ) 5 2. 2% 2. 3% 2. 0% 1. 9% 1. 9% 1. 7% 1. 7% 1. 7% 1. 6% 1. 9% 1. 9% 1. 9% 2. 0% 1. 8% 2. 0% 2. 0% 1. 9% 1. 7% 1. 7% 1. 6% 1. 9% 2. 0% C o re I n fl. R a te (P C E , Y /Y % C h a n g e ) 5 2. 0% 1. 9% 1. 8% 1. 7% 1. 5% 1. 2% 1. 2% 1. 2% 1. 1% 1. 3% 1. 3% 1. 4% 1. 6% 1. 7% 1. 8% 1. 9% 1. 7% 1. 2% 1. 2% 1. 1% 1. 3% n. a. U n em p lo y m en t R a te 8. 2% 8. 2% 8. 0% 7. 8% 7. 7% 7. 5% 7. 2% 7. 0% 6. 7% 6. 2% 6. 1% 6. 0% 5. 9% 5. 9% 5. 8% 5. 8% 8. 1% 7. 3% 6. 3% 5. 8% 5. 5% 5. 6% 10-Y e ar T re a su ry Y ie ld 2. 0% 1. 8% 1. 6% 1. 7% 1. 9% 2. 0% 2. 7% 2. 7% 2. 8% 2. 6% 2. 8% 2. 9% 3. 1% 3. 4% 3. 6% 3. 7% 1. 8% 2. 4% 2. 8% 3. 4% 4. 0% 4. 2% 1-Y e ar T re a su ry Y ie ld 0. 2% 0. 2% 0. 2% 0. 2% 0. 2% 0. 1% 0. 1% 0. 1% 0. 1% 0. 1% 0. 1% 0. 2% 0. 3% 0. 4% 0. 4% 0. 5% 0. 2% 0. 1% 0. 1% 0. 4% 1. 8% n. a. Pr im e R a te 3. 3% 3. 3% 3. 3% 3. 3% 3. 3% 3. 3% 3. 3% 3. 3% 3. 3% 3. 3% 3. 3% 3. 3% 3. 3% 3. 4% 3. 7% 3. 7% 3. 3% 3. 3% 3. 3% 3. 5% 4. 9% 5. 9% Fe de ra l F unds T a rg e t R a te 0. 10% 0. 15% 0. 14% 0. 16% 0. 14% 0. 12% 0. 08% 0. 09 % 0 .0 7 % 0. 09% 0. 10% 0. 20 % 0 .2 0 % 0. 30% 0. 70% 0. 90% 0. 14% 0. 11% 0. 12% 0. 53% 1. 80% n. a. C o ns um e r C o nf id e n ce 67. 4 65. 3 65. 0 70. 4 62. 6 75. 1 81. 0 74. 2 80. 6 83. 4 85. 0 83. 0 82. 0 83. 0 85. 0 85. 0 67. 0 73. 3 83. 0 83. 8 89. 0 89. 0 No te : S ha d ed ar ea in di ca te s h is tor ic al v al ues . F o re ca st s ar e a n av er ag e f o re ca st of M o rt ga ge B an k er s A ss o ci at io n ( M B A ), Fan ni e M ae, F re ddi e M ac, N at ion al A ss o ci at io n of R eal to rs , We lls F ar go, PN C F in an ci al ,t he N at ion al A ss o ci at io n of H o m e B ui ld er s, S tan dar d an d Poor 's , t he Wa ll S tr ee t J o ur na l S ur ve y, t he C o nf er en ce B o ar d, R ay m on d Ja m es F in an ci al , th e Fede ra l R es er ve B an k o f P hi la d el p hi a an d t he F ed eral O p en Mark et C o m m itt ee . 1S har e o f h o m e p ur ch ase m o rt ga ge o ri gi na tio ns m ad e t o lo w -i nco m e b o rro w er s i n t hat q uar te r ( year) . 2S ha re o f h o m e p urc ha se m o rt ga ge o ri gi na tio ns m ad e to v ery lo w -i nc o m e b o rro w ers in th at q ua rte r (y ea r) . 3S ha re of h o m e pu rc ha se m o rt ga ge o ri gi nat io ns on pr ope rt ie s l o ca te d i n l o w -i ncom e a rea s, e xc lu d in g t ho se in de si gn at ed di sa st er a rea s, in t hat q uar te r ( year) . 4S har e o f re fin an ce m o rt ga ge o ri gi nat io ns m ad e t o lo w -i nco m e b o rr o w er s in t hat q uar te r ( ye ar ). 5Q ua rt er o ver q ua rt er ch an ge , an nu al rat e. n. a. N o t a va ila bl e at t hi s tim e. 201 5 201 6 201 7 20 12 201 3 201 4 Q 1 Q 2 Q 3 Q 4 Q 3 Q 4 Q 1Q 2Q 3 Q 4 Q 1 Q 2Q 3 Q 4 Q 1Q 2 Ta bl e 2 E con om ic an d M o rt gage M a rk et O u tl ook 2 012 201 3 201 4 201 5
17
Unemployment. In addition to being an indicator of the health of the economy in general, the employment situation affects the housing market more directly because buying a house is considered a large investment and a long-term commitment that requires stable
employment. The unemployment rate has steadily fallen from 9.1 percent in August 2011 to 6.1 percent in June 2014. The labor force participation rate remains at 62.8 percent in June, the same rate for the third consecutive month.15
One of the stated objectives of the FOMC’s interest rate policy is supporting of maximum employment. Given the foreseeable monetary policy and the continued growth in the economy, the unemployment rate is expected to fall to an average 5.8 percent in 2015, 5.5 percent in 2016 and 5.6 percent in 2017 (see Table 2). To the extent that lower-income jobs are affected more by the employment situation, the affordable home purchase market is affected.
Inflation. The second stated objective of the FOMC in determining their interest rate policy is for price stability.As shown in Table 2, industry observers expect core inflation (excluding food and energy) to remain at or below 2.0 percent through 2017.
House Prices. Trends in house prices influence the housing and mortgage markets. In periods of house price appreciation, home sales and mortgage originations may increase as the expected return on investment rises.16 In periods of price depreciation or price uncertainty, home sales and mortgage originations tend to decrease as risk-averse homebuyers are reluctant to enter the market. House prices generally fell during 2009 through 2011, but turned around in 2012 with an increase of 5.6 percent in FHFA’s Purchase Only Home Price Index. In 2013, home prices increased at a rate of 7.7 percent. House prices are expected to continue to increase,
15
Bureau of Labor Statistics, News Release: The Employment Situation – June (July 3, 2014). 16
House prices and home sales can have a circular relationship, as they had between 2000 and 2006. As prices rose, and expectation of continued growth, demand grew. As demand grew, house prices rose even more.
18
however, at much more modest rates of 6.5 percent in 2014, 3.4, 2.3 and 1.9 percent in 2015, 2016 and 2017 respectively (see Table 3).
The expected increase in interest rates and home prices leads to an expected decrease in housing affordability. Housing affordability, as measured in Table 3 by the National Association of Realtors’ Housing Affordability Index, is expected to drop from an index of 200 at the end of 2012 to 115 by 2017.
Housing market. An active housing market is generally good for the affordable home market. When there are more homes for sale, potential home buyers have more options, prices tend to be more competitive and the search costs to find affordable housing decrease. Houses for sale volumes, as measured by months’ supply (the ratio of houses for sale to houses sold),
reached a seasonally adjusted high of 12.2 houses for sale to every house sold in January 2009 to a low of 3.9 in January 2013 and has steadily increases since, to 6.0 houses for sale to every house sold in July 2014 (which is just under the long-run average of 6.1).17
Refinance Rate. The size of the refinance mortgage market has an impact on the
affordable share of refinance mortgages. Historically, refinance mortgage volume increases when the refinancing of mortgages is motivated by low interest rates (“rate-and-term refinances”), and higher-income borrowers tend to make up a greater share of this increased volume. As a result, in periods of low interest rates the share of lower income borrowers will decrease. Likewise,
refinancings that occurred when interest rates were high tended to have a higher proportion of lower income
17
U.S. Census Bureau, “Houses for Sale by Regions and Months’ Supply at Current Sales Rate,” seasonally adjusted numbers.
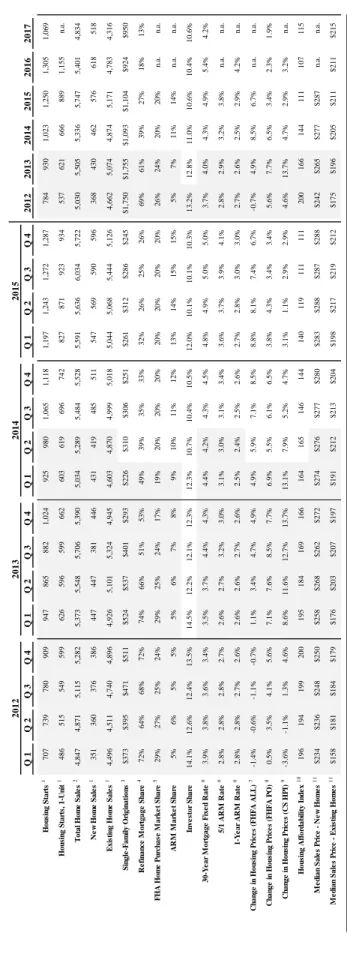
19 H o u si n g S tar ts 1 707 739 780 90 9 947 865 882 1, 024 925 980 1 ,065 1, 118 1, 197 1 ,243 1, 272 1, 287 784 930 1 ,0 23 1, 250 1 ,305 1, 069 H o u si n g St ar ts , 1-U n it 1 486 515 549 59 9 626 596 599 662 603 619 696 742 827 871 923 934 537 621 666 889 1 ,155 n. a. T o ta l Ho m e S a le s 2 4, 847 4, 871 5, 115 5, 28 2 5 ,373 5, 548 5, 706 5, 390 5, 034 5, 289 5 ,484 5, 528 5, 591 5 ,636 6, 034 5, 722 5 ,030 5, 505 5 ,3 36 5, 747 5 ,401 4, 834 Ne w H o m e S a le s 1 351 360 376 38 6 447 447 381 446 431 419 485 511 547 569 590 596 368 430 462 576 618 518 Ex is ti n g H o m e S a le s 1 4, 496 4, 511 4, 740 4, 89 6 4 ,926 5, 101 5, 324 4, 945 4, 603 4, 870 4 ,999 5, 018 5, 044 5 ,068 5, 444 5, 126 4 ,662 5, 074 4 ,8 74 5, 171 4 ,783 4, 316 Si n g le -F am il y O ri g in at io n s 3 $373 $395 $471 $51 1 $524 $537 $401 $293 $ 226 $310 $306 $251 $261 $312 $286 $ 2 45 $1, 750 $1, 755 $ 1, 0 9 3 $1, 104 $924 $950 R e fi n a n ce M o rt gage Sh ar e 4 72% 64% 68% 7 2 % 74% 66% 5 1 % 53% 49% 39 % 35% 33% 32% 26% 25% 26% 6 9% 61% 39% 27% 18% 13% FH A H o m e P u rc ha se M a rk e t S h a re 5 29% 27% 25% 2 4 % 29% 25% 2 4 % 17% 19% 20 % 20% 20% 20% 20% 20% 20% 2 6% 24% 20% 20% n. a. n. a. A R M Ma rk et S h a re 5% 6% 5% 5% 5% 6% 7% 8% 9% 10 % 11% 12% 13% 14% 15% 15% 5 % 7 % 1 1% 14% n. a. n. a. In ve st or Sh ar e 14. 1% 12 .6 % 12. 4% 13. 5% 14. 5% 12. 2% 12. 1 % 12. 3% 12. 3% 10. 7 % 10. 4% 10. 5% 12. 0% 10. 1% 10. 1 % 10. 3% 1 3 .2 % 12. 8% 11. 0% 10. 6% 10. 4% 10. 6% 30 -Y e a r M o rt gage F ixe d R a te 6 3. 9% 3 .8% 3. 6% 3. 4% 3. 5% 3. 7% 4. 4 % 4. 3% 4. 4% 4. 2 % 4. 3% 4. 5% 4. 8% 4. 9% 5. 0% 5. 0% 3. 7% 4. 0% 4. 3% 4. 9% 5. 4% 4. 2% 5/ 1 A R M R a te 6 2. 8% 2 .8% 2. 8% 2. 7% 2. 6% 2. 7% 3. 2 % 3. 0% 3. 1% 3. 0 % 3. 1% 3. 4% 3. 6% 3. 7% 3. 9% 4. 1% 2. 8% 2. 9% 3. 2% 3. 8% n. a. n. a. 1-Y e ar A R M R a te 6 2. 8% 2 .8% 2. 7% 2. 6% 2. 6% 2. 6% 2. 7 % 2. 6% 2. 5% 2. 4 % 2. 5% 2. 6% 2. 7% 2. 8% 3. 0% 3. 0% 2. 7% 2. 6% 2. 5% 2. 9% 4. 2% n. a. C h an ge i n H o u si n g P ri ce s ( F H F A A L L ) 7 -1 .4 % -0 .6% -1 .1 % -0. 7% 1. 1% 3. 4% 4. 7 % 4. 9% 4. 9% 5. 9 % 7. 1% 8. 5% 8. 8% 8. 1% 7. 4% 6. 7% -0 .7 % 4 .9 % 8 .5 % 6 .7 % n. a. n. a. C h an ge i n H o u si n g P ri ce s ( F H F A P O ) 8 0. 5% 3 .5% 4. 1% 5. 6% 7. 1% 7. 6% 8. 5 % 7. 7% 6. 9% 5. 5 % 6. 1% 6. 5% 3. 8% 4. 3% 3. 4% 3. 4% 5. 6% 7. 7% 6. 5% 3. 4% 2. 3% 1. 9% C h an ge i n H o u si n g P ri ce s ( C S H P I) 9 -3 .6 % -1 .1% 1. 3% 4. 6% 8. 6% 11. 6% 12. 7 % 13. 7% 13. 1% 7. 9 % 5. 2% 4. 7% 3. 1% 1. 1% 2. 9% 2. 9% 4. 6% 13. 7% 4. 7% 2. 9% 3. 2% n. a. H o u sin g Aff o rd a b il ity In d e x 10 196 194 199 20 0 195 184 169 166 164 165 146 144 140 119 111 111 200 166 144 111 107 115 Med ia n S a le s P ri ce - N e w H o m e s 11 $234 $236 $248 $25 0 $258 $268 $262 $272 $ 274 $276 $277 $280 $283 $288 $287 $ 2 88 $242 $265 $ 277 $287 n. a. n. a. M e d ia n S a le s P ric e - E x is ti n g H o m e s 11 $158 $181 $184 $17 9 $176 $203 $207 $197 $ 191 $212 $213 $204 $198 $217 $219 $ 2 12 $175 $196 $ 205 $211 $211 $215 No te : Sh ade d ar ea in di cat es h is tor ic al v al ue s. F o re cas ts ar e an av er ag e f o re ca st of M o rt ga ge B an k er s A ss o ci at io n ( M B A ), Fan ni e M ae, F red d ie Ma c, N at io na l A sso ci at io n o f R eal to rs , W el ls F ar go , P N C F in an ci al ,t he N at io na l A sso ci at io n of H o m e B ui ld er s, S tan da rd an d Poor 's , t he Wal l St re et J o ur na l Su rv ey , t he C o nf er en ce B o ar d, R ay m on d J am es Fi na nc ia l, t he F eder al R es er ve B an k of Ph ila de lp hi a a nd t he Feder al O p en M ar k et C o m m itt ee. 1T hou sa nd s of u ni ts 2T hou sa nd s of u ni ts , f o re ca st ed am ou nt doe s no t equ al t he su m of t he ex is tin g pl us n ew h o m e s al es beca us e of di ff er en ce s i n fo re ca sts. 3F H F A a nd M B A , B illio ns o f d o lla rs 4T he r ef in an ce s har es f o r 2004 -2009 ar e cal cu lat ed f rom H o m e M o rt ga ge D is cl o su re A ct ( H M D A ) da ta . Pr el im in ar y es tim at es in 2010 ar e as r epo rt ed by MB A . 5T he FH A m ar k et s har es f o r 2008 ar e c al cu la ted fr om H M D A dat a. Pr el im in ar y es tim at es f o r 2009 ar e th e FH A en dor se m en ts ( F H A O ut lo o k ) sh ar e o f h o m e sa le s (C en su s B ure au ), s ca le d to m atc h t he m o rtg ag e m ark et F H A m ark et sh ar e. 6Fr eddi e Ma c, Pr im ar y Mor tg ag e M ar k et S ur vey 7FH F A H o us e Pr ice In dex , al l t ran sa ct io ns ( Y /Y % C han ge ) 8F H F A H o us e P ri ce I nd ex, p ur cha se t ra ns ac tio ns o nl y (Y /Y % C ha ng e, S ea so na lly A d ju st ed ) 9St an dar d & P oor 's C as e-S hi lle r 10 C ity I ndex ( Y /Y % C ha ng e, S ea son al ly A d ju st ed ) *F re d d ie M ac 's C o nve nt io na l M o rt ga ge H o m e P ri ce I nd ex (Y /Y % C ha nge , A nn ua l R at e) 10 N at ion al A ssoc iat io n of R ea lto rs 11 T hou sa nd s of dol la rs n. a. N o t av ai la b le a t t hi s t im e. Ta b le 3 H o u si n g a n d M o rt g a g e M a rk et O u tl o o k 20 14 Q 1Q 2Q 3Q 4 2 015 Q 1Q 2Q 3 Q 4 Q 1Q 2Q 3Q 4 2013 Q 1 Q 2Q 3Q 4 2012 20 13 2016 201 7 2015 2 014 2012
20
homeowners who were consolidating their debts or who were drawing equity out of their homes for other uses.
In 2014, for the first time in more than five years less than half of mortgage originations are expected to be for the purpose of refinancing an existing mortgage. As interest rates continue to rise, the share of originations from refinancing is expected to fall to 26 percent of mortgage originations in 2015 and less than 20 percent in 2016 and 2017, see Table 3.
Market Performance of Housing Goal Eligible Mortgages. The estimates of the market performance for the two single-family owner-occupied home purchase housing goals and one subgoal, and the refinancing mortgage housing goal, are provided at the top of Table 2. The estimates for the low-income borrower shares of the home purchase mortgage market are 20.9 percent in 2015, 20.2 percent in 2016 and 19.8 percent in 2017. The estimates for the very low-income borrower shares of the home purchase mortgage market are 5.8, 5.7 and 5.6 percent, respectively, in 2015, 2016 and 2017. The estimates for the share of goal-qualifying mortgages in low-income areas in the home purchase mortgage market, excluding designated disaster areas, are 14.7 percent of home purchase mortgages in 2015, 14.7 percent in 2016 and 14.2 percent in 2017. The estimates for the low-income refinancing goal are 31.0 percent in 2015, 33.5 percent in 2016 and 34.2 percent in 2017.
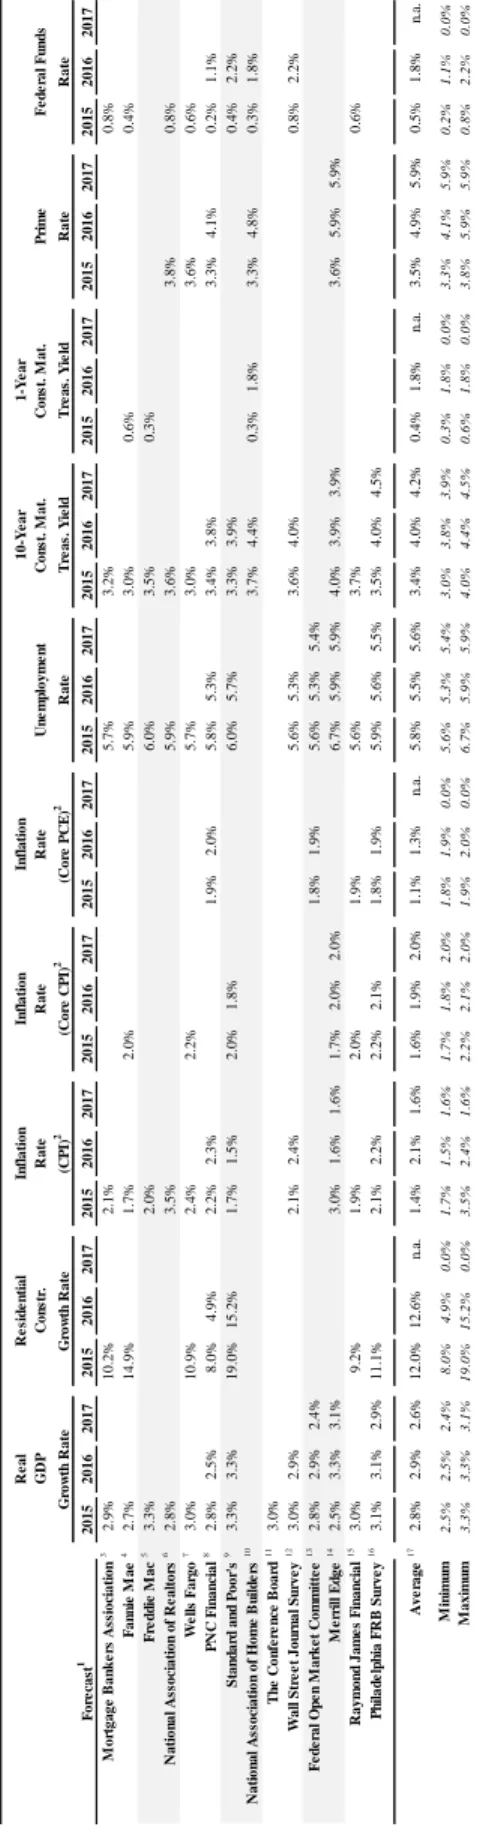
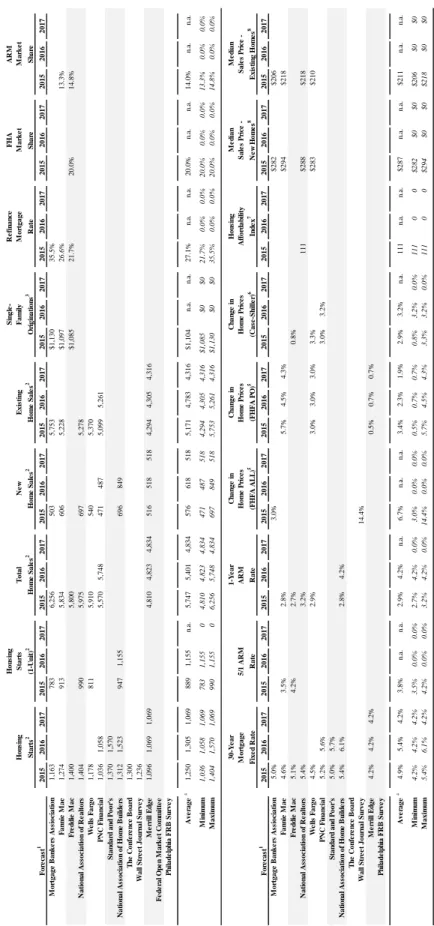
To arrive at these market projections, forecasts were compiled from thirteen industry and government sources (industry observers). The list of forecasters, along with each forecaster’s annualized projections for 2014 through 2017 of the market indicators are provided in Tables 4
and 5. The forecasts are all provided on either a quarterly or annual basis for each market
21 2 0 1 5 201 6 2 0 1 7 2 0 1 5 201 6 201 7 201 5 2 0 1 6 2 017 2 0 1 5 20 16 2 017 2 015 201 6 2 0 1 7 2 015 201 6 2 0 1 7 2 0 1 5 2 01 6 2 0 1 7 2 0 1 5 2 016 201 7 2 0 1 5 2 0 1 6 2 01 7 201 5 2 0 1 6 2 017 M o rt ga ge B a n k e rs A ss ioc ia ti on 3 2 .9% 10 .2 % 2 .1% 5. 7 % 3. 2 % 0 .8% Fa n n ie M a e 4 2.7 % 1 4 .9 % 1.7 % 2.0 % 5 .9% 3 .0% 0. 6% 0.4 % F red d ie M a c 5 3.3 % 2.0 % 6 .0% 3 .5% 0. 3% N a ti on al A ss o ci at io n o f R e al to rs 6 2.8 % 3.5 % 5 .9% 3 .6% 3.8 % 0.8 % W e lls F a rg o 7 3 .0% 10 .9 % 2 .4% 2 .2% 5. 7 % 3. 0 % 3 .6% 0 .6% P N C F ina nc ia l 8 2 .8% 2 .5% 8 .0% 4 .9% 2 .2% 2. 3 % 1. 9 % 2 .0% 5. 8 % 5 .3% 3. 4 % 3 .8% 3 .3% 4. 1 % 0 .2% 1. 1 % S tan d a rd an d P o or 's 9 3.3 % 3.3 % 1 9 .0 % 1 5.2 % 1.7 % 1 .5% 2.0 % 1. 8% 6 .0% 5.7 % 3 .3% 3.9 % 0.4 % 2 .2% N a ti o n a l A ss o ci a tio n o f H o m e B u ild e rs 10 3 .7% 4.4 % 0. 3% 1 .8% 3.3 % 4 .8% 0.3 % 1 .8% T h e C o n fer e n ce B o a rd 11 3 .0 % W a ll St re e t Jou rn al Su rv e y 12 3 .0% 2 .9% 2 .1% 2. 4 % 5. 6 % 5 .3% 3. 6 % 4 .0% 0 .8% 2. 2 % F e d e ra l O p en M a rk et C o m m it te e 13 2.8 % 2.9 % 2. 4% 1 .8% 1.9 % 5 .6% 5.3 % 5. 4% M e rr ill E d g e 14 2.5 % 3.3 % 3. 1% 3.0 % 1 .6% 1 .6% 1.7 % 2. 0% 2 .0% 6 .7% 5.9 % 5. 9% 4 .0% 3.9 % 3.9 % 3.6 % 5 .9% 5.9 % R a ym on d J a m e s F in a n ci a l 15 3.0 % 9.2 % 1.9 % 2.0 % 1 .9% 5 .6% 3 .7% 0.6 % P h ila d e lp h ia F R B S u rv e y 16 3.1 % 3.1 % 2. 9% 1 1 .1 % 2.1 % 2 .2% 2.2 % 2. 1% 1 .8% 1.9 % 5 .9% 5.6 % 5. 5% 3 .5% 4.0 % 4.5 % 17 2.8 % 2.9 % 2. 6% 1 2 .0 % 1 2.6 % n. a. 1.4 % 2 .1% 1 .6% 1.6 % 1. 9% 2 .0% 1 .1% 1.3 % n. a. 5 .8% 5.5 % 5. 6% 3 .4% 4.0 % 4.2 % 0. 4% 1 .8% n. a. 3.5 % 4 .9% 5.9 % 0.5 % 1 .8% n. a. 2. 5% 2. 5% 2 .4% 8. 0% 4. 9% 0. 0% 1 .7% 1. 5 % 1. 6 % 1. 7% 1 .8% 2. 0 % 1. 8 % 1 .9% 0. 0 % 5. 6 % 5. 3% 5 .4% 3. 0 % 3. 8% 3 .9% 0 .3% 1. 8 % 0 .0% 3 .3% 4. 1 % 5. 9% 0 .2% 1. 1 % 0. 0 % 3. 3% 3. 3% 3 .1% 19 .0 % 15. 2% 0. 0% 3 .5% 2. 4 % 1. 6 % 2. 2% 2 .1% 2. 0 % 1. 9 % 2 .0% 0. 0 % 6. 7 % 5. 9% 5 .9% 4. 0 % 4. 4% 4 .5% 0 .6% 1. 8 % 0 .0% 3 .8% 5. 9 % 5. 9% 0 .8% 2. 2 % 0. 0 % 1 F o recas ts ar e an n u a l av e ra g es o f q u ar te rl y f o re c a s ts , w h e re ap p li c ab le . 2 F o u rt h Q u ar te r o v e r F o u rt h Q u ar te r P e rcen t C h an g e . 3 L a s t U p d a te d 7 /15/ 2014 4 L a s t U p d a te d 7 /10/ 2014 5 L a s t U p d a te d 7 /18/ 2014 6 L a s t U p da te d 7 /1 /2 0 1 4 7 L a s t Up d a te d 7 /9 /2 01 4 , U .S. E c o n o m ic Fo re c a s t a n d , U. S. Ho u s in g M a rk e t Fo re c a s t. 8 L a s t U p d a te d 6 /24/ 2014 9 L a s t U p d a te d 6 /25/ 2014 10 L a s t U p d a te d 6 /30/ 2014 11 L a s t U p da te d 7 /9 /2 0 1 4 12 L a s t U p da te d 7 /1 /2 0 1 4 , s u rv ey of 5 7 f o re c a s te rs . 13 L a s t U p d a te d 6 /18/ 2014 , m id p o in t o f t h e c e n tr a l t e n d e n c y p ro je c ti o n . 14 L a s t U p d a te d 7 /17/ 2014 15 L a s t U p d a te d 6 /11/ 2014 16 L a s t U p d a te d 5 /16/ 2014 , s u rv e y o f 4 5 f o re c a s te rs . 17 A v er ag es i n cl u d e act u a l v a lu es f o r m o n th s w h en av ai la b le. T h er ef o re th e av er ag e l in e m a y n o t e q u a l t h e av e ra g e o f th e ab o v e n u m be rs . 7/ 9/ 20 14 Ra te (C P I) 2 Mi n im u m Ma x im u m Av e ra g e GD P G ro w th R a te Co n st r. G ro w th R a te Fo re ca st 1 C o n st. M a t. T rea s. Y iel d Co n st . M a t. T rea s. Y iel d Ra te (C o re C P I) 2 Ra te (Co re P C E ) 2 U n e m pl o y m e nt Ra te 1 0 -Y e a r 1 -Y e a r Ta b le 4 F o recas ts of E con om ic I n d icat o rs b y S o u rce R e si de nt ia l R e a l In fla tio n In fl a tio n In fla ti o n Pr im e Ra te F e de ra l F u nds Ra te
22 2015 201 6 201 7 201 5 201 6 2 0 1 7 2 0 1 5 2 0 1 6 2 0 1 7 2 0 1 5 2 016 2 017 2 015 2 016 2017 20 15 2016 201 7 201 5 201 6 201 7 201 5 2 0 1 6 2 0 1 7 2 0 1 5 2 0 1 6 2 017 Mo rt g a g e B a n k e rs A ssi o ci a ti o n 1 ,16 3 7 8 3 6, 256 503 5, 753 $1 ,1 3 0 35. 5% Fa n n ie M a e 1 ,27 4 9 1 3 5, 834 606 5, 228 $1 ,0 9 7 26. 6% 13. 3% Fr e d d ie M a c 1 ,40 0 5, 800 $1 ,0 8 5 21. 7% 20. 0% 14. 8% N a ti o n al A ss o ci at io n o f R e al to rs 1 ,40 4 9 9 0 5, 975 697 5, 278 We ll s F a rg o 1 ,17 8 8 1 1 5, 910 540 5, 370 P N C F ina nc ia l 1 ,03 6 1 ,0 58 5, 570 5, 748 471 487 5, 099 5, 261 St an d a rd an d P oor 's 1 ,3 7 0 1 ,5 7 0 N a ti on a l A ss o ci at io n of H o m e B u il d e rs 1 ,31 2 1 ,5 23 9 4 7 1 ,1 55 696 849 T h e C o n fer e n ce B o a rd 1 ,3 0 0 W a ll S tre e t J o u rn a l S u rv e y 1 ,2 3 6 M e rr ill E d g e 1 ,09 6 1 ,0 69 1, 0 6 9 4, 810 4, 823 4, 834 516 518 518 4, 294 4, 305 4, 316 F e d e ra l O p e n M a rk e t C o m m it te e Ph il a d e lp h ia FR B S u rv e y 4 1 ,25 0 1 ,3 05 1, 0 6 9 8 89 1, 1 5 5 n. a. 5 ,747 5, 401 4, 834 576 618 518 5, 171 4, 783 4, 316 $1 ,1 0 4 n. a. n. a. 27. 1% n. a. n. a. 20. 0% n. a. n. a. 14. 0% n. a. n. a. 1, 036 1, 058 1, 069 783 1, 155 0 4 ,8 1 0 4 ,82 3 4 ,8 3 4 47 1 4 8 7 5 1 8 4 ,2 94 4, 3 0 5 4 ,316 $1, 085 $0 $ 0 21 .7 % 0 .0 % 0 .0 % 2 0. 0 % 0. 0% 0. 0% 13. 3% 0. 0% 0. 0% 1, 404 1, 570 1, 069 990 1, 155 0 6 ,2 5 6 5 ,74 8 4 ,8 3 4 69 7 8 4 9 5 1 8 5 ,7 53 5, 2 6 1 4 ,316 $1, 130 $0 $ 0 35 .5 % 0 .0 % 0 .0 % 2 0. 0 % 0. 0% 0. 0% 14. 8% 0. 0% 0. 0% 2015 201 6 201 7 201 5 201 6 2 0 1 7 2 0 1 5 2 0 1 6 2 0 1 7 2 0 1 5 2 016 2 017 2 015 2 016 2017 20 15 2016 201 7 201 5 201 6 201 7 201 5 2 0 1 6 2 0 1 7 2 0 1 5 2 0 1 6 2 017 Mo rt g a g e B a n k e rs A ssi o ci a ti o n 5. 0% 3 .0% $2 82 $ 206 Fa n n ie M a e 4. 6% 3. 5% 2. 8% 5 .7% 4. 5 % 4. 3 % $2 94 $ 218 Fr e d d ie M a c 5. 1% 4. 2% 2. 7% 0. 8% N a ti o n al A ss o ci at io n o f R e al to rs 5. 4% 3. 2% 1 1 1 $2 88 $ 218 We ll s F a rg o 4. 5% 2. 9% 3 .0% 3. 0 % 3. 0 % 3. 3% $2 83 $ 210 P N C F ina nc ia l 5. 2% 5. 6% 3. 0% 3. 2% St an d a rd an d P oor 's 5 .0 % 5 .7 % N a ti on a l A ss o ci at io n of H o m e B u il d e rs 5. 4% 6. 1% 2. 8% 4. 2% T h e C o n fer e n ce B o a rd W a ll S tre e t J o u rn a l S u rv e y 1 4 .4 % M e rr ill E d g e 4. 2% 4. 2% 4. 2% 0 .5% 0. 7 % 0. 7 % Ph il a d e lp h ia FR B S u rv e y 4 4. 9% 5. 4% 4. 2% 3. 8% n. a. n. a. 2. 9% 4. 2% n. a. 6 .7% n. a. n. a. 3 .4% 2. 3 % 1. 9 % 2. 9% 3. 2% n. a. 1 1 1 n. a. n. a. $ 2 8 7 n. a. n. a. $ 211 n. a. n. a. 4 .2% 4. 2 % 4. 2 % 3. 5 % 0. 0 % 0. 0% 2. 7% 4. 2% 0. 0% 3. 0% 0. 0% 0. 0% 0. 5% 0. 7% 0. 7% 0 .8% 3 .2% 0. 0 % 111 0 0 $282 $0 $ 0 $20 6 $ 0 $ 0 5 .4% 6. 1 % 4. 2 % 4. 2 % 0. 0 % 0. 0% 3. 2% 4. 2% 0. 0% 14. 4% 0. 0% 0. 0% 5. 7% 4. 5% 4. 3% 3 .3% 3 .2% 0. 0 % 111 0 0 $294 $0 $ 0 $21 8 $ 0 $ 0 1 F o recas ts ar e a nnua l a v e ra g e s of qua rt e rl y f o re ca s ts , w h e re a ppl ic a b le . S e e T a bl e 2 f o r u pda te i n fo rm a ti on. T h e F O MC a nd R a ym ond Ja m e s & As s o c ia te s onl y pr ovi de f o re c a s ts on ba s ic m a c roe c onom ic s e ri e s a nd th e re for e a re om it te d fr om t h e m o rt g age / hous ing f o recas t tab le ( s ee T a b le 2 ). 2 T hous a nds of uni ts 3 B il li ons of dol la rs 4 Ave ra g e s in cl ude a c tua l va lu e s f o r m ont hs w h e n a v a il a bl e . T h e re for e t h e a v e ra g e l ine m a y not e qua l t h e a v e ra g e of t h e a bove num be rs . 5 F e de ra l H o u si ng F ina nc e A g e n c y : A ll tr a n s a c ti ons a n d hom e P u rc ha s e onl y hom e pr ic e in d ic ie s ( Q 4 /Q 4 % C h a nge ). 6 S ta nda rd & P o or 's / C a s e -S hi ll e r H o m e P ri c e I nde x, 1 0 -C it y C o m pos it e ( Q 4 /Q 4 % C h a nge ). 7 H o u s in g A ff o rd ab ili ty I n d e x (4 th Q u ar te r) , N a ti o n al A s s o ci at io n o f R eal to rs . F o recas ts ar e s cal ed to N A R 's q u ar te rl y H A I s e ri e s. 8 T hous a nds of dol la rs Ne w E x is ti n g Ma rk e t Ma rk et Ho u si n g F a m il y M o rt gage S ta rts T o ta l Av e ra g e Mi n im u m Sh ar e S h a re Ho m e S a le s 2 Ho m e S a le s 2 Ho u sin g M e d ia n O rig in a ti o n s 3 Med ia n Fo re ca st 1 Ra te M axi m u m F ix e d Ra te Ra te Ex is ti n g H o m e s 8 A ff o rd a b il it y S a le s P ri ce -Inde x 7 Sa le s P ri ce -Ne w H o m e s 8 Ta b le 5 F o reca st s o f H o u si n g a n d M o rt g a g e M a rk et I n d ica to rs b y S o u rce 1-Y e ar C h a n ge i n C h an ge i n C h a n ge i n Mi n im u m M axi m u m Av e ra g e Si n g le -R e fi n a n ce F H A A R M Ho u sin g Ra te M o rt g age Fo re ca st 1 Ho m e P ric e s (F H F A AL L ) 5 (F HF A P O ) 5 (C a se -S h ill e r) 6 5 /1 A R M A R M Ho m e P ric e s Ho m e P ric e s 30 -Y e a r St ar ts 2 (1 -U n it) 2 Ho m e S a le s 2
23
performance for each goal, based on the monthly time series database provided by the FFIEC and the Federal Reserve Board. For the low-income areas goal, this model produced only the market estimates for the subgoal. The remainder of the market estimates for this goal relates to the designated disaster areas. The 2015 through 2017 estimates of the share of home purchase mortgages that will qualify for the designated disaster areas portion of the low-income areas goal will be provided in January of each year, based on data provided by the Federal Emergency Management Agency (FEMA).18
18
24
E. STATISTICAL MODELS OF THE SINGLE-FAMILY HOUSING GOALS
As stated previously, one of the issues with HMDA data is that data on mortgage originations will lag from 9 to 21 months behind the current month. At this point in time the most recent year for which HMDA data are available is 2012. Fortunately there exists more recent data that can be used to inform the forecasts and econometric techniques to take advantage of them.
To estimate the 2015 through 2017 market shares for the four single-family housing goals, a state space form (SSF) is incorporated with the associated algorithms of the Kalman filter and smoother.19 This SSF approach is a method by which the time series gap left by
HMDA data can be statistically filled in with a similar time series which is highly correlated with it. For the home purchase goals, an estimate of monthly market affordability levels for the home purchase goals from the Monthly Interest Rate Survey (MIRS) data is used.20 The market size for the refinance goal is estimated using the SSF approach based on the combined Fannie Mae and Freddie Mac goal shares for January 2004 – March 2014.
Several specifications of the auto-regressive (AR) model were tested for each housing goal. All of the time series, both the dependent (goal qualifying share) and independent (explanatory), were found to be stationary when integrated at the first level.21 While several exogenous variables had the expected sign, many were found to be insignificant at a 10 percent level of confidence. The equations were fitted with monthly binary variables to capture
19
The methodology followed is an adaptation of a state space model developed by Freddie Mac, Housing Analysis and Research. For a thorough discussion of the state space approach see Harvey, Andrew. “Forecasting with Unobserved Components Time Series Models,” in Handbook of Economic Forecasting. G. Elliott, C.W.J. Granger and A. Timmermann eds. North Holland, 2006, pp. 327-412.
20
This is an estimated time series of goal-qualifying shares based on MIRS date from 2004 through 2013. 21
In simple terms, a stationary time series has no trend, has a constant variance over time, has a constant autocorrelation structure and has no periodic fluctuations (seasonality).
25
seasonality effects, as opposed to moving average terms which have no forecasting value. The best fitting estimation equations for each of the goals are described in the following sections.
Income Borrower Income Home Purchase Goal. The four drivers of the Low-Income Borrower Home Purchase Goal are presented in Figure 7. Three of the four show a positive correlation with affordable share of mortgage originations. The positive correlation with home sales is as expected in that a more active market leads to a higher share affordable
mortgage originations. The negative correlation with interest rates, the rate spread between the 10-Year Treasury and the 30-Year Mortgage, and median house prices also follow what is expected. The positive relationship with the unemployment rate mirrors the negative correlation of affordability trends with growth in the economy in general.
The AR model estimation results for the Low-Income Borrower Income Home Purchase Goal (LIP) are presented in Table 6. The best fitting equation was found to be a first differenced seasonal AR model with two autoregressive terms, AR(1) and AR(2),both significant. In addition to the time series components, drivers of this housing goal include log of total home sales,
ln(SALES), the 10-Year Treasury rate, TREAS_10, the rate spread between the 10-Year Treasury
and the 30-Year Mortgage, SPREAD_T10_F30, the unemployment rate lagged one month,
UNEMPt-1, and the median house price for existing homes, ln(MEDPRICE_E). The Chi-Square
statistic indicates that the hypothesis that the residuals are white noise cannot be rejected. For more information on the LIP model, see Appendix A.
26
*Rate Spread between the 30-Year Fixed Rate Mortage and the 10-Year Treasury Yield.
Drivers of the Low-Income Borrower Home Purchase Goal Figure 7 0 1,000 2,000 3,000 4,000 5,000 6,000 7,000 8,000 9,000 0% 5% 10% 15% 20% 25% 30% 35% Ja n ‐ 04 No v ‐ 04 Se p ‐ 05 Ju l ‐ 06 Ma y ‐ 07 Ma r ‐ 08 Ja n ‐ 09 No v ‐ 09 Se p ‐ 10 Ju l ‐ 11 Ma y ‐ 12 Ma r ‐ 13 Ja n ‐ 14 No v ‐ 14 Se p ‐ 15 Ju l ‐ 16 Ma y ‐ 17 Th ous ands Home Sales (+)
LIP Share Forecast Total Home Sales Forecast
0% 1% 2% 3% 4% 5% 6% 0% 5% 10% 15% 20% 25% 30% 35% Ja n ‐ 04 Oc t ‐ 04 Ju l ‐ 05 Ap r ‐ 06 Ja n ‐ 07 Oc t ‐ 07 Ju l ‐ 08 Ap r ‐ 09 Ja n ‐ 10 Oc t ‐ 10 Ju l ‐ 11 Ap r ‐ 12 Ja n ‐ 13 Oc t ‐ 13 Ju l ‐ 14 Ap r ‐ 15 Ja n ‐ 16 Oc t ‐ 16 Ju l ‐ 17 Interest Rates (‐)
LIP Share Forecast 10‐Yr Treas Rate Forecast
0% 2% 4% 6% 8% 10% 12% 0% 5% 10% 15% 20% 25% 30% 35% Ja n ‐ 04 Oc t ‐ 04 Ju l ‐ 05 Ap r ‐ 06 Ja n ‐ 07 Oc t ‐ 07 Ju l ‐ 08 Ap r ‐ 09 Ja n ‐ 10 Oc t ‐ 10 Ju l ‐ 11 Ap r ‐ 12 Ja n ‐ 13 Oc t ‐ 13 Ju l ‐ 14 Ap r ‐ 15 Ja n ‐ 16 Oc t ‐ 16 Ju l ‐ 17 Unemployment Rate (+)
LIP Share Forecast
Unemployment Rate, Lag 1 Forecast
$0 $50,000 $100,000 $150,000 $200,000 $250,000 0% 5% 10% 15% 20% 25% 30% 35% Ja n ‐ 04 No v ‐ 04 Se p ‐ 05 Ju l ‐ 06 Ma y ‐ 07 Ma r ‐ 08 Ja n ‐ 09 No v ‐ 09 Se p ‐ 10 Ju l ‐ 11 Ma y ‐ 12 Ma r ‐ 13 Ja n ‐ 14 No v ‐ 14 Se p ‐ 15 Ju l ‐ 16 Ma y ‐ 17
Median House Prices (‐)
LIP Share Forecast
Median Price ‐ Existing Homes Forecast 0.0% 0.5% 1.0% 1.5% 2.0% 2.5% 3.0% 3.5% 0% 5% 10% 15% 20% 25% 30% 35% Ja n ‐ 04 Oc t ‐ 04 Ju l ‐ 05 Ap r ‐ 06 Ja n ‐ 07 Oc t ‐ 07 Ju l ‐ 08 Ap r ‐ 09 Ja n ‐ 10 Oc t ‐ 10 Ju l ‐ 11 Ap r ‐ 12 Ja n ‐ 13 Oc t ‐ 13 Ju l ‐ 14 Ap r ‐ 15 Ja n ‐ 16 Oc t ‐ 16 Ju l ‐ 17 Mortgage Rates (‐)
27 Variable AR(1) -0.3960 ( -4.29 ) *** AR(2) 0.4895 ( 5.29 ) *** TREAS_10 -0.6408 ( -2.49 ) ** SPREAD_T10_F30 -1.0289 ( -2.21 ) ** UNEMPt-1 0.6612 ( 2.14 ) ** ln(MEDPRICE_E) -0.1183 ( -3.69 ) *** ln(Sales) 0.0958 ( 8.85 ) *** JAN -0.0055 ( -1.97 ) ** FEB 0.0075 ( 3.42 ) *** MAR -0.0096 ( -3.61 ) *** APR 0.0131 ( 4.95 ) *** MAY -0.0065 ( -2.28 ) ** JUN 0.0034 ( 1.15 ) JUL -0.0106 ( -3.92 ) *** AUG 0.0062 ( 2.40 ) ** SEP -0.0031 ( -1.15 ) OCT 0.0111 ( 5.23 ) *** NOV -0.0092 ( -4.09 ) *** = = Prob(2) =
* Significant at 10 percent level. ** Significant at 5 percent level. *** Significant at 1 percent level.
13.48 0.0361 0.000032000
Table 6
Low-Income Borrower Home Purchase Goal Parameter
28
The forecasts for the Low-Income Borrower Income Home Purchase Goal are shown in
Figure 8. While the state space form provides the best forecast, the forecasts based on HMDA
data alone and where the HMDA time series is merely amended with the alternative time series are shown in Figure 8. The state space form forecast averages 20.9, 20.2 and 19.8 percent in 2015 through 2017, respectively. Also, for reference, the figure is annotated with the 2010-2011 goal benchmark (27 percent) and the 2012-2014 benchmark (23 percent).
30
Very Low-Income Borrower Income Home Purchase Goal. The four drivers of the Very Low-Income Borrower Home Purchase Goal are presented in Figure 9. Three of the four show a positive correlation with the share of mortgage originations made to very low-income borrowers. The negative sign on house prices is as expected, however the sign on house prices one month in the past is positive. The positive correlation with the unemployment is obvious from Figure 9
and reflects the cycle correlation of the housing market with the economy in general, as illustrated in Figure 1 (above). The positive correlation with inflation reflects the general long term increase in affordable mortgage originations over time. As expected, an increase in house prices leads to a smaller share of mortgages from very low-income borrowers.
Drivers of the Very Low-Income Borrower Home Purchase Goal Figure 9 0 50 100 150 200 250 300 0% 2% 4% 6% 8% 10% 12% Ja n ‐ 04 Oc t ‐ 04 Ju l ‐ 05 Ap r ‐ 06 Ja n ‐ 07 Oc t ‐ 07 Ju l ‐ 08 Ap r ‐ 09 Ja n ‐ 10 Oc t ‐ 10 Ju l ‐ 11 Ap r ‐ 12 Ja n ‐ 13 Oc t ‐ 13 Ju l ‐ 14 Ap r ‐ 15 Ja n ‐ 16 Oc t ‐ 16 Ju l ‐ 17 Inflation (+)
VLI Share Forecast
CPI, excl. Food and Energy Forecast
0% 2% 4% 6% 8% 10% 12% 0% 2% 4% 6% 8% 10% 12% Ja n ‐ 04 Oc t ‐ 04 Ju l ‐ 05 Ap r ‐ 06 Ja n ‐ 07 Oc t ‐ 07 Ju l ‐ 08 Ap r ‐ 09 Ja n ‐ 10 Oc t ‐ 10 Ju l ‐ 11 Ap r ‐ 12 Ja n ‐ 13 Oc t ‐ 13 Ju l ‐ 14 Ap r ‐ 15 Ja n ‐ 16 Oc t ‐ 16 Ju l ‐ 17 Unemployment Rate (+)
VLI Share Forecast
Unemployment Rate, Lag 1 Forecast
0 50 100 150 200 250 0% 2% 4% 6% 8% 10% 12% Ja n ‐ 04 Oc t ‐ 04 Ju l ‐ 05 Ap r ‐ 06 Ja n ‐ 07 Oc t ‐ 07 Ju l ‐ 08 Ap r ‐ 09 Ja n ‐ 10 Oc t ‐ 10 Ju l ‐ 11 Ap r ‐ 12 Ja n ‐ 13 Oc t ‐ 13 Ju l ‐ 14 Ap r ‐ 15 Ja n ‐ 16 Oc t ‐ 16 Ju l ‐ 17
House Prices, One Month Prior (+)
VLI Share Forecast FHFA HPI (PO), lag 1 Forecast 0 50 100 150 200 250 0% 2% 4% 6% 8% 10% 12% Ja n ‐ 04 Oc t ‐ 04 Ju l ‐ 05 Ap r ‐ 06 Ja n ‐ 07 Oc t ‐ 07 Ju l ‐ 08 Ap r ‐ 09 Ja n ‐ 10 Oc t ‐ 10 Ju l ‐ 11 Ap r ‐ 12 Ja n ‐ 13 Oc t ‐ 13 Ju l ‐ 14 Ap r ‐ 15 Ja n ‐ 16 Oc t ‐ 16 Ju l ‐ 17 House Prices (‐)