Determinants of Capital Structure and the Role of Capital
Structure on Firm Value
Wiston Manihuruk Djumahir Sumiati
Graduate Program, Faculty of Economics and Business, Brawijaya University Abstract
The purpose of this research is to examine the determinants of capital structure and role of capital structure on firm value of the Go Public listed Indonesian Stock Exchange. In this research, the determinants of capital structure are liquidity, volatilities of earnings, profitability, size of the firm, capital expenditures and firm growth. Data analysis was performed on manufacturing companies which were listed in Indonesia Stock Exchange from 2008 to 2012. Results of data analysis using econometric model and panel data analysis showed that liquidity, profitability, size of the firm and capital expenditures has significant effect to capital structure, while no significant effect was found between volatilities of earnings and firm growth against company’s capital structure. Result of this study also found that capital structure didn’t have significant effect to firm value.
Keywords: capital structure, firm value, liquidity, earnings volatilities, profitability, firm size, capital expenditures, firm growth.
1. INTRODUCTION
Capital structure is one of the important aspects in financial management and becomes an interesting topic to discuss. Capital structure policy is important since the policy highly influences financial performance and firm value appreciation. Optimum capital structure policy does not only improve firm value but also enhance operation effectiveness and efficiency.
The aim of capital structure management is to combine the permanent source of fund by maximizing the stock price and minimizing cost of capital; further, it also puts the balance between risk and return (Keown, 2010). Optimum capital structure can maximize the stock price with low debt ratio and maximum Earning per Share (Brigham, 2011). Therefore, good or optimum capital structure should be able to minimize cost and put a balance between risk and return. It is supported by Husnan (2004: 263) as he mentioned that “a capital structure which is able to maximize the firm value or stock price is the best-fit capital structure.”
Several research on capital structure can be found. It was started by Modigliani & Miller (1958: 261-297) as they proved that a choice between debt and equity does not influence firm value. Next, research on capital structure results in three generic theories known as capital structure grand theory, namely: trade-off theory, pecking order hypothesis, and free-cash flow theory. Trade-off theory proposes that a firm will tend to balance or make a trade-off between tax utilization due to interest payment and bankruptcy cost. Meanwhile, pecking order theory states that a company during its funding activity follows the preference on funding resource alternatives with the lowest risk, such as retained earnings, debt, and right issue. Finally, free-cash flow theory emphasizes on the agency cost.
According to Brigham (2011:188), the variables which should be considered in observing optimum capital structure are sales stability, capital expenditure, operating leverage, growth rate, profitability, tax, control, management attitude, appraisal and creditor attitude, market condition, firm’s internal condition, and financial flexibility.
The empirical study on the determinants of capital structure has been conducted in prior research. A research from Titman & Wessels (1988: 1371-1375) used collateral asset value, non-debt tax shield, growth, uniqueness, industry classification, size of the firm, volatility, profitability, and leverage as the determinants of capital structure. Further, Rajan & Zingales (1995:1421-1460) utilized tangibility, investment opportunities, size of the firm, and profitability as the determinants of capital structure.
Empirical study conducted by Harris and Raviv (1991) concluded that debt will increase in line with fixed assets, non-debt tax shields, growth opportunities, and size of the firm; however, debt will reduce when volatility, advertising expenditures, research and development expenditures, bankruptcy probability, profitability, and uniqueness of product increase. Frank & Goyal (2009:47-55) confirmed that among leverage factors the role of each factor is the following median industry leverage (+), market to book ratio (-), collateral (+), profits (-), dividend paying (-), log of assets (+), and expected inflation (+).
Other than in developed countries, research on capital structure had been conducted in China by Chen (2004), Huang & Song (2006), and Zou & Xiou (2006) and in Asia Pacific by Deesomsak et.al. (2004). Research on capital structure and firm value in Indonesia has also been conducted by several researchers like Ratnawati (2001), Habibie (2012), Sudarma (2004), Savitri (2012), and Masidonda (2013).
Referring to Brigham’s (2011:188) statement and empirical study from former researchers, it concludes that there are several determinants of capital structure. However, there are some dominant and significant variables
that have a role on capital structure, such as: volatility of earning, profitability, firm size, capital expenditure, and firm growth. Besides, liquidity variable also influences capital structure though it is not yet commonly explored. Thus, liquidity aspect should be further examined to see the consistency with the prior research.
Based on prior research which observed the determinants of capital structure involving the six dominant variables that have been mentioned previously, the result is not yet consistent between one research and another research regarding with: (1) the direction of its relationship (coefficient), and (2) the factors which significantly influence optimum capital structure. The inconsistency provides a research which is interesting to be observed.
The occurrence of research gap encourages the author of this research to re-examine the role of liquidity, volatility of earning, firm size, capital expenditure, and firm growth on capital structure; further, it also attracts the researcher to re-examine the role of capital structure on firm value of manufacturing industry which are listed in Indonesia Stock Exchange (IDX).
Based on the financial statement of the manufacturing firms, it indicates that during the period between 2008 and 2011, the debt to equity ratio (DER) elevated in line with the improvement of Price to Book Value (firm value). However, those two indicators decreased in 2012. From the graphic, it concludes that during 2008 – 2011 period, the leverage ratio increased on some manufacturing firms followed by the appreciation of price to book value. Yet, there was a decrease on leverage in 2012 which resulted in the decrease on firm value (price to book value).
The phenomenon of the decrease on financial performance among manufacturing industry causes those manufacturing firms experience financial hindrance. As analyzed from financial management perspective, it concludes that those hindrances in 2012 were caused by the failure to achieve the target of firm’s optimum capital structure.
2. REVIEW OF LITERATURE AND HYPOTHESIS DEVELOPMENT
Capital structure definition based on J. Fred Weston & Thomas E. Copeland (1997) is the weighted average of the various types of capital that the firm uses which consists of long term debt, preferred stock, and common equity. Yet, Keown et.al. (2010) define capital structure as a mix of several long-term source of financing utilized by a firm.
The aim of capital structure according to Keown (2010) is to integrate permanent source of financing to maximize stock price of the firm and minimize cost of capital; further it is also intended to balance between risk and return (Keown, 2010). Meanwhile, according to Brigham (2011: 39), an optimum capital structure is able to maximize the company's stock price with a low debt ratio and maximum value of Earning per Share (EPS). It can be concluded that good or optimum capital structure is able to minimize the cost of capital as well as put a balance between risk and return. Optimum capital structure is influenced by several factors, including: liquidity, earnings volatility, profitability, firm size, capital expenditure, and firm growth.
Liquidity is the ability of the firm to meet its short-term liabilities. In practice, liquidity describes the ability of the company to be able to provide cash or liquid assets which is sufficient to meet the matured liabilities. Liquidity in this study is measured by the quick ratio or the ratio of current assets minus inventories divided by current assets.
Earnings volatility indicates the level of business risk faced by a company. Greater business risk results in higher profit expectation; on the contrary, lower business risk results in lower expected profit. A firm which experiences high business risk will face serious financial risk if the firm does not carefully manage its financing decision. Earnings volatility in this research is measured by using the standard deviation of EBIT (Earnings before Interest and Tax).
Profitability shows the company's ability to generate profit as the utilization of a number of the company's capital. The smaller the earning value of the capital expenditure results in smaller company's ability to cover the expenditure from internal financing which the required debt financing. Therefore, profitability of the company affects its capital structure. In addition, profitability is also often used as a representation in calculating the company's financial performance. Some researchers use profitability of the company as one of the important determinants which change the value of the company. Lower earnings causes lower declined value of the firm as perceived by the investors. Profitability in this research is measured by using EBIT (earnings before interest and tax) or operating profit before tax and interest divided by total assets
Firm size often becomes the indicator of collateral value. Bigger firm relatively has wider access of financing compared to smaller firm. Greater firm size tends to cause the firm to utilize more debt capacity which in turn becomes less optimum. Therefore, firm size influences firm’s financing. Firm size in this research is measured using total asset natural logarithm (LnAssets).
Capital expenditure influences firm’s capital structure. Capital expenditure for purchasing property, plant, and equipment usually requires large amount of cash. Thus, financing needs become crucial factor for a firm when there is a significant opportunity of business growth. Financing needs will be a serious problem if the firm only relies on internal source of funding or equity financing. Capital expenditure in this research is calculated from the
fixed asset divided by total sales.
Firm growth is the ability of the firm to retain its position in the relevant industry and in its overall economic activities (Weston, 1999). To retain or improve firm growth, it needs greater funding or debt. Firm growth in this research is measured by using asset growth divided by prior asset condition.
Capital structure indicates the relative position between debt and equity. The trade-off theory predicts a positive relationship between leverage ratio and firm value at particular level. However, a massive use of debt (not optimal debt financing) will ultimately result in the decrease of firm value. Capital structure in this research is measured by suing long-term debt divided by total equity.
Firm value is a measure which describes the investor’s perception on the firm success in managing its resources in the year of t+1. The formula to measure firm value in this research is risk on the depreciation/appreciation of the stock in t+1 year compared to book value per share at the end of t year.
Based on the description above, it comes to the following conceptual framework which describes the determinants of capital structure and firm value as presented in the Figure 1 below:
Figure 1
Research Conceptual Framework
First Model:
+
+
+
+
=
it it itit
liquid
Vol
ofit
CS
β
0β
1.
β
2.
β
3.
Pr
it itCapex
Size
5 4.
β
αβ
+
+
+
αβ
6.
Growth
it+
U
1
it Second Model: it itCS
VoF
∧+
=
γ
0γ
1.
+
µ
2it Description:CSit = Capital Structure on particular firm in particular year
Liquidit = Liquidity value of particular firm in particular year
Volit = Profit profitability of particular firm in particular year
Capexit = Capital expenditure particular firm in particular year
Profitit = Profitability of particular firm in particular year
Sizeit = Size of the particular firm in particular year
Growthit = Growth of particular firm in particular year
VoFit = Value of a particular firm in particular year
βn ; γn = Regression coefficient with a priori value as the following formula:
β1> 0, β2< 0, β3< 0, β4> 0, β5> 0, β6> 0
The direction of coefficient described in the pattern of the relationship among variables and supporting research can be observed in Table 1 below:
7 2 Growth Liquidity Volatility Profitability Firm Size Capital expenditure Capital Structure Firm Value 1 3 4 5 6 7
Table 1
Coefficient Direction and Supporting Research
NO Hypothesis Coefficient Supporting Research
1 The role of liquidity on capital structure
+ Hernowo (2010)
2 The role of volatility of earning
on capital structure
_ Harris & Raviv (1991), Pangeran (2003), Sudarma
(2004), Masturi (2001), and Um Taejong (2001)
3 The role of profitability on
capital structure
_ Deesomsak (2004), Delcoure (2006), Huang & Song
(2006) Djumahir (2005), and Sudarma (2004)
4 The role of firm size on capital
structure
+ Ratnawati (2001), Huang & Song (2006), Welch (2003),
Chen (2004), and Savitri (2012) 5 The role of capital expenditure
on capital structure
+ Masturi (2001), Chen (2004); Welch (2003)
6 The role of firm growth on
capital structure
+ Ratnawati (2001), Chen (2004)
7 The role of capital structure on
firm value
+ Djumahir (2004)
Research Hypothesis
H1: greater liquidity improves the proportion of debt financing in firm’s capital structure
H2: greater earnings volatility reduces the proportion of debt financing in firm’s capital structure. H3: greater profitability reduces the proportion of debt financing in firm’s capital structure. H4: bigger firm size improves the proportion of debt financing in firm’s capital structure
H5: greater capital expenditure increases the proportion of debt financing in firm’s capital structure H6: better firm growth increases the proportion of debt financing in firm’s capital structure H7: better capital structure improves firm value
3. RESEARCH METHOD 3.1. Type of Research
This research utilizes quantitative approach (positivistic). This is an explanatory research as it examines the causal relationship among variables through hypothesis testing. This research emphasizes on theory in building research conceptual framework and hypothesis; further, it examines the hypothesis using the collected data and quantitative analysis tools for conclusion drawing (deductive method).
3.2. Population and Sample of Research
The population of this research are manufacturing firms listed in Indonesia Stock Exchange (IDX). There are 45 manufacturing firms which meet the requirements as the research population. The overall population members are taken as the research sample.
3.3. Data Source and Data Collection Technique
Data source utilized in this research is secondary data. The secondary data is obtained through financial statement or publication report in Indonesia Stock Exchange (www.idx.co.id) and Indonesia Capital Market Directory (ICMD).
Data collection technique uses documentation. Observation is done through time series from 2008-2012 on 45 different firms (cross-sections) so that the data is a pooled data.
3.4. Data Analysis Method
The analysis method used in this research is panel data analysis (econometrics model). The analysis instrument used in this research is Eviews 6 since this tool fits to analyze panel data or a combination between cross-sections and time series data.
4. RESAERCH RESULT 4.1. Classic Assumption Test 4.1.1. Multicollinearity Test
Multicollinearity test aims to examine whether in the regression model happens a correlation between the independent variables. The test is done by observing the Varians Inflation Factor (VIF) value. Based on the SPSS test result of the first model, the VIF values of liquidity, volatility of earning, profitability, firm size, capital expenditure, and firm growth are lesser than 10 (<10). It indicates that there is no multicollinearity problem.
Table 5.2
Multicollinearity Test Result
Model Collinearity Statistics
Tolerance VIF 1 (Constant) X1 .857 1.167 X2 .705 1.418 X3 .509 1.965 X4 .722 1.385 X5 .473 2.113 X6 .959 1.043
For the second model, the SPSS test result also demonstrates that the VIF value is 1 (0.1 < VIF < 10); thus, it concludes that there is no multicollinearity problem.
4.1.2. Heteroskedasticity Test
Heteroskedasticity test aims to see varians heterogeneity. This test checks whether there is a similar varians from the residual of an observation to another observation or not. The test is done through scatterplot model. The SPSS output for both the first and second models shows that the dots distribution is random both above and below the 0 line of the Y-axis. It concludes that there is no heteroskedasticity problem in the regression model.
4.1.3. Auto-correlation Test
Good regression model must be free from correlation problem. One of the ways to detect the existing auto-correlation uses Durbin-Watson test. The test of Durbin-Watson to check whether there is an auto-auto-correlation problem in this model can be seen in the following table:
Table 3
Auto-correlation Test Result
Variable Coefficient Std. Error t-Statistic Prob.
C -11.68169 1.377615 -8.479645 0.0000 Liquidity (X1) 0.524806 0.068992 7.606738 0.0000 Volatility (X2) 0.051587 0.035130 1.468445 0.1438 Capital Expenditure (X3) 0.589724 0.076395 7.719440 0.0000 Profitability (X4) -2.026886 0.843848 -2.401955 0.0174 Firm Size (X5) 0.163779 0.059868 2.735682 0.0069 Growth (X5) 0.107519 0.122539 0.877426 0.3815 R-squared 0.809869 Durbin-Watson stat 1.687124 Prob(F-statistic) 0.000000
Auto-correlation test using Durbin-Watson method for the first model attains DW score of 1.687. According to Algifari (2000) if the DW score is 1.66 < DW < 2.34, it implies that there is no auto-correlation problem. Thus, the first model does not experience auto-correlation problem. Also, the auto-correlation test using Durbin-Watson for the second model attains a DW score of 1.70 (which is at the range of 1.66<DW<2.34) so that there is no auto-correlation problem in this research.
4.2. Estimation Method
To determine the panel method that is used in this research, it utilizes Chow test and Hausman Test. The both method can be used to determine whether a panel model can be regressed by using Pooled Least Square, Fixed Effect, or Random Effect method. Chow test aims to determine whether a panel data can be analyzed either by using Pooled Least Square or Fixed Effect. If the result shows that the proper model is Pooled Least Square, it needs further analyzing by utilizing Hausman Test. However, if the result shows that the proper model is Fixed Effect, the further test which uses Hausman Test aims to verify whether the most proper method is either still Fixed Effect or Random Effect.
Based on the Chow test, the Fvalue and pvalue are listed below:
Fvalue pvalue
- Model I 8.8297 0.0000
The Chow test result for first model indicates that Fvalue is greater than Ftable (8.8297 > 2.31). Besides, the
second model also demonstrates the same result as the Fvalue is greater than Ftable (7.01>2.31). Therefore, the proper
estimation method is Fixed Effect.
Next, based on the Hausman Test result on the first model, the chi-square value is 75.96 (which is greater than 1.635). Also, the second model’s chi-square is 6.6445 which is greater than 0.004. Thus, the estimation method that suits the model is Fixed Effect method.
4.3. Data Panel Regression Analysis
Based on the test using Eviews in Fixed Effect method, the multiple regression result for the first model is presented below:
Table 4
Multiple Regression of the First Model
Variable Coefficient Std. Error t-Statistic Prob.
C -11.68169 1.377615 -8.479645 0.0000 Liquidity (X1) 0.524806 0.068992 7.606738 0.0000 Volatility (X2) 0.051587 0.035130 1.468445 0.1438 Capital Expenditure (X3) 0.589724 0.076395 7.719440 0.0000 Profitability (X4) -2.026886 0.843848 -2.401955 0.0174 Firm Size (X5) 0.163779 0.059868 2.735682 0.0069 Growth (X6) 0.107519 0.122539 0.877426 0.3815
Fixed Effects (Cross)
R-squared 0.809869
Durbin-Watson stat 1.687124
Prob(F-statistic) 0.000000
Based on the Table 4 above, it shows that α0= -11.68169, β1= 0.524806, β2= 0.051587, β3= 0.589724, β4=
-2.026886, β5= 0.163779, β6= 0.107519 so that the regression equation is:
Y= -11.68169 + 0.524806 X1 + 0.051587 X2 + 0.589724 X3-2.026886X4 + 0.163779X5 + 0.107519X6+ ε1 Based on the multiple regression analysis result for the first model, it reveals that volatility of earning variable is not consistent. The comparison of coefficient direction is presented in the following table:
Table 5
Comparison on Coefficient Direction of the Variable
No Variable Prediction Finding Note
1 Liquidity (X1) + + Consistent
2 Volatility (X2) - + Not Consistent
3 Capital Expenditure (X3) + + Consistent
4 Profitability (X4) - - Consistent
5 Firm Size (X5) + + Consistent
6 Growth (X6) + + Consistent
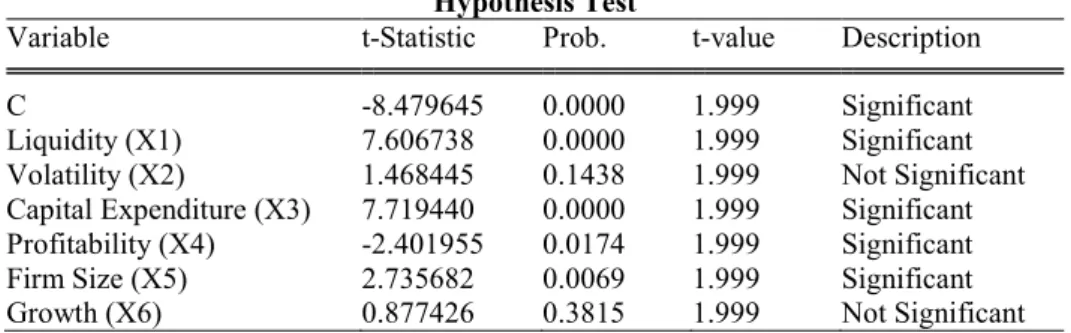
Based on the hypotheses test of those six variables, there are two variables which are not significant. The two variables which are not significant are volatility of earning and firm growth. It implies that volatility of earning and firm growth do not influence optimum capital structure since the tvalue is lesser than its ttable.
Table 6 Hypothesis Test
Variable t-Statistic Prob. t-value Description
C -8.479645 0.0000 1.999 Significant
Liquidity (X1) 7.606738 0.0000 1.999 Significant
Volatility (X2) 1.468445 0.1438 1.999 Not Significant
Capital Expenditure (X3) 7.719440 0.0000 1.999 Significant
Profitability (X4) -2.401955 0.0174 1.999 Significant
Firm Size (X5) 2.735682 0.0069 1.999 Significant
Growth (X6) 0.877426 0.3815 1.999 Not Significant
Next, the test result using Eview in Fixed Effect method for the second model is presented in the multiple regression analysis result below:
Table 7
Multiple Regression for the Second Model
Variable Coefficient Std. Error t-Statistic Prob.
C 6.817289 0.068268 99.86107 0.0000
Capital Structure (Y) 0.259486 0.062299 4.165145 0.0000
R-squared 0.702227
Durbin-Watson stat 1.700349
Prob(F-statistic) 0.000000
As we see in Table 5, α0= 6.817289, β1= 0.259486, so that the regression equation is:
Z = 6.817289+ 0.259486Y+ ε1
Based on the hypothesis testing, the coefficient direction based on the prediction is similar with the empirical data processing of the research variables; thus, the result is consistent with the theory proposed by some former researchers as they said that capital structure positively influences firm value.
4.4. Determination Coefficient Analysis
This analysis is used to reveal the contribution of the independent variables consisting of liquidity, volatility, capital expenditure, profitability, firm size, and firm growth on the dependent variable, namely capital structure.
The determination coefficient of the first model is calculated form the square score of coefficient value which is multiplied by 100%. Based on the Eviews 6’s result, the determination coefficient is 0.809869 or 80.98%. It demonstrates the contribution of liquidity, volatility, capital expenditure, profitability, firm size, and firm growth on capital structure as much as 80.89%; whereas, the rest 19.02% is influenced by other variables which are not explained in this research model.
The determination coefficient of the second model is 0.702227 (70.22%). This score indicates the contribution of capital structure on firm value as much as 70.22% while the rest 29.78% is influenced by other variables which are not described in this research model.
5. RESEARCH RESULT DISCUSSION
5.1. The Role of Liquidity on Firm’s Capital Structure
The result of this research shows that greater productivity will result in higher proportion of leverage in a firm’s capital structure. This finding is consistent with the hypothesis which proposes that liquidity positively influences firm’s capital structure.
Statistically, this variable is significant at the 5% of alpha (7.6067) with positive relationship. It implies that an improvement on liquidity level will increase the level of leverage use. The relationship between liquidity and leverage is positive due to the limited amount of available cash to meet its liabilities. Liquidity ratio improvement is linear with the amount of investment as indicated by the ratio of property, plant, and equipment (PPE) as well as research and development expenses. Greater liquidity of a firm will arise more trust of the vendors or suppliers and creditors. Thus, there is a linear correlation between liquidity level and firm’s capital structure.
The result of this research is consistent with prior research’s finding from Hernowo (2010) Sutedja & Manihuruk (2009) as they found that there is a different type of relationship between liquidity and leverage ratio of the manufacturing firms in Indonesia: liquidity positively influences debt to equity ratio. This finding is different from other empirical studies by Sheikh & Wang (2011:117-133), Deesomsak et.al. (2004), Mazur (2007), and Viviani (2008) as those researchers mentioned that liquidity negatively influences debt to equity ratio.
5.2. The Role of Earnings Volatility on Firm’s Capital Structure
The research result demonstrates that earnings volatility positively influences capital structure but not significant. The finding of this research is not consistent with its hypothesis which predicts that earnings volatility will negatively influence firm’s capital structure. The positive coefficient of this variable statistically implies that greater existing business risk of a firm will cause the firm to use greater amount of leverage use in its capital structure.
Further, this research finding is consistent with Huang & Song (2006) as they proved that there is a positive relationship between financial risk and capital structure. Yet, this finding is different from the empirical study by Harris & Raviv (1991: 297-355) as they stated that financial risk has significant but negative role on capital structure.
The result of this research is also in line with some prior studies by Pangeran (2003:27-46), Sudarman (2004:78-89), Masturi (2001, 45-48), and Um Taejong (2001: 221-245) which confirmed that there is no
significant relationship between earnings volatility and capital structure.
The interpretation of the finding provides an insight that a manufacturing firm with high debt to equity ratio tends to make a high risk investment. Besides, the non-significant role of earnings volatility and capital structure among the manufacturing firms during the observation period occurs due to the global economic crisis and The U.S.’ economic crisis. At that time, most of the firms needed more cash and financing as the consequence of economic crisis which hindered those firms to finance their business from retained earnings. Those firms were looking for leverage even the business risk was greater.
5.3. The Role of Profitability on Firm’s Capital Structure
The result of this research shows that profitability negatively and significantly influences firm’s capital structure. The finding supports the hypothesis which predicts that greater profitability is able to reduce the proportion of leverage use in a firm’s capital structure.
In this research, profitability is statistically significant at the alpha of 5% (-2.4019). It means that the proposed hypothesis which states that profitability negatively influences capital structure is accepted. This finding supports the agency theory as stated by Jensen & Meckling (1976:305-360). Further, this research also shows that greater profitability increases earnings. The availability of internal funding makes the firm tend to reduce debt financing.
The negative but significant relationship between profitability and leverage among the manufacturing firms in Indonesia is relevant with Pecking Order Theory (Myers, 1984). Myers (1984) stated that financing decision of a firm is based on the use of retained earnings as the first priority, debt or leverage as the second priority, and new stock offering (right issue) as the third priority. A firm prefers internal financing from the retained earnings since this source is the quickest source of fund; moreover, retained earnings is easier than other alternatives and does not result in transaction-cost like leverage or right issue.
This research supports several studies form Chen (2000), Deesomsak et al (2004), Delcoure (2006), Huang (2006), Zou Xiou (2006), Sudarma (2004:78-89), and Savitri (2012). Those researchers stated that a firm prefers internal financing than external financing. This conclusion explains the phenomenon of why those profitable big companies tend to be more conservative in using debt for their operating costs. Meanwhile, for less profitable firms, they tend to use internal financing first and then utilize debt or leverage. Generally, a firm is not quite interested in making a financing decision by issuing new stock (right issue). It is due to an asymmetric information between manager and the investors when a new stock offering by the investors is perceived negatively by the manager.
Based on Deesomsak (2004), the negative role of profitability on debt or leverage in Malaysia’s capital structure is consistent with the proxy of pecking order theory which indicates that a firm prefers internal funding when the profitability of the firm is high.
High profitability of a firm will influence the level of dependency on external party in fulfilling financing needs for investment project. Therefore, when a firm has a high profitability, the firm tends to improve its retained earnings. This choice is one of the mechanisms that can be taken by the management when there debt agency conflict is greater than equity agency conflict.
5.4. The Role of Firm Size on Firm’s Capital Structure
Based on the regression analysis, firm size significantly affects firm’s capital structure at the alpha of 1% (2.7356). This finding is consistent with the proposed hypothesis which states that firm size positively influences capital structure. This findings supports an argumentation which says that bigger firm has better financial access in capital market; further bigger firm is also easier and quicker to attain capital so that the firm has greater chance to achieve more debt compared to smaller firm.
The result of this research demonstrates that a bigger firm tends to have greater amount of asset which then encourages the firm to attain more debt or leverage since the greater amount of assets is in line with its capability to provide collateral. When the collateral is greater, the capacity of the firm to make a financing decision through debt will be greater as well.
Greater firm size commonly makes more transparency in revealing the performance of the firm to the third party. More transparency results in easier access to attain debt or leverage as the firm achieves greater trust from the creditor. Thus, bigger firm size results in bigger chance to achieve source of financing through debt or leverage.
This research is consistent with Deesomsak et.al (2004), Delcoure (2006), Huang (2006), Titman (1998) and Savitri (2012) as they stated that bigger firm size will have greater capacity to use debt or leverage compared to smaller firm size.
5.5. The Role of Capital Expenditure on Firm’s Capital Structure
Capital expenditure variable is statistically significant at the alpha of 5% (7.7194). It implies that the proposed hypothesis which states that capital expenditure positively influences capital structure is accepted. This finding is consistent with Karsana & Surpiyadi’s (2003) research as they stated that investment opportunity affects leverage policy of the firms listed in Indonesia Stock Exchange.
The finding of this research reflects that when there is an increase on the firm’s business as indicated by greater capital expenditure in the form of fixed asset, the firm will tend to choose financing decision through debt or leverage. Internal capital is the lowest priority that can be taken by a firm in its financing decision. Commonly, when a firm needs financing source through debt or leverage, it will bring greater benefit to the first owner since the debt financing decision does not reduce earnings distribution that the owner takes when the firm is able to generate profits. The firm will only pay the interest and principal; yet, if the firm is failed to achieve its goal or when the expansion effort does not match with the initial objective, management can distribute the risk with its creditor. It is different when the firm meets its financing needs through equity financing like right issue which causes lower earnings per share.
5.6. The Role Firm Growth on Firm’s Capital Structure
The result of this research demonstrates that firm growth does not have significant role on the proportion of leverage use in the capital structure of a firm. This finding does not support the proposed hypothesis which predicts that better growth is able to improve the proportion of leverage use in a firm’s capital structure.
Firm growth reflects firm’s productivity and hope that is expected by both the external and internal parties of the firm. Brigham & Houston (2011) stated that if in ceteris paribus condition, a rapid growing firm tends to rely on external funding since the cost of right issue is more expensive compared to bond or obligation offerings. Therefore, a rapid growing firm tends to meet its financing needs through debt or leverage.
Commonly, when a firm grows, it requires more financing through debt. Debt financing will bring more advantages for the first owner since debt financing does not reduce earnings distribution when the firm attains greater profit. The firm will only pay the interest and principals. Yet, if the firm is failed to achieve its goal or when the expansion effort does not match with the initial objective, management can distribute the risk with its creditor. It is different when the firm meets its financing needs through equity financing like right issue which causes lower earnings per share. It is relevant with Signaling Model Theory which states that a firm with a better profitability and growth opportunity tends to use greater amount of debt.
This research demonstrates that growth does not influence the firm’s capital structure decision for manufacturing firms in Indonesia during the observation period in 2008 – 2012. It happens since during that period most of the firms in Indonesia still had idle capacity. Idle capacity can be utilized if there is a greater amount of working capital which does not affect significantly on the firm’s capital structure. Besides, most of the firms in Indonesia during the observation period suffered from economic crisis rooted from The U.S’ crisis and global crisis. The crisis caused those firms to use debt since the internal source of financing could not meet the needs. This research is consistent with Delcoure’ (2006) which stated that growth does not significantly influence capital structure.
5.7. The Role of Capital Structure on Firm Value
The result shows that capital structure positively and significantly influences firm value. This result is relevant with the hypothesis which predicted that capital structure positively influences firm value.
The regression analysis demonstrates that capital structure is statistically significant at the alpha of 5% (4.1651). Thus, the hypothesis which mentions that capital structure positively influences firm value is accepted. It indicates that better capital structure results in greater firm value. Further, it also implies that greater proportion of leverage use in a firm’s capital structure is able to improve firm value. It happens due to the leverage condition of the observed manufacturing firms does not yet achieve its optimum level; thus, greater proportion of leverage in manufacturing firms can improve the firm value. This finding is relevant with trade-off theory which says that there is a positive relationship between the level of debt and firm value. The result of this research is consistent with empirical studies conducted by Pangeran (2003:27-46), Wahyudi & Pawestri (2006: 41-48), Djumahir (2004), Djumahir (2006:24-34), and Sudarma (2004:78-89) as those researchers stated that financing decision of a firm positively influences firm value.
6. RESEARCH IMPLICATION
From the data analysis result, there are some of important matters related to the research implication on the unit analysis observed in this consisting of the manufacturing firms during five years period from 2008-2012: 6.1. Theoretical Implication
Theoretically, the finding of this research supports the relevant theories in capital structure related to the firm value of manufacturing sector in Indonesia capital market. The finding is in line with capital structure theory of
Modigliani and Miller (1963) stating that debt has a role to improve firm value. This research also support trade-off theory of capital structure which says that the use of leverage at certain level can improve the value of the firm. Further, the finding of this research is also relevant with pecking order theory (Myers, 1984) which mentions that a firm prioritizes to use internal source of financing than external source of financing (debt and stock issue). It is confirmed by the research result on manufacturing sector in Indonesia which demonstrates the positive and significant role of profitability on firm’s capital structure.
6.2. Practical Implication
Practically, the result of this research can be an insight in decision making for investors or leader of an organization in manufacturing sector to observe the role of capital structure’s determinants on capital structure itself and firm value.
Based on capital structure model proposed in this research, not all of the variables are significant; further, the directions of the coefficient are not all positive between the independent variables and its dependent variable like what has been predicted previously. For instance, volatility is predicted to have negative coefficient but it shows positive and not significant. Next, growth is predicted to have significant role on capital structure; meanwhile, the result is on the contrary even the coefficient is positive as what has been hypothesized.
From the statistical result, liquidity, capital expenditure, profitability, and growth are significant to be considered in making a financing decision, particularly for capital structure decision in manufacturing industry as the unit analysis of this research. Also, an optimum capital structure formulation should be considered to enhance the value of a firm in manufacturing industry.
Earnings volatility positively influences capital structure, but no significant. It indicates that in Indonesia manufacturing industry, there is a trend which shows that greater earnings volatility results in greater amount of leverage for financing the firm. Firm growth is also not an important information to determine leverage decision on the manufacturing industry in Indonesia during the observation period.
7. CONCLUSION AND SUGGESTION 7.1. Conclusion
a. This research has found a capital structure model which shows the relationship between liquidity, profitability, firm size, and capital expenditure on the capital structure of manufacturing firms in Indonesia which are listed in Indonesia Stock Exchange with the following description:
(i) Better liquidity improves the proportion of the leverage use in a firm’s capital structure. This finding shows that greater liquidity level encourages better trust of the vendor/supplier and creditor. Therefore, there is a linear correlation between liquidity and the proportion of leverage use in a firm’s capital structure.
(ii) Earnings volatility does not bring significant role on the proportion of leverage use in a firm’s capital structure since manufacturing firm with a high leverage tend to invest on high risk investment. Besides, manufacturing firms during the observation period suffer from economic crisis rooted from The U.S’ crisis and global crisis so that those firms still need financing from leverage since they cannot make a financing decision from retained earnings. It makes those firms search for a debt though there is a greater business risk.
(iii)Greater profitability reduces the proportion of leverage use in a firm’s capital structure. This findings proves that greater amount of profit in manufacturing firm results in lower dependency on financing from debt or leverage.
(iv)Bigger firm size results in greater proportion of leverage use in a firm’s capital structure. This finding supports an argumentation which states that big company has better accessibility on capital market and easier to find a source of funding. A bigger firm has more chances to attain greater amount of debt or leverage compared to smaller business.
(v) Greater capital expenditure increases the proportion of leverage use in a firm’s capital structure. This finding indicates that when there is an effort of the firm to improve the capital expenditure in the form of fixed asset, the firm tends to fulfill the financing needs through debt or leverage.
(vi)Firm growth does not have any significant role on the use of leverage in a firm’s capital structure during the observation period in the year of 2008 – 2012. It happens due to most of the firms have idle capacity so that those firms need more working capital but not adding debt or leverage proportion their capital structure significantly.
b. This research proves that capital structure decision can improve the value of the manufacturing firms listed in Indonesia Stock Exchange. This finding indicates that the debt or leverage condition of a manufacturing firm is not yet optimum so that greater proportion of leverage is able to improve firm value among those manufacturing firms in Indonesia.
7.2. Suggestion
Based on the analysis result, there are some suggestions proposed to the practical side and further study on capital structure and firm value.
7.2.1. Practical Implication
Based on the finding, the researcher suggests the following matters for practical implementation: 1. A firm may enhance its liquidity through debt financing and non-productive asset selling. 2. A firm may enhance its liquidity by making an efficiency in every aspect of firm
3. A firm may take an effort to improve the firm size by adding more productive asset and through good corporate governance
4. A firm may optimize the use of the main fixed asset (property, plant, equipment) to encourage greater sales rate.
5. Management can implement good corporate governance on firm’s debt through:
(a) Avoiding mismatch in investment financing to retain firm’s liquidity
(b) Searching for other alternatives of financing which has lower cost and risk like: (i) the use of retained earnings, (ii) the use of reserve-fund from the shareholders or strategic partners, (iii) looking for new partner, and /or (iv) inviting joint-venture capital
7.2.2. Suggestion for Further Research
A research is not able to accommodate every problems that occur. Commonly, a conceptual framework is arranged to simplify the problems for revealing the relationship among variables of the research in deeper way. However, it results in lack of the number of variables that can be involved in a research. Such limitation provides suggestion for further research to refine the former research. Some of the limitations and suggestion for further research are presented below:
a. This research is limited only for manufacturing industry so that it cannot be generalized for other type of industry; thus, further research may observe sectors other than manufacturing industry.
b. The series of observation time is relatively short since it takes only five years period. This drawback makes this research cannot describe the true fact; thus, further research is expected to add the length of the observation time.
c. This research only uses long-term debt to calculate firm’s capital structure; however, there are some firms who make a roll-over of its short-term debt annually so that those short-term debt should be considered as the component of capital structure. For further research, it should consider the sum of debt in calculating capital structure.
d. This research only involves financial variables as the determinants of capital stricter. Further research may also involves both financial and non-financial variables which may have a role on capital structure, like: tax, non-debt tax shield, asset structure, and ownership structure. In addition, further research should consider the variables which may influence firm value rooted from external matters such as exchange rate, inflation, and interest rate.
REFERENCES
Algifari. 2002. Analisis Regresi, Edisi Kedua, Yogyakarta:BPFE
Antoniou, Antonios, Yilmaz Guney, Krishna Paudyal. 2002. Determinants of Corporate Capital Structure :
Evidence From European Countries, Center for Empirical Research in Finance, Departemen of
Economics and Finance, University of Durham, Version 1.2, March, 2002.
Brealey, Richard A., Alan J. Marcus, and Stewart C. Myers. 2006. Fundamentals of Corporate Finance, 7th ed., Cases in Finance.
Brigham E. F dan Houston J.F. 2011. Dasar-Dasar Manajemen Keuangan, Buku 2, Edisi 11, terjemahan, Salemba
Empat.
Chatoth, Prakash K. 2002. Co-alignment Between Envirorment Risk, Corporate Strategy, Capital Structure, and
Firm Performance : An Empirical Investigation of Restaurant Firms, Dissertation to the Faculty of the Virginia Polytechnic Institute and State University.
Chen, Jean J. 2004. Determinants of capital structure of Chinese-listed companies, Journal of Business Research
57 (p. 1341-351), Elsevier
Cho, M.H. 1998. Ownership Structure, Investment and the corporate value: An empirical Analysis, Journal of
Financial Economics Vol 47. Hal. 103-121.
Damodaran, A. 2001. Corporate Finance: Theory and Practice, 2nd edition, John Wiley: USA. 235-255. Deesomsak, Rataporn, Krishna Paudyal and Gioia Prescetto. 2004. The Determinants of Capital Structure:
Evidence from the Asia Pacific Region, Journal of Multinational Finance Management, 14.
Delcoure, Natalya. 2006. The Determinants of Capital Structure in Transitional Economies, International Review of Economic and Finance, Article in Press.
Perusahaan, Disertasi Program Pascasarjana Universitas Brawijaya, Malang.
Fama E.F. and Kenneth French R. 1998. Tax Financing decision and firm value, The Journal of Finance. Vol. LIII. No.3 June. pp: 819-843.
Frank, Murray Z., and Vidham K. Goyal. 2009. Capital Structure Decisions: Which Factors are Reliably
Important, Financial Management 38, 1-37. http:/www3.interscience.wiley.com/journal/
122368692/issue.
Gujarati, Damodar N. 2003, Basic Econometrics, 4th Ed. New York: McGraw-Hill Book Company, Inc.,
Ghozali, Imam. 2001. Aplikasi Analisis Multivariate Dengan Program SPSS, Edisi Kedua, Badan Penerbit Universitas Diponegoro, Semarang.
Habibie, Bangun Figur. 2012. Analisis Pengaruh Profitabilitas, Ukuran Perusahaan, Struktur Aktiva dan
Kesempatan Berinvestasi Terhadap Strutur Modal, Tesis Program Magister Manajemen Pascasarjana
Fakultas Ekonomi dan Bisnis Universitas Brawijaya, tidak dipublikasikan.
Harris, Milton dan Artur Raviv. 1991. The Theory of Capiatal Structure, Journal of Finance, Vol. XLVI, No. 1, 297-355.
Hernowo, Budi. 2010. Pengaruh Determinan Struktur Modal Terhadap Leverage Dan Implikasinya Pada Potensi
Kebangkrutan Perusahaan Manufaktur Studi Kasus Di Bursa Effek Indonesia.
Himmelberg, C.P. Hubbard, R.G. Palia, D. 1997. Ownership structure and corporate performance, Columbia
University, Graduate School of Business, Paine Webber, New York, NY 10027 U.S.A, pp:.110-127.
Huang, Samuel G.H and Frank M. Song. 2006. The determinants of capital structure, paper at the conference on
China and World 21st Century held at the University o Hong Kong.
Husnan, Suad dan Pujiastuti E. 2004. Manajemen Keuangan, Edisi 1, Yogyakarta, UPP AMP YKPN. 37-45.
Indahwati. 2003. Analisis Pengaruh Leverage dan Kebijakan Struktur Modal Terhadap Kinerja Keuangan dan
Nilai Perusahaan-Perusahaan Go Public di Pasar Modal Indonesia Selama Masa Krisis 1998 – 2001.
Pp : 76-82.
Itturiaga, Felis J. Lopez dan Juan Antonio Rodrigez-Sanz. 2001. Ownership Structure, Corporate Value and Firm Investment A Simultaneous Equations Analysis of Spanish Companies, Journal of Management &
Governance; 2001;5,2;pg 179-204.
Jensen, G. R, Donald, P. Solberg, and Thomas S. Zorn. 1992. Simultaneous Determination of Insider Ownership, Debt and Dividend Policies, Journal of Financial and Quantitative Analysis, 27, 247 – 263.
Kakani Rarm Kumar., Biswatosh Saha & V.N. Reddy. 2001. Determinant of Financial Performance of Indian
Corporate Sector in the Post-Liberalization Era: An Exploratory Study. NSE Research Initative Papers
No. 5 pp: 17-20.
Karsana, Y. W., dan Supriyadi. 2004. Analisis Moderasi Set Kesempatan Investasi Terhadap Hubungan Antara
Kebijakan Dividen dan Aliran Kas Bebas dengan Tingkat Leverage Perusahaan, Jurnal Ekonomi
danBisnis, Vol. XI No.2, pp. 234-253
Keown AJ, Scott DV, Martin DJ, dan Petty JW. 2010. Foundation of Finance, United States of America, Eleventh Edition, Prentice Hall International Inc.
Korajczyk, R.A., Levy Amnon. 2003. Capital structure choice: Macroeconomic conditions and financial constraints, Journal Of Financial Economics 68. 75-109.
Masidonda, Jaelani La. 2013. Determinan Struktur Modal dan Dampak Struktur Modal Terhadap Nilai
Perusahaan, Disertasi Program Doktor Ilmu Manajemen Pascasarjana Fakultas Ekonomi dan Bisnis
Universitas Brawijaya, tidak dipublikasikan.
Masturi, Hamidi. 2001. Internal Cash Flow, Insider Ownership, Investment opportunity dan Capital Expenditures:
Suatu Pengujian Terhadap Hipotesis Pecking Order dan Manajerial, Tesis Program pascasarjana UGM,
tidak dipublikasikan, pp 45-48.
Mazur, Kinga. 2007. The Determinants of Capital Structure Choice : Evidence from Polish Company,
International Atlantic Economic Society.
Miller, M., and K. Rock. 1985. Dividend Policy Under Asymmetric Information, Journal of Finance 40:
1031-1052.
Modigliani, Franco and Merton H. Miller. 1958. The Cost of Capital, Corporate Finance and The Theory of
Investment, American Economic Review, 48:261-275
Modigliani, Franco and Merton H. Miller. 1963. Corporate Income Taxes and The Cost of Capital : A Correction,
American Economic Review.
Myers, S.C. 1984. The Capital Structure Puzzle, The Journal of Finance, 39, 3, 575- 590.
Parlak, Deniz. 2010. Determinants of Capital Structure Policies of Turkish Manufacturing Firms, The Business Review, 14(2).p.147-153.
Perminas Pangeran. 2003. Pemilihan Antara Penawaran Sekuritas Ekuitas dan Hutang: Suatu Pengujian Empiris
Terhadap Pecking Order Theory dan Balancing Theory, Manajemen Usahawan Indonesia No.04 Th
Rajan, Raghuram G., and Luigi Zingales. 1995. What Do We Know About Capital Structure? Some Evidence From International Data, Journal of Finance, Vol. L, No. 5, 1421-1460.
Ratnawati. 2001. Analisis Perbedaan Struktur Modal dan Faktor intern, Faktor Ekstern Perusahaan Industri PMA dan Perusahaan Industri PMDN di Bursa Efek Jakarta, Disertasi, Pascasarjana Fakultas Ekonomi Universitas Airlangga.
Ruslim, Herman. 2009. Pengujian Struktur Modal (Teori Pecking Order) : Analisis Empiris Terhadap Saham di
LQ-45, Jurnal Bisnis dan Akuntansi, Vol 11, No. 3, hlm 209-221
Santoso, Singgih. 2000, Buku Latihan SPSS Statistik Parametrik, PT Elex Media Komputindo, Jakarta.
Savitri, Enni. 2012. Variabel Anteseden Dari Struktur Modal : Dampaknya Terhadap Nilai Perusahaan, Disertasi
Program Doktor Ilmu Manajemen Pascasarjana Fakultas Ekonomi dan Bisnis Universitas Brawijaya,
tidak dipublikasikan.
Sheikh, Nadeem Ahmed and Zonjung Wang. 2011. Determinants of Capital Structure, An Empirical Study of
Firms in Manufacturing Industry of Pakistan, Managerial Finance, Vol. 37 No. 2, pp.117-133.
Sudarma, Made. 2004. Analisis Struktur Kepemilikan Saham, Faktor Intern dan Ekstern Terhadap Struktur Modal
dan Nilai Perusahaan (Studi empiris pada perusahaan yang go public di Bursa Effek Jakarta), Disertasi
Pada Program Pascasarjana Program Doktoral, Universitas Brawijaya Malang, tidak dipubliksikan,
78-89.
Sugihem dan Syafruddin Ginting. 2003. Pengaruh Struktur Modal Terhadap Produktivitas Aktiva dan Kinerja
Keuangan serta Nilai Perusahaan Industri Manufaktur Terbuka di Indonesia, Disertasi Program
Pascasarjana Universitas Airlangga, Surabaya.
Sutedja, Jaja dan Wiston Manihuruk. 2009. Pengaruh Sutruktur Modal, Kepemilikan, dan Faktor Eksternal pada
Penentuan Nilai Perusahaan, Trikonomika, Vol. 8 No. 2, hal 78-89.
Titman S, and Wessels R. 1988, The Determinants of Capital Structure Choice, The Journal of Finance, Vol, XLIII, No.1
Um Taejong. 2001. Determination of Capital Structure and prediction of Bankcruptchy in Korea, Faculty of The Graduate School of Cornell University. Pp: 221-245.
Varaiya Nikhil, Kerin A. Roger and Weeks David. 1987. The Relationship Between Growth, Profitability and Firm Value, Strategic Management Journal, Vol. 8. 487-497.
Viviani, Jean Laurent. 2008. Capital Structure Determinants : an Empirical Study of French Company in Wine
Industry, International Wine Journal of Wine Business Research, Vol. 20, Iss : 2, pp. 171-194.
Wahyudi, Untung dan Hartini P. Pawestri. 2006. Implikasi Struktur Kepemilikan Terhadap Nilai Perusahaan
Dengan Keputusan Keuangan Sebagai Variabel Inetrving. Simposium Nasional Akuntansi IX, Padang
Wibowo, Budi. 2006. Pengaruh Struktur Kepemilikan Terhadap Kinerja Perusahaan: Kasus Indonesia,
Manajemen Usahawan Indonesia No. 05 th XXXV pp: 13-21.
Welch, I. 2004. Capital Structure and Stock Returns, Journal of Political Economy, 112, 1, 106-131.
Weston, J Fred, dan Brigham, F. Eugene. 1999. Essential of Management Finance (Dasar-Dasar Manajemen Keuangan), Edisi Ketujuh, Jilid Dua, Penerbit Erlangga, Jakarta.
Weston, Fred J. and Copeland E. Thomas. 1997. Managerial Finance (Manajemen Keuangan), Edisi Sembilan,
terjemahan, Penerbit Binapura Aksara, Jakarta.
Zou, Hong and Jason Zezhong Xiaou. 2006. The Financing Behaviour of Listed Chinese Firm, The British