MySuper Vs. KiwiSaver:
Retirement Saving For The Less Engaged
Australia’s MySuper default superannuation funds are compared against New Zealand’s
range of KiwiSaver funds. Some key points of contrast include: the relative maturity and
larger balances of the Australian system; the majority of MySuper providers are not-for-profit,
whereas KiwiSaver is dominated by for-profit providers; MySuper funds use a much broader
range of assets, while KiwiSaver funds invest largely in listed assets; greater use of lifecycle
strategies in Australia; the skew to conservative funds under KiwiSaver; and differing fee
structures, the impact of which depends on account balance. It is argued that New Zealand
could do more to enhance the probability of achieving adequate incomes in retirement.
Keywords: Superannuation; MySuper; KiwiSaver; Regulation; Portfolio construction; Fees
By Geoffrey J. Warren
Geoffrey J. Warren is Research Director, Centre for International Finance and Regulation, Sydney, Australia
1. Introduction
This paper compares and contrasts Australia’s MySuper default superannuation funds with New Zealand’s range of KiwiSaver funds. Some observations are also offered on the retirement savings systems of the two countries. The MySuper and KiwiSaver regulatory schemes were constructed with disengaged members in mind. MySuper was recently introduced with the intention of providing default superannuation members with a relatively straightforward and hopefully cheap product. KiwiSaver commenced in 2007 with the aim of drawing more New Zealanders into the retirement savings system. Both sit within superannuation systems offering a broader range of options that may be utilized by more engaged investors. This paper details the key elements of both schemes, and highlights where they differ. Some of the more notable differences include the following:
• Maturity and scale - KiwiSaver and the New Zealand superannuation system in general is the far less mature than the Australian system, with considerably smaller balances and much lower scale.
• Providers – The vast majority of MySuper providers are not-for-profit, and are permitted to offer only one MySuper product. KiwiSaver fund providers are for-profit organizations who may offer multiple products.
• Products – Two notable features of the KiwiSaver product range is a skew towards conservative funds, and a concentration in listed assets. The majority of MySuper products tend to be growth-focused, with many making use of a much wider range of asset classes including some meaningful weights in alternative assets. In addition, a solid cohort of MySuper lifecycle products is available. By comparison, KiwiSaver members are either less likely to generate adequate returns over the long-run due to being in a conservative strategy; or alternatively may face a bumpier ride as a consequence of being less diversified and highly exposed to equity market risk. • Fees – The typical KiwiSaver product is structured to
charge higher percentage fees and lower dollar value fees, relative to MySuper products. The KiwiSaver fee structure is better for members with small balances. Nevertheless, KiwiSaver members pay more at the
MySuper Vs. KiwiSaver:
Retirement Saving For The Less Engaged
• Agenda and debate – The prime focus in Australia has been around balances and/or adequacy of income in retirement, although attention is now shifting to the retirement phase. Often New Zealand commentators seem more concerned with member activity and the macroeconomic and budgetary effects of KiwiSaver. Adequacy is a major challenge, which the New Zealand system might be better configured to address.
The commentary and analysis on MySuper in this paper is largely drawn from work performed by the author in conjunction with other researchers, as appearing in Chant et al. (2014) and Butt et al. 2014.1 Particular use is made of data from Chant West, an independent superannuation
research and consultancy firm that conducts research on most leading superannuation funds, asset consultants and implemented consultants in Australia. Comparisons with KiwiSaver are formed based on various New Zealand source materials, in particular fund disclosures reported to the Financial Markets Authority (FMA). The date of analysis is at December 2013, to coincide with the introduction of MySuper in Australia from 1 January 2014. This paper examines policy frameworks in Section 2; the product and provider landscape in Section 3; balanced (growth) fund asset allocations in Section 4; lifecycle strategies in Section 5; fees in Section 6; and finishes with observations on the broad agendas and related debate in Section 7.
2. Policy Framework
MySuper and KiwiSaver are retirement saving schemes aimed at less engaged investors. Nevertheless, their policy frameworks differ considerably. Before considering the specific differences in the products themselves, it is worth contrasting the broad context under which they operate. Australia has had a compulsory retirement saving system since 1992. By contrast, KiwiSaver is non-compulsory and a more recent initiative, having being established in 2007. Hence the New Zealand system is considerably less developed. New Zealand superannuation assets at December 2013 stood at NZ$42.7 billion (19% of GDP), compared with A$1,809 billion in Australia (114% of GDP). 2
Underlying objectives also differ. Australia has constructed a compulsory retirement saving system that aims to build balances which might make a significant contribution towards adequate income in retirement. MySuper itself is intended for default fund members who do not choose their own fund, which comprise the majority by number.3 MySuper emerged out of the Super System Review of 2010 (‘Cooper Review’), whose vision was as follows:
“MySuper is a simple, well-designed product suitable for the majority of members. The MySuper concept is aimed at lowering overall costs while maintaining a competitive market-based, private sector infrastructure for super. The concept draws on and enhances an existing and well-known product (the default investment option). MySuper takes this product, simplifies it, adds scale, transparency and comparability, all aimed at achieving better member outcomes.”
Cooper Review, 2010
KiwiSaver largely aims at introducing New Zealanders to saving for retirement, with the view to encouraging a savings culture. It does this by enrolling workers into the system on an opt-out basis, supported by a $1000 ‘kick-start’ contribution and capped tax concessions (see Table 1). The stated objective for the scheme is as follows:
“The objective is to encourage a long-term savings habit and asset accumulation by individuals who are not in a position to enjoy standards of living in retirement similar to those in pre-retirement.”
Inland Revenue Annual Report, 2013 Table 1 contrasts the major features of the MySuper and KiwiSaver regulatory schemes. In addition to the level of compulsion and government support in terms of taxation, etc; another important difference relates to the product features. MySuper providers are required to offer a single default product, either a well-diversified investment strategy (i.e. some type of ‘balanced’ fund) or a lifecycle strategy. Life and permanent disability insurance is also bundled with superannuation in Australia. In New Zealand, providers can offer a wide range of KiwiSaver products; while default money is required to be invested in a conservative option. Also, KiwiSaver funds may be accessed to assist in buying a first home.
Aspect
MySuper
KiwiSaver
Contributions • Compulsory (‘Superannuation Guarantee’)• Contributions currently 9.5% of salary until 2021, then planned to rise to 12% by 2025
• Non-compulsory (opt-out basis; automatic enrollment upon starting new job)
• Three levels: 3%, 4%, 8% of gross pay, plus: • Employer contributions of 3% of gross pay
(taxed)
• Contribution holidays permitted Taxation • 15% contribution tax
• 15% tax on income (10% capital gains) • Voluntary contributions by low income
earners attract co-contribution of up to $500; contributions at the 15% concessional tax rates are capped at $30,000-$35,000
• Income is taxed at either 28%, or an individual ‘prescribed investor rate’
• Member tax credit of $521.43 pa, provided contributions total at least $1042.86 p.a. • Employer contributions are taxable as income
for the member Providers and
Products • Each registered superannuation entity can offer only one MySuper product • Must be either a single well-diversified
investment strategy, or lifecycle strategy
• Providers can offer wide range of products • Defaults invested in conservative option • Nine providers are designated default
providers, for members who do not chose
Fees • Set by provider
• Same fee paid by all members, with notable exception that discounts on administration fees may be negotiated by corporate plans • Single diversified strategies can charge only
one standard fee; lifecycle allowed four ‘price points’ based on age
• Fees restricted to administration fees,
investment fees, and certain transaction fees on a cost recovery basis
• Performance fees are permitted
• Default fees negotiated by government; otherwise set by provider with provisions against ‘unreasonable’ fees
• Performance fees are permitted
Required
Disclosures • Investment strategy; returns; return target (CPI-plus); risk measure (number of negative return years out of 20); fees; insurance offering
• Performance and returns; fees and costs; assets and portfolio holdings; liquidity and liabilities; key personnel; any conflicts of interest
Features • Fund choice, with 3-day portability • Default life and total and permanent
disability insurance on an opt-out basis (costs deducted from account). Many funds offer the option to vary, including scope to add income-protection insurance.
• Fund choice, with portability (transfers may not occur immediately4)
• Initial $1000 tax-free ‘kick-start’ contribution from the government
• Withdrawal to purchase first home, plus first home deposit subsidy of up to $5000 per person (available after 3 years)
Access
(General) • Full access at retirement, subject to reaching preservation age (55 to 60) • Limited access to income streams after
reaching preservation age
• Full access upon qualifying for NZ Super (government pension), provided that 5 years have passed since joining
MySuper Vs. KiwiSaver:
Retirement Saving for the Less Engaged
3. Provider and Product Landscape
Table 2 presents some high-level statistics on providers and products. MySuper is broken down into the four sectors of industry funds, public sector funds, corporate funds and retail funds. The first three sectors are ‘not-for-profit’,5 while retail providers are for-profit and largely comprise various wealth management companies. All KiwiSaver providers would sit within the retail sector under the Australian classification; and there is considerable overlap in the retail provider names that operate in both countries. There are three key points of distinction between the MySuper and KiwiSaver landscapes:I. Profit motive – The vast majority of the 120 MySuper products are offered by the not-for-profit providers: 76% by number and 80% by default assets of the provider. This creates scope for the competitive dynamics in Australia to differ from New Zealand, where all providers are profit-based.
II. Product range – The MySuper product universe is constrained by the fact that providers can only offer one fund. These products are either balanced funds – typically ‘growth funds’ with a growth/ income mix of around 70/30 – or a lifecycle strategy. Alongside MySuper, all Australian providers offer a wider range of options for their choice members.6 KiwiSaver accommodates the offering of a broad
range of products. The 29 KiwiSaver providers have 403 products on the collective menu at December 2013. Over half of these products are offered by one provider (Craigs), including a wide range of managed funds and individual securities.
III. Lifecycle – A solid cohort of MySuper lifecycle products is available in Australia: 19% by number and 35% by value. Notably around 60% of retail providers have opted for lifecycle. The introduction of MySuper opened the pathway for wider use of lifecycle in Australia, by permitting providers to impose a lifecycle approach upon their default members. Preliminary indications from interviews of fund executives7 suggests that those who chose a lifecycle strategy did so in part because they considered it superior for disengaged members, through managing sequencing risk on their behalf. In addition, it seems that some retail providers greeted lifecycle as something of a ‘game changer’. In New Zealand, lifecycle is a small feature of the landscape. It is offered by three providers in conjunction with other choices. AON/Russell offers four target date fund products; while AMP and NZ Funds offer lifecycle programs that switch between their KiwiSaver funds as the member ages.
Table 2: Products by Sector and Design
Sources: Chant West Super Fund Fee Survey, December 2013; quarterly disclosures to Financial Markets Authority
MySuper (A$) KiwiSaver (NZ$)
Sector Industry Public Corporate Retail Total Total * Ex. Craigs
Breakdown by Number Single Strategies (MySuper: Balanced)
44 7 34 12 97
Lifecycle Strategy 2 3 1 17 23 (4 funds + 2 programs)
TOTAL 46 10 35 29 120 403 193
Percentage of Total 38% 8% 29% 24% 100% 100% 48%
Percentage of Lifecycle Products 4% 30% 3% 59% 19% (Offered by 3 providers) By Fund Size, December 2013 #
Assets under Management ($bn) 301.3 119.1 41.4 113.2 575 19.8 19.6
Percentage of Total 52% 21% 7% 20% 100% 100% 99%
Percentage in Lifecycle Product 10% 76% 32% 60% 35% nc nc
Notes:
* There are 29 KiwiSaver providers.
# Australian total are based on all superannuation funds under the management for sample of 95 funds, excluding are non-public offer funds with assets below A$500m and tailored MySuper products (outsourced corporate plans). NZ numbers based on KiwiSaver products only.
4. Balanced (Growth) Funds: Asset Allocation
The analysis in this section is largely focuses on comparingthe asset allocation of balanced MySuper funds with the closest equivalent fund offered by each of the 29 KiwiSaver providers, usually a ‘growth’ fund. The closest KiwiSaver equivalent is identified as that fund with target weights for growth assets nearest to 72%, which is the average across our sample of MySuper balanced funds.8 Data constraints are a hurdle in making asset allocation comparisons. Chant West collects detailed information on strategic asset allocation (SAA) for a wide range of funds, of which
21 are balanced funds that have been rebranded as MySuper products.9 This provides a sample that captures a substantial portion of the MySuper products offered by the not-for-profit sector, including all the major industry funds by size. Chant West also collects actual asset weights, which are available for a subset of 16 funds out of the 21 funds. Data on the asset weightings for KiwiSaver funds is drawn from disclosures made to the FMA, and is much less granular than the Chant West data.
Table 3: Asset Allocation: MySuper ‘Balanced’ vs. KiwiSaver Nearest ‘Growth’ Equivalent
MySuper Balanced Products KiwiSaver Equivalents (29 Funds)
December 2013
(Percentage Weighting) Average SAA (21 funds) Actual vs SAA (16 funds) Difference Std Dev Target (SAA)Average Acutal vs Target Difference Std Dev GROWTH ASSETS
Australiasian Equities 26.7 -0.6 3.6 24.7 -0.9 5.4
International Equities 25.4 2.0 2.5 41.1 1.5 5.4
Total Equities 52.2 1.4 4.8 65.7 0.7 4.7
Local Listed Property 0.7 0.3 1.1 6.7 -0.9 2.6
Local Unlisted Property 4.6 -0.9 1.4 1.0 -0.2 0.7
Global Listed Property 0.9 -0.3 0.7
Global Unlisted Property 0.2 0.0 0.3
Total Growth Property 6.4 -0.9 1.8 7.7 -1.0 2.5
Private Equity 3.4 0.3 0.8 Unlisted Infrastructure 4.8 -0.1 0.8 Listed Infrastructure 0.4 0.0 0.2 Hedge Funds 1.2 0.0 1.0 Commodities/Gold Resources 0.0 0.0 0.1 Other 3.8 -0.2 1.2
Total Growth Alternatives 13.6 0.4 1.9
Total Growth Assets 72.2 0.9 3.2 73.4 -0.3 5.1
DEFENSIVE ASSETS
Cash 4.8 2.7 3.4 5.7 2.7 6.1
Local Fixed Interest 4.2 -0.6 1.2 9.4 -1.3 3.1
International Fixed Interest 3.4 -0.9 2.0 8.1 -0.9 1.7
Australian Inflation-Linked 0.5 0.1 0.3
International Inflation-Linked 0.3 -0.1 0.3
Broad Fixed Interest 4.8 -0.4 1.8
Total Fixed Interest 18.0 0.8 3.2 23.2 0.5 5.7
Australian Unlisted Property 3.6 -0.8 1.2
Global Unlisted Property 0.0 0.1 0.2
Total Defensive Property 3.7 -0.8 1.2
Debt 0.8 -0.1 0.3
Infrastructure 2.3 -0.4 0.6
Hedge Funds 1.8 -0.6 1.2
Other 1.1 0.2 1.1
Total Defensive Alternatives 6.1 -0.9 1.7
Total Defensive Assets 27.8 -0.9 3.2 23.2 0.5 5.7
MySuper Vs. KiwiSaver:
Retirement Saving for the Less Engaged
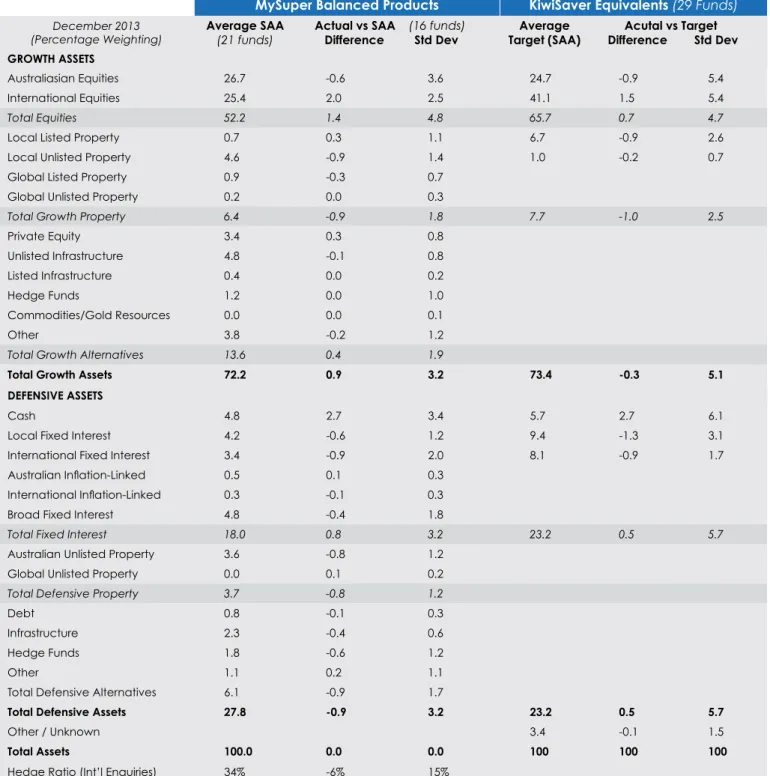
Table 3 reports target SAAs for the two samples, along with the deviation of actual asset weights from target SAA. The deviations from target give a rough guide to dynamic asset allocation activity. A key point of differentiation relates to the scope of asset classes utilized, particularly around unlisted, alternative assets. Australian balanced funds have an average SAA weighting in alternative assets of around 20%, the bulk of which is unlisted. There is a further weighting of about 8% in unlisted property. Furthermore, Chant West list 22 discrete asset classes, plus an ‘other’ category with weighting of just under 5%. The KiwiSaver equivalents have 65.7% in listed equities and 6.7% in listed property, which amounts to a 72.4% weighting in assets that are listed on equity markets. While the FMA data make it difficult to look through the entire breadth of assets, the declared weightings and associated strategy descriptions are consistent with KiwiSaver funds relying on a much narrower range of assets. The implication is that the New Zealand funds are far less diversified, and likely to be more dominated by how equity markets perform.
Three potential reasons for the differing exposure to alternatives are worth mentioning. The first is scale. New Zealand providers tend to lack the funds under management that may be required in order to access alternative assets and managers readily, and support the internal capability to manage exposures. The other reasons relate to two elements that are of more concern to retail providers, relative to the not-for-profit providers which dominate the Australian balanced fund sample of Table 3. One is the higher fees paid for alternatives, which means that they eat into ‘fee budgets’. This creates an incentive to limit the use of alternatives, especially for retail providers who are concerned about profit margins and may be constrained in the fees that they can charge by either the market (or in the case of KiwiSaver) the influence of regulatory scrutiny. The final reason is that use of illiquid assets is discouraged by portability and choice, which also tends to be of greater concern to retail providers due to the nature of their member base. By contrast, Australian not-for-profit funds are less worried about illiquidity because they view their invested funds as ‘stickier’.
In terms of dynamic asset allocation, the data indicate that both Australian and New Zealand managers are willing to take active positions by deviating from target SAA. At the end of 2013, Australian and New Zealand funds were modestly overweight equities and cash on average, while being underweight fixed income and property. The standard deviation of the differences from SAA is a bit larger for the KiwiSaver funds, consistent with a wider disparity in views and marginally more aggression in taking positions amongst New Zealand managers at that time.
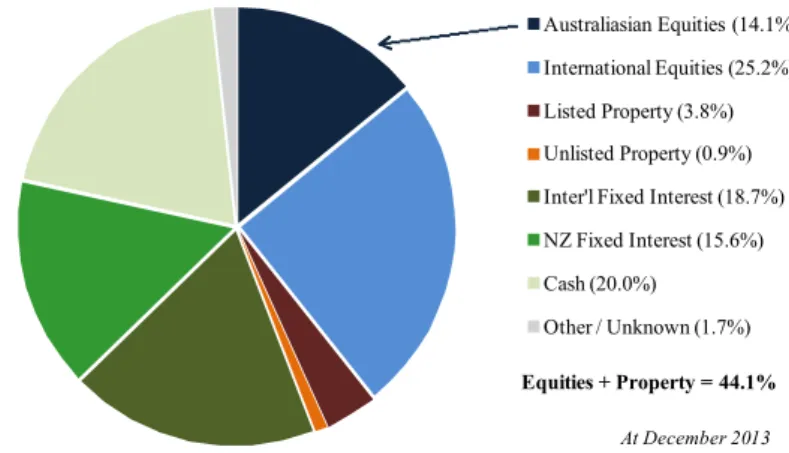
Asset allocations for the selection of KiwiSaver ‘growth’ fund equivalents masks the exposures held across the entire scheme. A skew exists towards conservative products within KiwiSaver, with 45% of assets estimated to be invested in products with target equity plus property weightings of 30% or less at end-2013. This skew reflects the direction of default monies into conservative funds, probably abetted by the purported conservative nature of New Zealand investors. Figure 1 reports the target SAA across all KiwiSaver products, weighted by assets. The sum of the average weighting in equities plus property equals 44.1%. By contrast, the equivalent number for Australia is probably in the 60%-70% range.10 The implication of a conservative asset allocation is that adequate balances are less likely to be generated over the long-run, although the risk of short-term fluctuations may be reduced. In the context of retirement savings, ‘shortfall’ risk may actually be higher with conservative strategies, as evidenced in an analysis of KiwiSaver by MacDonald et al. (2012). The skew to conservative products hence potentially exacerbates the problem of adequacy for New Zealand, which will be further discussed in Section 7.
Figure 1: Target Asset Allocation across All KiwiSaver
Products (Asset-Weighted)
Source: quarterly disclosures to Financial Markets Authority
5. Lifecycle Funds
This section provides a sense for the lifecycle fund offerings: for further detail on MySuper lifecycle funds, refer to Chant et al. (2014). A key motivation of a lifecycle approach is to reduce sequencing risk, (i.e., address the possibility that members could suffer a large loss in fund value when it matters most near retirement). An underpinning assumption is that members become more risk averse with respect to their investment in superannuation as retirement approaches. This is based on two notions. First, the balance of wealth shifts away from nearly-exhausted human capital towards other assets in the portfolio as a member ages.
Australiasian Equities (14.1%) International Equities (25.2%) Listed Property (3.8%) Unlisted Property (0.9%) Inter'l Fixed Interest (18.7%) NZ Fixed Interest (15.6%) Cash (20.0%)
Other / Unknown (1.7%) Equities + Property = 44.1%
10 20 30 40 50 60 70 80 90 100 Pe re ntage of G row th Asse ts
Average Path - MySuper Funds First State Super MySuper Life Cycle AON MySuper
AON KiwiSaver - Russell Lifepoints® TargetDate
component of the portfolio, given that it will be near its maximum level around retirement. With older members more heavily reliant on their superannuation fund, their propensity for bearing risk in that fund is lessened. Another consideration is that members near retirement ‘have less time to recover’ if their superannuation balance declines, although some may have an option to defer retirement and work a few more years.
Proponents of lifecycle investing acknowledge that the above line of argument could potentially overstate the importance of de-risking the superannuation fund, to the extent that due consideration is not given to social security as an asset, or a downside protection mechanism; and the existence of substantial other assets outside of superannuation. Other considerations include that increases in longevity may mean that the optimum time to de-risk could be later in life; and the possibility that markets can tend to mean-revert after large falls -- in which event the option to remain invested in growth assets may be a valuable alternative to crystallizing the losses.
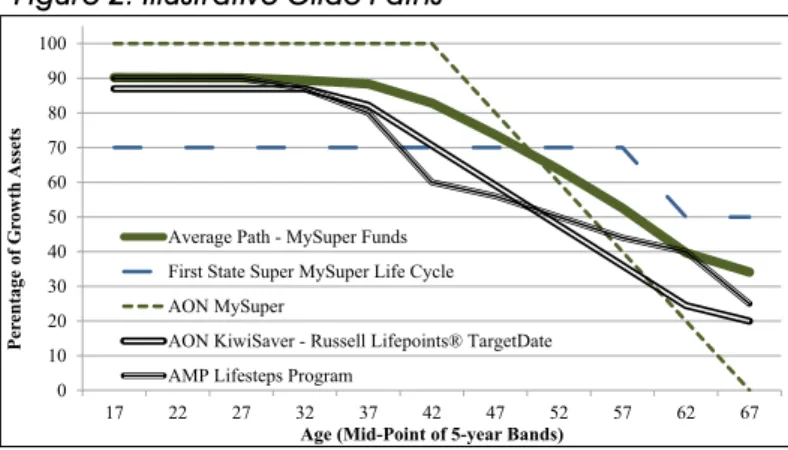
MySuper lifecycle strategies largely involve reducing exposure to growth assets as a member progresses towards retirement based on age. Figure 2 plots the average transition – commonly called the ‘glide path’ – across the 23 MySuper lifecycle funds, along with 3 selected examples to illustrate some differing paths. Most MySuper products carry a high growth exposure of 85% or more until the member achieves an age around their 40s, then progressively transition towards weightings centered around 30%-40% sometime prior the retirement age of 67. Figure 2 also plots the two extremes within the MySuper lifecycle sample in terms of glide paths. The most aggressive is AON MySuper, which commences with 100% growth assets then transitions to 0% at retirement. The least aggressive is First State Super, which makes a moderate single transition from 70% to 50% growth assets at age 59. Figure 2 also plots the glide paths for the AMP Lifesteps and AON/Russell KiwiSaver lifecycle offerings11 for comparison.
Figure 2: Illustrative Glide Paths
may be missing out through a limited use of lifecycle strategies. The answer is: “it depends”. Whether it is appropriate to de-risk as retirement approaches will vary across individuals. De-risking sacrifices expected return in order to lower risk (see Chant et al., 2014). Hence the issue is whether an individual would be better off protecting their nest egg, or retaining the chance for higher spending in retirement. The magnitude of overall wealth and the availability of social security benefits are important. De-risking tends to matter less for individuals with high wealth (they can bear the risk) and low wealth (the impact is marginal, and social security becomes the dominant consideration and provides a low-risk income stream). It is at middle wealth levels that lifecycle strategies might offer greatest benefit. In any event, addressing the need for lifecycle strategies does not seem pressing until KiwiSaver matures and balances increase to more meaningful levels.
6. Fees
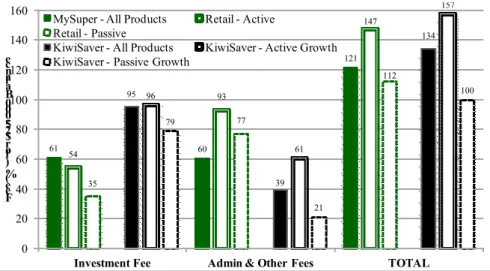
Notable differences exist between the two schemes in both fee structures and the fee level paid by the typical member. To demonstrate these features, Table 4 reports fee data across selected market sectors,12 while Figure 3 plots selected fees for a $25,000 balance. The analysis involves splitting the products of retail providers into active and passive segments, acknowledging the marked difference in these offerings and hence the associated fee levels. MySuper fees are based on Chant West data for 94 products, reflecting a similar sample to Table 2.13 KiwiSaver fee data is drawn from fund disclosures to the FMA for December 2013. As well as the average across all products, the fees for 26 actively managed and 3 passively managed14 KiwiSaver ‘growth’ funds are reported. The latter might be directly compared with the MySuper retail products.
The main difference in fee structures is that KiwiSaver products tend to charge larger percentage fees but have smaller fixed dollar components. The average percentage fee charged by KiwiSaver products of 1.17% is considerably higher than the 0.90% average for all MySuper products. Meanwhile, the average fixed dollar fee charged by KiwiSaver funds of NZ$42.09 is considerably less than the A$77.31 for MySuper funds.15 Existence of fixed fee components means that the effective fee paid and hence any comparisons depend on member balance. The bottom of Table 4 reports fees for selected balances, including levels of $9,000 and $30,000 which broadly reflect average balances in New Zealand and Australia
MySuper Vs. KiwiSaver:
Retirement Saving for the Less Engaged
Once balances rise into the $10,000-$25,000 range (depending on product), the MySuper structure delivers a lower total fee due to lesser percentage fees. At indicative average balance levels (outlined), a ‘typical’ KiwiSaver member pays considerably more than a ‘typical’ MySuper member (1.64% vs. 1.06%). Given differences in scale, this is probably to be expected. Nevertheless, the high percentage component will limit the fee relief for KiwiSaver members as balances grow, unless fees structures are adjusted.
Comparisons of the average fee across all products are limited in meaning given the differing product ranges. A more direct comparison can be made between the MySuper retail products and the closest equivalent KiwiSaver ‘growth’ funds
offered by the 29 providers. Again the comparison depends on account balance. The cross-over point at which the fees would be lower under the fee structure of MySuper retail funds versus KiwiSaver growth funds sits at about $16,300 for active products and
$48,000 for passive products. Figure 3 presents a comparison at balances of $25,000. However, there is a further twist to the story. Chant West estimates that Australian companies can negotiate fee discounts of as much as 0.70% on administration fees for a $1 billion-plus plan, so that their employees may pay less than 0.80%. Hence the headline fees may not represent what is charged to all members in MySuper retail funds. Nevertheless, it appears that the active products offered by MySuper retail providers will be cheaper than the equivalent KiwiSaver growth funds for many members, except perhaps those with small balances.
Table 4: Fee Structures
Sources: Chant West Super Fund Fee Survey, December 2013; quarterly disclosures to Financial Markets Authority
Figure 3: Average Fess by Segment (For $25,000 Balance)
61 60 121 54 93 147 35 77 112 95 39 134 96 61 157 79 21 100 0 20 40 60 80 100 120 140 160
Investment Fee Admin & Other Fees TOTAL
Fe e ( % ) f or $ 25 ,0 00 B al an ce
MySuper - All Products Retail - Active Retail - Passive
KiwiSaver - All Products KiwiSaver - Active Growth KiwiSaver - Passive Growth
Sources: Chant West Fee Survey, December 2013; quarterly disclosures to Financial Markets Authority
MySuper (A$) KiwiSaver (NZ$)
Sector: ProductsAll Industry Funds SectorPublic Stand-AloneCorporate Retail - Active PassiveRetail - ProductsAll Growth - Active Growth - Passive
Number of Funds 94 44 10 14 17 9 403 26 3 Total Assets ($bn) 575 301 119 41 92 22 20 3.0 0.4 Average Size ($bn) 6.1 6.8 11.9 3.0 5.4 2.4 0.05 0.11 0.13 Percentage Fees: Investment Fee 0.61% 0.68% 0.64% 0.60% 0.54% 0.35% 0.95% 0.96% 0.79% Administration, Other 0.30% 0.20% 0.22% 0.18% 0.61% 0.43% 0.22% 0.47% 0.13% Total 0.90% 0.88% 0.86% 0.78% 1.15% 0.78% 1.17% 1.43% 0.92% Dollar Fees:
Membership Fee (pa) $77.31 $78.80 $52.10 $83.07 $79.82 $84.33 $42.09 $34.03 $20.00 Total Fee (%) $5,000 2.45% 2.46% 1.90% 2.44% 2.75% 2.47% 2.02% 2.12% 1.32% $9,000 1.76% 1.76% 1.44% 1.70% 2.04% 1.72% 1.64% 1.81% 1.14% $10,000 1.68% 1.67% 1.38% 1.61% 1.95% 1.63% 1.59% 1.77% 1.12% $25,000 1.21% 1.20% 1.07% 1.11% 1.47% 1.12% 1.34% 1.57% 1.00% $30,000 1.16% 1.15% 1.03% 1.06% 1.42% 1.06% 1.31% 1.55% 0.98% $50,000 1.06% 1.04% 0.96% 0.94% 1.31% 0.95% 1.26% 1.50% 0.96% $100,000 0.98% 0.96% 0.91% 0.86% 1.23% 0.87% 1.22% 1.47% 0.94%
7. Concluding Comments on the Agenda and Debate
In concluding, it is interesting to reflect on the agenda anddebate observed for the two retirement savings systems. In Australia, attention has traditionally been directed towards building balances in the system. This is reflected in the compulsory nature of contributions, and expressions of concern that these contributions may be insufficient to generate adequate income in retirement. Plans to increase the Superannuation Guarantee Levy to 12% reflect this concern.17 Attention has more recently turned towards addressing the retirement phase, which is one of the key issues under consideration by Australia’s Financial System Inquiry (ongoing at time of writing). Other points of debate include the level of fees, and the budgetary costs of providing superannuation tax concessions to the wealthy. Butt et al. (2014) describe a range of issues concerning fund executives, including: alignment with members; the amount of regulatory change; reporting and disclosure; and the folly of focusing on just fees rather than net benefit.
The ambitions for KiwiSaver appear far more modest. Much of the commentary seems to be around member activity such as enrolments, as well as the macroeconomic and budgetary effects of the scheme (although the work of the Commission for Financial Literacy and Retirement Income is notable).18 Concern over the ability to meet the retirement needs of members is much less heightened than
in Australia. This is notwithstanding the adequacy challenge facing New Zealand being heightened by the immaturity of KiwiSaver, the associated low balances, and relatively modest contribution levels (see analysis of MacDonald et al., 2012).
Further, KiwiSaver seems geared towards attracting smaller balances. The government concessions and employer co-payments offered are limited in scope. There is a strong incentive to open a KiwiSaver account and contribute $1040 a year, in order to secure the $1000 kick-start grant, the $520 per annum ‘tax credit’ and a minimum 3% employer contribution. However, it is not apparent why New Zealanders would make significant additional contributions, given that the funds become locked in and hence flexibility is lost, along with the associated exposure to regulatory uncertainty when committing over extended periods. They may perceive other immediate uses for the cash, or believe that the age pension will suffice. The temptation must be to do enough to secure the associated benefits, and no more.19 In addition, defaulting into conservative funds works against building balances over the long-run for default members. Unless some changes are made to KiwiSaver, it seems likely that retirement adequacy will persist as a major issue for New Zealand.
References
Annual Superannuation Bulletin, Australian Prudential Regulation Authority, June 2013 (revised 5 February 2014).
Butt, A., Donald, S. Foster, D., Thorp, S. and Warren, G. (2014), The Superannuation System and its Regulation: Views from Fund Executives. CIFR Research Working Paper (July).
Chant, W., Mohankumar, M. and Warren, G. (2014), MySuper: A New Landscape for Default Superannuation Funds. CIFR Research Report (April).
Focusing on the Future: Report to the Government, Review of Retirement Income Policies, Commission for Financial Literacy and Retirement Income, 2013.
KiwiSaver Evaluation: Annual Report, July 2012 to June 2013, New Zealand Inland Revenue Department, October 2013.
KiwiSaver website (http://www.KiwiSaver.govt.nz/).
MacDonald, K.L., Robert J. Bianchi, R.J and Drew, M.E. (2012), KiwiSaver and Retirement Adequacy. Australasian Accounting, Business and Finance Journal, 6(4), 61-78.
Super Fund Fee Survey, Chant West, December 2013. Super System Review: Final Report, Commonwealth of Australia, 2010 (The ‘Cooper Review’).
The New MySuper Investment Landscape, Chant West Multi-Manager Quarterly Survey, September 2013.
MySuper Vs. KiwiSaver:
Retirement Saving for the Less Engaged
Corresponding Author:
Geoffrey J. Warren, Research Director, Centre for International Finance and Regulation, Level 7, 1 O’Connell Street, Sydney, NSW, Australia, 2000. Phone: +61-2-9932 9321; Email [email protected]
Note
1. The analysis is based around 120 MySuper products and 29 KiwiSaver providers that were in existence during early 2014. The number of MySuper products has subsequently declined to 118, and the number of KiwiSaver providers to 28.
2. Estimates are based on data from the Reserve Bank of New Zealand, Statistics New Zealand, Australian Prudential Regulation Authority (APRA) and Australian Bureau of Statistics. The GDP base used is four-times December quarter, seasonally adjusted.
3. According to Cooper (2010), around 80% of members are believed to be invested in the default fund of their employers, although about 20% may have actively chosen to do so. Other member types include ‘choice’ members who select from the gamut of products offered by superannuation fund providers; and self-managed superannuation fund (SMSF) members who are typically the most engaged with higher balances. The latter comprised 31.4% of superannuation assets at June 2013 according to APRA.
4. Industry sources advise it may take up to one month to transfer funds.
5. The majority of the 35 corporate products are understood to have outsourced the investment management to retail providers. In this case, they engage with the ‘for-profit’ stream even though the sponsoring corporation itself may have no profit motive.
6. According to APRA fund level data, the median number of options offered on the superannuation menu is 7 for not-for-profit funds and 19 for retail funds. However, larger retail providers may have in excess of 100 options on the menu.
7. This work is occurring under CIFR Grant SUP002, with a working paper planned for late-2014.
8. The equity plus property weightings for the KiwiSaver sample averages 73%, with a range from 58% to 95%. 9. One of these funds supplies actual asset allocations, which have been used as a proxy for their SAA.
10. The Australian Bureau of Statistics (ABS 5655.0 – Managed Funds) reports totals across all superannuation funds, but the breakdown does not support precise estimates. As a guide, the sum of equities, units in trusts and land and buildings held in Australia summed to 68% of total Australian assets at December 2013.
11. The NZ Funds’ lifecycle glide path is more difficult to extract, as this provider appears to vary asset allocation aggressively and may not follow a deterministic path.
12. Two features of MySuper fee structures are worth noting. First, not-for-profit funds have relatively high investment fees coupled with low administration fees. A key reason is that these funds tend to invest actively and use more unlisted alternative assets. Second, retail providers often limit investment fees and load up on administration fees to provide more latitude to offer discounts on the latter to corporate plans.
13. Lifecycle product fees are incorporated as those applicable to a 50-year old member. One outlier has been removed.
14. Three KiwiSaver providers offer an entirely passive product range: ASB, Brooks Professional and Smartshares. Brooks Professional has subsequently exited the industry. It is worth observing that 62 (15%) of the listed KiwiSaver products are described as either passive or tracking an index.
15. We call dollar-based fees ‘membership fees’, although often denoted as administration fees in MySuper product disclosures.
16. The average account balance in KiwiSaver is estimated at ~NZ$8,785 at December 2013. The average balance in MySuper accounts is unknown, although as a guide APRA (2013) reports average balances for retail fund members of A$29,370 and industry fund members of A$28,172 at June 2013.
17. The Australian Government recently extended the timetable for 12% contributions from 2022 to 2025, attracting criticism.
18. There has also been a keen focus on relative fund performance. The same could be said of Australia historically; although the industry seems to be shifting here as the debate turns towards income in retirement.
19. 19. According to the Inland revenue Annual Report (2013), 58% of KiwiSaver members contribute at the 3% rate, 36% at the 4% rate, and only 5% at the 8% rate.