2
2 9
9 5
5
Marek Dabrowski, Malgorzata Antczak
and Michal Gorzelak
Materials published here have a working paper character. They can be subject to further publication. The views and opinions expressed here reflect the author(s) point of view and not necessarily those of the CASE. The publication was prepared for the participants of the international conference "Europe after the Enlargement", organized by CASE-Center for Social and Economic Research in Warsaw on April 8-9, 2005.
The publication was financed under the Matra Small Embassy Projects Programme of the Netherlands Ministry of Foreign Affairs.
Keywords: European Union, Economic and Monetary Union, Stability and Growth Pact, new member states, Central and Eastern Europe, fiscal policy, EMU enlargement.
© CASE – Center for Social and Economic Research, Warsaw 2005
Graphic Design: Agnieszka Natalia Bury
DTP: CeDeWu Sp. z o.o.
ISSN 1506-1701, ISBN: 83-7178-369-8
Publisher:
CASE – Center for Social and Economic Research 12 Sienkiewicza, 00-944 Warsaw, Poland
tel.: (48 22) 622 66 27, 828 61 33, fax: (48 22) 828 60 69 e-mail: case@case.com.pl
Contents
Abstract . . . 5
1. Introduction . . . 6
2. Fiscal legacy of transition . . . 6
3. Fiscal costs of EU accession . . . 8
3.1. The impact of net EU transfers on public finances . . . 8
3.2. Accession-related expenditures . . . 10
3.3. Underlying assumptions . . . 11
4. NMS on the road to EMU. . . 12
4.1. Simulation model . . . 12
4.2. Detailed assumptions on input data . . . 13
4.3. Simulation results: the fast growth assumption . . . 14
4.4. Simulation results: the slow growth assumption . . . 17
4.5. The case of Estonia and Lithuania . . . 19
4.6. Conclusions from the projection . . . 19
5. The long-term fiscal challenges in the EU-25/27 . . . 19
6. Do EU fiscal surveillance rules need modification? . . . 20
7. Summary and conclusions . . . 21
Marek Dabrowski
Professor of Economics, Chairman of the CASE Foundation Council, Chairman of the Supervisory Board of
CASE-Ukraine in Kiev, former First Deputy Minister of Finance of Poland (1989-1990) and former Member of the
Monetary Policy Council of the National Bank of Poland (1998-2004). In the last decade he has been involved
in policy advice and policy research in Belarus, Bosnia and Herzegovina, Bulgaria, Georgia, Iraq, Kazakhstan,
Kyrgyzstan, Macedonia, Moldova, Mongolia, Romania, Russia, Serbia, Ukraine and Uzbekistan and in a number
of international research projects related to monetary and fiscal policies, currency crises, EU and EMU
enlargement, and the political economy of transition.
Malgorzata Antczak
She graduated from the Department of Economics, Warsaw University (MA in 1994). Malgorzata Antczak has
worked with CASE since 1994. Her research interests include economics of transition, European integration in
Central and Eastern Europe and ownership changes in the Polish enterprise sector during transition. She has
also worked on fiscal aspects of EU enlargement and fiscal convergence in acceding countries, disinflation and
currency crises in emerging markets, education financing and its influence on the elasticity of the labor market
in Poland, and conducted financial analysis of enterprises quoted at the Warsaw Stock Exchange market.
Michal Gorzelak
He is a researcher specializing in macroeconomic analyses, fiscal relations and comparative studies of the CEE
economies. Michal Gorzelak graduated from the Warsaw University, Department of Economics, in 1997. After
spending some time in PricewaterhouseCoopers, Audit Department, he took a position of an independent
researcher in The Research Centre For Economic & Statistical Studies of The Central Statistical Office and The
Abstract
Since May 1, 2004 the European Union's new member states (NMS) have been subject to the same fiscal rules established in the Treaty on the European Union and Stability and Growth Pact (SGP) as the old member states (OMS). The NMS entered the EU running structural fiscal deficits. More than half of them (including the biggest ones) breach the Treaty's actual deficit limits and are already the subject of the excessive deficit procedure. A high rate of economic growth makes the fiscal situation of most NMS reasonably manageable in the short- to medium-term, but the long term fiscal outlook, mostly connected with the consequences of an aging population, is dramatic. The NMS should therefore prepare themselves now to be able to meet this challenge over the next decades (the same goes for the OMS). In addition, the perspective of EMU entry should provide the NMS with a strong incentive to reduce their deficits now because waiting (and postponing both fiscal adjustment and the adoption of the Euro) will only result in higher cumulative fiscal costs. The additional financial burden connected with EU accession cannot serve as excuse in delaying fiscal consolidation.
In spite of the growing debate on the relevance of the EU's fiscal surveillance rules and not excluding the possibility of their limited modification, they should not be relaxed. Frequent breaching of these rules cannot serve as an argument that they are irrelevant from the point of view of safeguarding fiscal prudence and avoiding fiscal 'free riding' under the umbrella of monetary union. Any version of fiscal surveillance rules (either current or modified) must be solidly anchored in an effective enforcement mechanism (including automatic sanctions) at the EU and national levels.
1. Introduction
Since May 1, 2004, the European Union’s new member states (NMS) have been subject to the same fiscal rules established in the Treaty on the European Union and Stability and Growth Pact (SGP) as the old member states (OMS). This is a new situation for the NMS given that prior to accession their fiscal situation was not the subject of regular and binding surveillance. Furthermore, the NMS are obliged to enter Economic and Monetary Union (EMU) at some point and meeting the fiscal convergence criteria is perhaps the most serious obstacle on this road, for some of them at least.
Each NMS has a specific fiscal situation, with the Baltic countries and Slovenia representing a healthier fiscal stance and the ‘Visegrad group’ (the Czech Republic, Hungary, Poland and Slovakia), Cyprus and Malta suffering serious fiscal problems. In addition, NMS have to deal in the short- to medium-term with the negative fiscal consequences of EU accession (contributions to the EU budget, co-financing and pre-financing EU transfers and costs of adopting the acquis).
Although in the early years of membership the NMS may continue to demonstrate certain characteristics of their specific fiscal situations and policies, in the medium- to long-term the nature of their fiscal problems is unlikely to differ from what can be observed today and is expected in the OMS. This is reflected, for example, in the high level of fiscal redistribution that is an effect of the excessive level of social-related expenditures and is further challenged by the expected consequences of population aging. Thus, most OMS and NMS will continue to face serious fiscal strains in the next decades. On the microeconomic level, both OMS and NMS have to increase the competitiveness of their economies and their excessive fiscal burden is one of the most serious obstacles blocking this path.
This paper provides a detailed analysis of the fiscal challenges faced by the NMS with special attention given to the eight transition economies of Central Europe and the Baltic region (NMS-8)1. The paper is organized in the following way. Section 2 analyses the fiscal situation of NMS and differences between them. Section 3 extends this analysis with an attempt to estimate the fiscal costs of EU accession for the NMS. In Section 4 we discuss the prospects and seek to gauge the preconditions for the NMS to meet fiscal convergence criteria as defined by the Treaty of the European Union and the SGP. Section 5 focuses on the long-term fiscal challenges stemming mainly from unfavorable demographic trends faced by both OMS and NMS in the not so distant future. Section 6 addresses the hot issue of EU fiscal surveillance rules. Finally, Section 7 offers final conclusions.
2. Fiscal legacy of transition
Six out of ten NMS (the Czech Republic, Cyprus, Hungary, Malta, Poland and Slovakia) entered the EU with serious fiscal imbalances, breaching the fiscal deficit criteria established by the Treaty on the European Union and the SGP. This was reflected in a Council of Ministers decision on July 5, 2004, on the existence of an excessive deficit in these countries, taken under Article 104 (6) of the Treaty.
1
This paper draws on the results of the CASE research project ‘Strategies for Joining the EMU’ coordinated by Marek Dabrowski and Jacek Rostowski and financed by Poland’s Scientific Research Committee (grant No. 2 H02C 029 23). We would like to thank Filip Keereman and other discussants during the DGEcFin Workshop on ‘Fiscal Surveillance in EMU: New Issues and Challenges’ in Brussels, November 12, 2004 for their helpful comments. However, the authors take the sole responsibility for the content of this paper, its quality and presented conclusions.
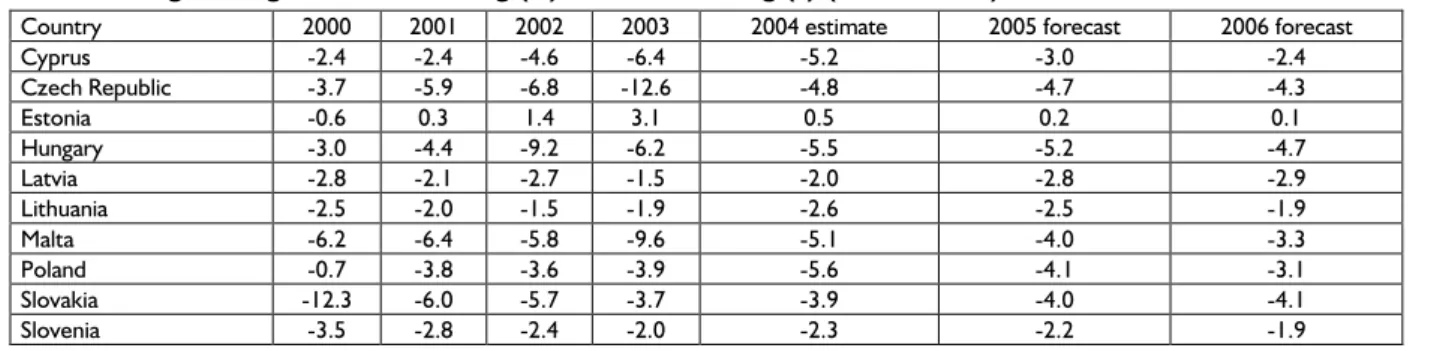
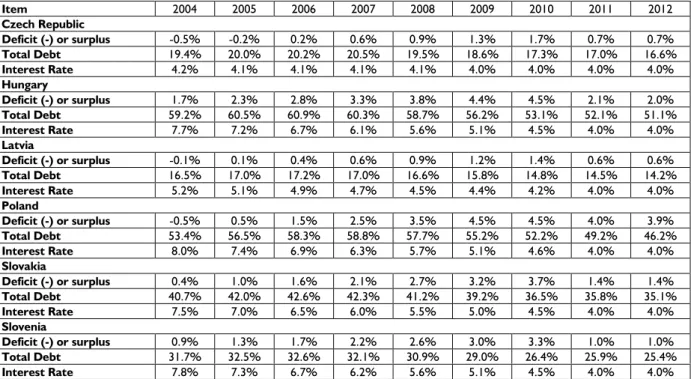
In addition, as Table 1 shows, the fiscal situation of most of the NMS has worsened since the beginning of this decade. Five countries (the Czech Republic, Cyprus, Hungary, Malta and Poland) have recorded substantial deterioration in their fiscal positions compared to 2000, while the others have seen either slightly improved or stabilised balances (in relation to GDP).
The situation is even worse if we take into consideration the relatively high GDP growth rates in most of the NMS. As Coricelli and Ercolani (2002) point out correctly, budget deficits in the NMS are both structural and cyclical in their character2and their fiscal positions are more vulnerable to changes in real GDP growth than in the case of the OMS. This means that if a current growth rate slows down for any reason the existing fiscal problems will become even more acute.
However, one should bear in mind the differences between individual NMS. While net government borrowing in Estonia, Lithuania, Latvia and Slovenia was below 2% of GDP in 2003 (and Estonia recorded substantial net lending of 3.1% of GDP), the same indicator for the Czech Republic3, Hungary, Malta and Cyprus well exceeded 5%.
Budget execution estimates for 2004 are not radically different from the above presented picture. At least six NMS are expected to record a net borrowing ratio of above 3% of GDP. Furthermore, official forecasts for 2005-2006 (Table 1) present only a very modest improvement, if any. Post-accession membership related expenditures (see Section 3) can be considered as one of the reasons underpinning these fiscal troubles, at least in the short-term. However, the chronic character of fiscal imbalances in many NMS, going back to the earlier stages of their post-communist transitions (see EPI, 1997, Dabrowski &
2Only Estonia represents a really healthy medium-term fiscal outlook, close to that recommended by the SGP. 3
The sharp deficit increase in the Czech Republic in 2003 was caused by a one-off disclosure of contingent liabilities (Polackova-Brixi, 2004).
Table 1. Net general government lending (+) or net borrowing (–) (as % of GDP)
Country 2000 2001 2002 2003 2004 estimate 2005 forecast 2006 forecast
Cyprus -2.4 -2.4 -4.6 -6.4 -5.2 -3.0 -2.4 Czech Republic -3.7 -5.9 -6.8 -12.6 -4.8 -4.7 -4.3 Estonia -0.6 0.3 1.4 3.1 0.5 0.2 0.1 Hungary -3.0 -4.4 -9.2 -6.2 -5.5 -5.2 -4.7 Latvia -2.8 -2.1 -2.7 -1.5 -2.0 -2.8 -2.9 Lithuania -2.5 -2.0 -1.5 -1.9 -2.6 -2.5 -1.9 Malta -6.2 -6.4 -5.8 -9.6 -5.1 -4.0 -3.3 Poland -0.7 -3.8 -3.6 -3.9 -5.6 -4.1 -3.1 Slovakia -12.3 -6.0 -5.7 -3.7 -3.9 -4.0 -4.1 Slovenia -3.5 -2.8 -2.4 -2.0 -2.3 -2.2 -1.9 Source: EC (2004)
Table 2. Public debt (% of GDP)
Country 2000 2001 2002 2003 2004 estimate 2005 forecast 2006 forecast
Cyprus 61.6 64.3 67.4 70.9 72.6 72.4 69.4 Czech Republic 18.2 25.3 28.8 37.8 37.8 39.4 40.6 Estonia 4.7 4.4 5.3 5.3 4.8 4.4 4.2 Hungary 55.4 53.5 57.2 59.1 59.7 59.5 58.9 Latvia 12.9 14.9 14.1 14.4 14.6 15.4 16.6 Lithuania 23.8 22.9 22.4 21.4 21.1 21.7 21.3 Malta 56.4 62.0 62.3 70.4 72.4 73.7 74.2 Poland 36.8 36.7 41.1 45.4 47.7 49.8 49.3 Slovakia 49.9 48.7 43.3 42.6 44.2 45.2 45.9 Slovenia 27.9 28.1 29.5 29.4 30.9 30.8 30.6 EU-25 62.9 62.1 61.6 63.2 63.5 63.5 63.3 OMS (EU-15) 64.0 63.2 62.7 64.2 64.4 64.5 64.3 Eurozone-12 70.4 69.4 69.4 70.7 71.1 71.1 70.9
Note: Government gross debt as defined in the Council Regulation (EC) N 3605/93. ESA 95. Source: EC (2004).
Rostowski, 2001), may suggest that there is not enough political determination and support to carry out fundamental fiscal adjustment.
Analysing the second fiscal criterion defined by the Treaty, i.e. a public debt to GDP ratio, all the NMS except for Cyprus, Malta and Hungary, seem to be well below the 60% threshold. This represents, on average, a better performance than the OMS (see Table 2). However, the above-mentioned three countries plus the Czech Republic and Poland have recently recorded rapid increases in their debt to GDP ratios. Again, Estonia represents the best performance in the overall NMS group.
The NMS’ fiscal troubles have their roots in high budget expenditures, particularly those related to social commitments. In several cases, such as Hungary and Poland, high interest payments, i.e. costs of servicing the already accumulated public debt, have also led to a narrowing of the room for fiscal maneuver.
3. Fiscal costs of EU accession
EU membership has brought additional fiscal pressures to bear (other things being equal) on the NMS. This stems in part from the obligations to contribute to the EU budget, co-finance projects financed from EU structural funds, pre-finance some EU transfers during the first period of membership and continue the implementation of acquisin some costly areas, such as environmental protection, infrastructure, border control and public administration. Fiscal problems caused by EU accession seem to contradict a popular view, held both in OMS and NMS, that EU enlargement would involve substantial net positive transfers from OMS to NMS. However, one must distinguish between the impact of accession on a country’s net financial position (balance of payments consequences) and its net fiscal position.
There is very little quantitative estimation of the fiscal effects of accession available and most studies have been limited to a general observation that EU accession implies further budgetary challenges in addition to those already arising from economic transition (see e.g. EE, 2002). The exceptions are Kopits and Szekely (2002), Mayhew (2003) and Backe (2002), who estimate relatively substantial accession-related fiscal costs4under the assumption that ‘policies will remain unchanged.’
In this paper, our efforts to estimate the net fiscal impact of accession take into consideration net EU transfers to the government sector and accession-related budget expenditures, which are connected with the adoption of the acquis communautaire.
3.1. The impact of net EU transfers on public finances
There are two main groups of factors determining the direct fiscal consequences of EU membership: (i) the size of EU transfers directly channeled to the government sector and (ii) member countries’ contribution to the EU budget.
Membership contributions to the EU budget are one of the most important, but also predictable, fiscal costs of accession. The NMS-85must pay contributions equivalent to 1.27% of annual GDP in 2005 and
4
3-4.75% of GDP annually in the medium term, according to Kopits and Szekely (2002).
5Malta and Cyprus are obliged to pay a higher membership contributions (1.5% of GDP), while the structure of received transfers
2006. Postponing their accession date from January 1 to May 1, 2004, reduced by one third their annual contributions in 2004, to the level of 0.85% of the NMS-8s’ GDP. For the purpose of this analysis, the annual average contribution is calculated at an average of 1.1% of GDP for 2004-2006.
There are two sources of uncertainty that make estimating the fiscal impact of EU accession difficult. Firstly, it is not easy to calculate the share of total transfers to the general government sector (i.e. state budget, regions, municipalities and extra-budgetary funds) because not every transfer from the EU budget is recorded in general government accounts. Some funds go directly to private beneficiaries (farmers, enterprises, schools, NGOs, and others), where the government functions only as a ‘postman’ (Hallet, 2004). Secondly, it is not yet known how large a part of the potential transfers can be absorbed in practice. A modest absorption of EU financial sources will threaten not only national budgets but also countries’ net financial positions.
The types of transfers that most probably go to the general government accounts are:
• Cohesion Fund (CF) transfers mainly financing environmental projects and transport infrastructure, subject to a local matching requirement of 15% of project costs.
• Special cash flow facility funds and temporary budgetary compensation are special lump sum payments designed to resolve the problem of cash shortfalls in some NMS. They are transferred in monthly installments, which might partially offset membership contributions.
• Additional expenditure and ‘internal actions’ transfers – such fixed transfers are used for administration, nuclear safety, institution building and the Schengen facility fund.
• Structural Fund (SF) transfers tied to specific projects and programmes, subject to a local co-financing requirement in the range of 25-50% (depending on regional per capita income). Only part of these will be addressed to general governments as the final beneficiary.
• The part of CAP transfers related to rural development programmes
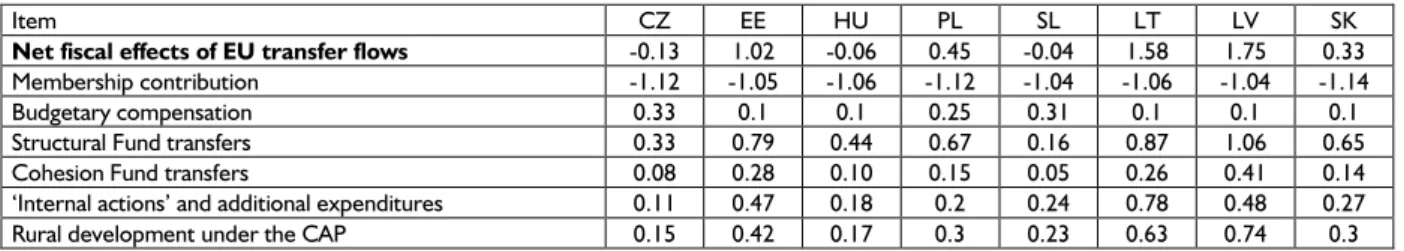
According to our estimation (see Table 3) five NMS will record positive net fiscal effects of EU transfers in 2004-2006. These are: Latvia (1.75% of GDP), Lithuania (1.58%), Estonia (1.02%), Poland (0.45%) and Slovakia (0.33%). Three countries will record a negative fiscal effect: Slovenia (0.04% of GDP), Hungary (0.06%) and the Czech Republic (0.12%), due to the relatively low level of SF and CF transfers, which can be considered an indirect consequence of their higher GDP per capita levels (compared to other NMS). The relatively high budgetary compensations in the Czech Republic and Slovenia will not change this picture.
Part of the SF and rural development transfers will be channeled directly to eligible producers from the private sector with no direct positive impact on the general government. The actual net fiscal effects of EU transfers will therefore be less favorable for the NMS than those presented in Table 3.
In addition, effective payments for different appropriations will lag, sometimes by many months, behind NMS’ contributions to the EU budget (paid in monthly installments from May 2004). This creates a one-off negative fiscal effect in the first years of EU membership. A similar negative one-one-off effect stems from
Table 3. Net fiscal effects of EU transfers in 2004-2006 (% of GDP), annual average
Item CZ EE HU PL SL LT LV SK
Net fiscal effects of EU transfer flows -0.13 1.02 -0.06 0.45 -0.04 1.58 1.75 0.33
Membership contribution -1.12 -1.05 -1.06 -1.12 -1.04 -1.06 -1.04 -1.14
Budgetary compensation 0.33 0.1 0.1 0.25 0.31 0.1 0.1 0.1
Structural Fund transfers 0.33 0.79 0.44 0.67 0.16 0.87 1.06 0.65
Cohesion Fund transfers 0.08 0.28 0.10 0.15 0.05 0.26 0.41 0.14
‘Internal actions’ and additional expenditures 0.11 0.47 0.18 0.2 0.24 0.78 0.48 0.27
Rural development under the CAP 0.15 0.42 0.17 0.3 0.23 0.63 0.74 0.3
Source: EC (2002), AMECO database, own calculations. The net gain on EU transfers will look different if EU funds are not fully absorbed. (Antczak, 2003)
the mechanism of direct CAP payments to farmers. National budgets must pre-finance these payments and can claim reimbursement no earlier than the following year.
The remaining pre-accession assistance transfers are excluded from our analysis because they have been mostly directed to the private sector and their overall size has been very limited (0.4% of GDP on average).
3.2. Accession-related expenditures
The costs of EU accession also originate from the adoption of some specific acquis communautaire, particularly in fiscally sensitive areas such as environmental protection, infrastructure, transport, public administration, social policy, border controls, etc. Those accession-related expenditures that have never previously been financed from the budget can only very minimally be covered by EU transfers.
The fiscal cost of compliance with the acquisis especially heavy in the areas of environmental protection (in particular, rehabilitation of polluted industrial areas, water and air treatment and waste management) and transport infrastructure (road construction and upgrading of railroads). A significant part of these costs can be financed from SF and CF, but total annual inflows of SF and CF, estimated at a level ranging from 0.2% of GDP in Slovenia to 1.5% of GDP in Latvia, are obviously not sufficient to cope with this challenge. Thus, the additional budget expenditures for infrastructure projects may require up to 1.5% of GDP annually (above SF and CF transfers)6.
The second important accession-related cost (ca. 1% of GDP) is associated with public administration reform, which can be partially offset by transfers from the additional expenditure category. On the other hand, the obligation to harmonise indirect taxes may bring additional revenues to national budgets of up to 0.5% of GDP, mainly from a broadening of the VAT base, higher excise duties and eco-taxes.
The launching of support for EU agriculture will reduce or eliminate some existing farm subsidies. Clearly, the magnitude of the fiscal effects of this will primarily be determined by the overall size of the agricultural sector in each country (very high in Poland and low in Estonia). The phasing out of farm subsidies, along with non-farm subsidies as a result of adopting acquis in the area of state aid and competition, may lead to significant budgetary savings of around 1% of GDP or more in some NMS7. However, there is a lot of uncertainty about the timing and scope of these reductions in individual NMS, which is closely connected with the lack of political will to carry out fundamental fiscal adjustment (see
Section 2).
Accession also brought with it the removal of customs duties on imports from EU members and the adoption of a common external tariff on non-EU imports. However, in low-tariff countries (for example Estonia) this will result in a small gain. Depending on country tariff rates prior to accession, realignment of customs duties will result in -0.5% of GDP in Hungary, Poland, the Czech Republic and Slovenia and +0.5% of GDP in Estonia.
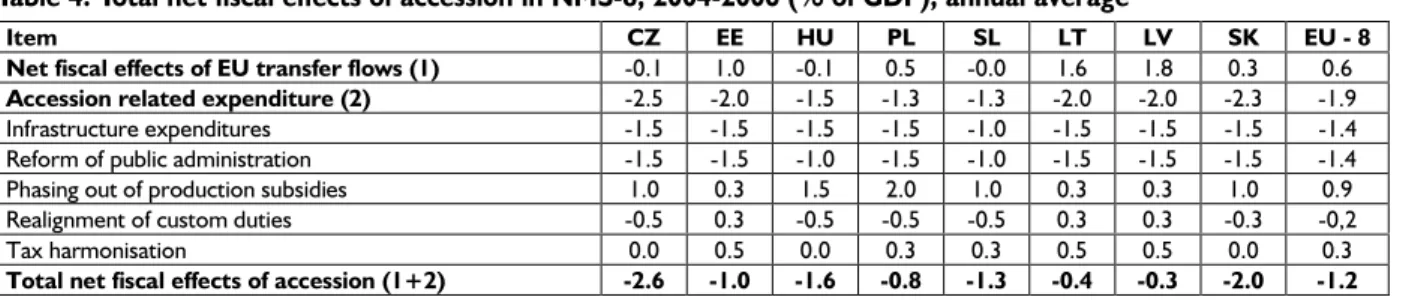
The net fiscal effect of accession-related expenditures is stronger that the net fiscal effect of EU transfers presented in Table 3and negative for all NMS. It ranges from -1.3% GDP in Poland and Slovenia to -2% of GDP in Baltic countries and -2.6% of GDP in the Czech Republic (see Table 4).
6
On the basis of the World Bank estimates from 1997 and 1999 for Estonia, Hungary and Poland.
7
Kopits and Szekely (2002) estimate that the phasing out of production subsidies in Poland (mostly those directed to farmers) will decrease budget expenditures by 2% of GDP.
On balance, our estimate is that accession has an unfavorable net effect on the general government balance in all NMS. The specific results depend on EU transfer flows and estimated costs of required reforms and public investment programmes in individual countries, which in turn depends on their level of overall development. Baltic countries and Poland would appear to face the smallest negative fiscal consequences of EU accession. In addition, the fiscal balance of the Baltic countries on the day of accession was the best of all the NMS (see Section 2), which makes the additional accession-related fiscal burden easier to accommodate. Poland is in a much worse situation in this respect and even moderate negative fiscal impact of accession (0.8% of GDP) may dramatically worsen the country’s fiscal position.
3.3. Underlying assumptions
It is worth remembering, however, that our estimates are based on various implicit and somewhat arbitrary assumptions, which may be the subject of debate. The key methodological questions relate to:
1. The size of additional infrastructure and administration reform related expenditures, which are not explicitly set by the Accession Treaty. This is based on expert estimates, mostly from the World Bank8. Although the NMS must meet certain environmental, infrastructure and other costly standards within a pre-determined transitory period, this obligation relates to a longer time horizon than our projection (which covers 2004-2006). This means that individual NMS have some room for maneuver in terms of expenditure timing, choice of investment strategy, costs of concrete projects, involvement of private investors, etc. The estimates of additional investment and administrative spending presented in Table 4 can be considered as their upper limit. However, the same can be said about the third item, i.e. phasing out of production subsidies, which represents the opposite in terms of its influence on fiscal balance.
2. Assumption of ‘unchanged policies.’ Apart from the phasing out of production subsidies this means that no other budgetary re-composition is expected to take place. However, taking into consideration the deep-seated inertia in the sphere of fiscal policy in most NMS and their unwillingness to carry out serious expenditure adjustments, such an assumption seems to be reasonable in the short- to medium-term.
In the longer run NMS’ increased deficits are likely to be partly compensated by the favorable indirect fiscal effects of accession. Long-term gains may originate from the new wave of foreign direct investment,
Table 4. Total net fiscal effects of accession in NMS-8, 2004-2006 (% of GDP), annual average
Item CZ EE HU PL SL LT LV SK EU - 8
Net fiscal effects of EU transfer flows (1) -0.1 1.0 -0.1 0.5 -0.0 1.6 1.8 0.3 0.6
Accession related expenditure (2) -2.5 -2.0 -1.5 -1.3 -1.3 -2.0 -2.0 -2.3 -1.9
Infrastructure expenditures -1.5 -1.5 -1.5 -1.5 -1.0 -1.5 -1.5 -1.5 -1.4
Reform of public administration -1.5 -1.5 -1.0 -1.5 -1.0 -1.5 -1.5 -1.5 -1.4
Phasing out of production subsidies 1.0 0.3 1.5 2.0 1.0 0.3 0.3 1.0 0.9
Realignment of custom duties -0.5 0.3 -0.5 -0.5 -0.5 0.3 0.3 -0.3 -0,2
Tax harmonisation 0.0 0.5 0.0 0.3 0.3 0.5 0.5 0.0 0.3
Total net fiscal effects of accession (1+2) -2.6 -1.0 -1.6 -0.8 -1.3 -0.4 -0.3 -2.0 -1.2
Source: EC (2002), AMECO database, own calculations. The net gain on EU transfers will look different if EU funds are not fully absorbed. (Antczak, 2003)
8An alternative approach based on the assumptions that additional expenditures will be equal to SF and CF transfers going to the general
government, plus the required co-financing, and that SF and CF cannot substitute other national expenditure budgets (the principle of ‘additionality’) could lead to much lower estimates of any negative fiscal impact. However, we believe that such an approach underestimates the negative fiscal impact of EU accession.
better infrastructure, decreasing transaction costs of trade, industrial cooperation and new opportunities offered by access to the Single European Market, not to mention the political and security benefits and modernisation of the institutional and legal systems following adoption of the acquis, leading to higher GDP growth rates and higher fiscal revenues. In addition, the EU’s fiscal discipline rules, on the one hand, and prospects of EMU accession on the other, may push the NMS to undertake a more serious reduction of their non-accession related budget expenditures.
4. NMS on the road to EMU
All the NMS are obliged and expected to join the EMU in the coming couple of years. To be eligible to do so they must meet the nominal convergence criteria defined by the Treaty. Even a very superficial analysis shows that two fiscal criteria (a fiscal deficit not exceeding 3% of GDP and a public debt not exceeding 60% of GDP) are the most difficult to fulfill for at least some of the EMU candidates (see
Section 2).
Failure to meet the fiscal criteria established in the Treaty has and will have a number of negative consequences both for the NMS and the entire EU. Firstly, fiscal health itself is an important precondition for overall macroeconomic stability and sustainable economic growth, particularly in less developed economies. Secondly, leaving the NMS out of the Eurozone for a long period of time (in particular for reasons of fiscal laxity) would entail the risk of serious macroeconomic destabilisation inside the EU. Thirdly, the NMS would not be able to enjoy the economic benefits of Eurozone membership, such as price stability, interest rate convergence, elimination of exchange rate risk and would therefor see increased risk of currency crisis, decreasing transaction costs in intra-EU trade, etc.9 Fourthly, it might also have negative political consequences for the entire EU as it would mean the existence of two classes of membership (a kind of core and periphery) in an important sphere of economic integration for a long period of time.
Furthermore, NMS choosing to postpone their EMU entry for reasons of fiscal non-compliance would make meeting the convergence criteria at a later date even more difficult. There would be basically two reasons for such an adverse turn of events: (i) accumulation of additional public debt (or delay in its reduction); (ii) higher interest rates during the ‘waiting’ period. Both would lead to higher interest payments and, eventually, to the necessity of deeper cuts in non-interest expenditures or tax increases.
In order to demonstrate the negative fiscal effects of delaying the nominal convergence and EMU entry date we have conducted a very simplified simulation for NMS-8 (for details see Gorzelak, 2004).
4.1. Simulation model
In our simplified model the current level of debt depends on the debt from the previous period plus the current fiscal balance. The interest rate has an impact on interest payments and any change in the domestic interest rate to foreign interest rate ratio alters the exchange rate. Exchange rate changes determine the domestic currency value of the debt denominated in foreign currency. We also assume that the terms
9A detailed analysis of the costs and benefits of the EMU membership is out of the agenda beyond the scope of this paper. However,
the authors believe that the benefits overweight the costs. For more arguments on the net benefits coming from an of early EMU membership see Rostowski (2002) and Dabrowski (2005).
‘domestic debt’ and ‘debt denominated in domestic currency’ are the same, and that ‘foreign debt’ is equal to ‘foreign currency denominated debt’. Finally, a fiscal deficit increases a domestic debt, while a fiscal surplus reduces the foreign part of a public debt10. The debt and deficit values are shown in relative terms, as a proportion of GDP:
(1)
where D
d= domestic debt (as % of GDP); g = real GDP growth rate; r = interest rate; and B = the
primary fiscal balance (deficit has minus sign; as % of GDP). Similarly, the equation for foreign debt is as follows:
(2)
where: D
f= foreign debt, E = exchange rate; and (1+∆Et) is exchange rate depreciation 11
(E
t/Et-1) and
equals (1+r
t)/(1+rw,t) where rwis the international interest rate. The projection uses, this exact formula,
instead of the simplified uncovered interest parity equation, according to which r = r
w+ ∆E (where
exchange rate gains on interest payments are ignored).
4.2. Detailed assumptions on input data
The projection compares two EMU accession scenarios. They differ in EMU accession date, which is 2007 in the fast path scenario (which would mean the Maastrich convergence criteria would have to be met in 2005), and 2012 (2010, respectively). In the case of countries that are not in danger of breaking any of these criteria, the public debt to GDP ratio is assumed not to be in a worse position than it was prior to the starting date of the projection.
We chose two alternative exogenous paths of average real GDP growth in the NMS, 5% and 2% annually, throughout the entire projection period. Therefore, the simulation for each country is performed twice, under the fast and slow growth assumptions (see below)12.
It is assumed that the fastest possible path of (primary) deficit reduction would be 1% of GDP annually. The more heavily indebted countries would have to run overall budget surpluses. However, we assume that the maximum level of the overall (including interest payments) fiscal surplus cannot be greater than 2% of GDP and that the overall fiscal balance cannot be in surplus (i.e. the primary surplus must not be greater than interest payments) after the assessment year (2005 vs. 2010), or after the debt to GDP ratio reaches its target value. If this occurs, the debt reduction policy would be terminated. The last assumption allows for comparison of the fiscal results of different accession scenarios. Generally, the assumptions limiting the speed of fiscal adjustments and maximum level of fiscal surplus reflect the political realities in the NMS. ) + + + = − t t t f t f (1 ∆E g r D D 1 1 1 , , t t d t d B g r D D − + + = − 1 1 1 , ,
10This approach has been adopted to simplify the projection exercise. It is based on the observation that the NMS try to increase the
share of the domestic-currency denominated component of their public debt.
11Appreciation, if the domestic interest rate is lower than international interest rate.
12We are aware that these are the most disputable assumptions in our projection. However, ‘endogeniszation’ of the real GDP growth
path, especially taking into consideration various possible dates of EMU accession, would require a much more complex and sophisticated forecasting model and would evidently go beyond the scope of this paper.
The interest rate on public debt is the same for both domestic and foreign debt. It changes according to the linear function, that allows the target value to be reached one year before the accession date. This means that convergence ends when it is obvious that EMU accession will take place. The international interest rate stays at a constant level during the whole projection period, and equals 4% p.a. This is also the target value for the interest rate on the domestic public debt. The proportion of the foreign and domestic interest rates determines the exchange rate changes.
We used two IMF databases: Government Finance Statistics (GFS) for the fiscal deficit, domestic and foreign debt and interest payments, and the International Financial Statistics (IFS) for GDP and interest rates13. The debt and deficit ratios are calculated using annual nominal values, while GDP growth is in real terms. The primary fiscal deficit used in the projection was obtained by adding interest payments to the overall fiscal balance, both as shown in GFS.
The interest rate used to estimate both the interest payments and exchange rate path is defined as the average of lending and deposit interest rates published by the IMF. Such a choice has been determined by the lack of appropriate statistical data that could be used for projection purposes (and comparable for all the countries in question). There are two main advantages of this simplified method: (i) it is based on available data, and (ii) it produces results close to the actual interest payments, since it can be checked for the years prior to the projection period.
4.3. Simulation results: the fast growth assumption
We start our simulation exercise with the scenario assuming a fast pace of growth (5% p.a.) and a later accession date (2012). The primary deficit, the real GDP growth rate and interest rates are the input data; domestic and foreign parts of the public debt are the model outcome. The deficit is added to the domestic debt and the foreign part is enlarged due to foreign exchange losses. Both parts of the debt are increased by interest payments. The goal is to have the debt to GDP ratio in the ‘assessment’ year (2010 in this scenario) not greater than prior to the projection period14.
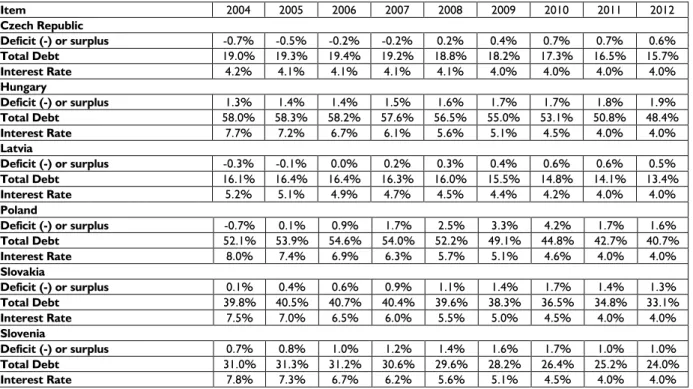
In the case of Poland (see Table 5), the goal of debt reduction to the pre-projection level (44.8% of GDP) may be reached in 2010 at the cost of a relatively fast primary deficit reduction path (0.8% of GDP p.a.). The total fiscal balance reaches the maximum allowed level, +2% of the GDP, in 2010. The debt ratio rises to 2006 due to primary deficits, interest payments and foreign exchange losses on the foreign part of the debt. The substantial surpluses that are achieved later, together with a decrease in the interest rate level, allow for an acceleration of debt reduction in the following years.
For the far less indebted Czech Republic the target of not exceeding its 2002 level of debt to GDP ratio in 2010 is much easier to achieve: the deficit reduction must follow the modest path of 0.23% percentage points p.a. The country has the advantage of a moderate level of debt at the start of the projection and very low interest rates.
A slightly faster debt reduction path (GDP 0.26% p.a.) would be necessary in Slovakia because it starts out with a debt twice as high as in the Czech Republic and suffers from higher initial interest rates. On the other hand, Slovakia starts the projection period with a primary surplus.
13
The GFS debt figures may differ from IFS numbers. In case of discrepancies, the GFS values were used.
14
Hungary’s debt to GDP ratio at the starting point is similar to that of Poland. However, Hungary’s budget records primary surpluses, which substantially accelerates debt reduction and makes it possible to keep the 2010 debt at the original level with an increase in the primary surplus of only 0.08% of GDP p.a.
Similarly to Hungary, Slovenia enjoys a primary surplus at the beginning of the projection period. This allows for only a moderate increase in the primary fiscal balance of 0.18% of GDP p.a.
The situation in the Baltic countries is similar, with all three becoming independent with zero debt. They also enjoy low interest rates. The figures for Latvia are presented in Table 5, the results for Lithuania and
Table 5. Fast growth (5%), late accession (2012) scenario.
Item 2004 2005 2006 2007 2008 2009 2010 2011 2012 Czech Republic Deficit (-) or surplus -0.7% -0.5% -0.2% -0.2% 0.2% 0.4% 0.7% 0.7% 0.6% Total Debt 19.0% 19.3% 19.4% 19.2% 18.8% 18.2% 17.3% 16.5% 15.7% Interest Rate 4.2% 4.1% 4.1% 4.1% 4.1% 4.0% 4.0% 4.0% 4.0% Hungary Deficit (-) or surplus 1.3% 1.4% 1.4% 1.5% 1.6% 1.7% 1.7% 1.8% 1.9% Total Debt 58.0% 58.3% 58.2% 57.6% 56.5% 55.0% 53.1% 50.8% 48.4% Interest Rate 7.7% 7.2% 6.7% 6.1% 5.6% 5.1% 4.5% 4.0% 4.0% Latvia Deficit (-) or surplus -0.3% -0.1% 0.0% 0.2% 0.3% 0.4% 0.6% 0.6% 0.5% Total Debt 16.1% 16.4% 16.4% 16.3% 16.0% 15.5% 14.8% 14.1% 13.4% Interest Rate 5.2% 5.1% 4.9% 4.7% 4.5% 4.4% 4.2% 4.0% 4.0% Poland Deficit (-) or surplus -0.7% 0.1% 0.9% 1.7% 2.5% 3.3% 4.2% 1.7% 1.6% Total Debt 52.1% 53.9% 54.6% 54.0% 52.2% 49.1% 44.8% 42.7% 40.7% Interest Rate 8.0% 7.4% 6.9% 6.3% 5.7% 5.1% 4.6% 4.0% 4.0% Slovakia Deficit (-) or surplus 0.1% 0.4% 0.6% 0.9% 1.1% 1.4% 1.7% 1.4% 1.3% Total Debt 39.8% 40.5% 40.7% 40.4% 39.6% 38.3% 36.5% 34.8% 33.1% Interest Rate 7.5% 7.0% 6.5% 6.0% 5.5% 5.0% 4.5% 4.0% 4.0% Slovenia Deficit (-) or surplus 0.7% 0.8% 1.0% 1.2% 1.4% 1.6% 1.7% 1.0% 1.0% Total Debt 31.0% 31.3% 31.2% 30.6% 29.6% 28.2% 26.4% 25.2% 24.0% Interest Rate 7.8% 7.3% 6.7% 6.2% 5.6% 5.1% 4.5% 4.0% 4.0%
Source: own calculations based on IMF data.
Table 6. Fast growth (5%), early accession (2007) scenario.
Item 2004 2005 2006 2007 2008 2009 2010 2011 2012 Czech Republic Deficit (-) or surplus 0.0% 0.9% 0.7% 0.6% 0.6% 0.6% 0.5% 0.5% 0.5% Total Debt 18.3% 17.3% 16.4% 15.6% 14.9% 14.2% 13.5% 12.9% 12.3% Interest Rate 4.1% 4.1% 4.0% 4.0% 4.0% 4.0% 4.0% 4.0% 4.0% Hungary Deficit (-) or surplus 1.5% 1.8% 2.1% 2.0% 1.9% 1.8% 1.7% 1.7% 1.6% Total Debt 57.1% 55.7% 53.1% 50.6% 48.2% 45.9% 43.7% 41.6% 39.6% Interest Rate 6.8% 5.4% 4.0% 4.0% 4.0% 4.0% 4.0% 4.0% 4.0% Latvia Deficit (-) or surplus 0.2% 0.8% 0.6% 0.5% 0.5% 0.5% 0.5% 0.4% 0.4% Total Debt 15.6% 14.8% 14.1% 13.4% 12.8% 12.2% 11.6% 11.0% 10.5% Interest Rate 4.9% 4.5% 4.0% 4.0% 4.0% 4.0% 4.0% 4.0% 4.0% Poland Deficit (-) or surplus -0.5% 0.5% 1.5% 2.5% 1.1% 1.7% 1.6% 1.6% 1.5% Total Debt 51.3% 51.4% 49.3% 46.4% 44.8% 42.7% 40.7% 38.7% 36.9% Interest Rate 7.1% 5.5% 4.0% 4.0% 4.0% 4.0% 4.0% 4.0% 4.0% Slovakia Deficit (-) or surplus 0.4% 1.0% 1.5% 1.4% 1.3% 1.3% 1.2% 1.1% 1.1% Total Debt 39.1% 38.4% 36.5% 34.8% 33.1% 31.5% 30.0% 28.6% 27.2% Interest Rate 6.7% 5.3% 4.0% 4.0% 4.0% 4.0% 4.0% 4.0% 4.0% Slovenia Deficit (-) or surplus 1.1% 1.6% 2.2% 1.0% 1.0% 0.9% 0.9% 0.8% 0.8% Total Debt 30.2% 28.9% 26.4% 25.1% 23.9% 22.8% 21.7% 20.7% 19.7% Interest Rate 6.9% 5.5% 4.0% 4.0% 4.0% 4.0% 4.0% 4.0% 4.0%
Estonia will be discussed later. In Latvia cutting the primary deficit by 0.14% of GDP p.a. allows for a return to the starting debt/GDP ratio level in 2010. This is possible due to a moderate debt level, small primary deficit and low interest rates at the beginning of the projection period.
The second scenario assumes fast GDP growth (5% annually) and early EMU accession (in 2007), which means the debt target must be fulfilled as early as 2005.
In the case of Poland the projection goal cannot be achieved even after adopting the fastest possible deficit reduction path of 1% of GDP p.a. (Table 6). In 2005, the debt to GDP ratio exceeds that of 2002 and the target value is achieved only in 2008. This date is, however, acceptable since Poland does not even come close to the maximum allowed level (60%) of debt to GDP ratio.
The Czech Republic must cut its deficit in 2004-2005 by a substantial 0.9% of GDP p.a., if the goal of having the assumed debt/GDP ratio is to be obtained in 2005.
In spite of adopting the fastest available path of adjustment, 1% of GDP p.a., the Slovak debt in 2005 would still exceed the starting level. Moving the target date to 2006 allows for a fulfilling of the debt/GDP ratio requirements at the lower cost of an annual increase in the primary surplus by 0.56% of GDP – and this path has been used in the projection.
Hungary would miss the target debt to GDP ratio in 2005 by 0.6% of GDP, despite the fastest acceptable primary surplus growth. Adopting the moderate path of 0.3% of GDP p.a. allows for a reaching the desired debt level just one year later, as is the case of Slovakia.
The situation for Slovenia is similar – reaching the targeted debt to GDP ratio at the end of 2005 is not possible, but achieving this goal in 2006 requires a moderate adjustment effort of 0.6% of GDP p.a. As in the first scenario, Latvia has no problems at all.
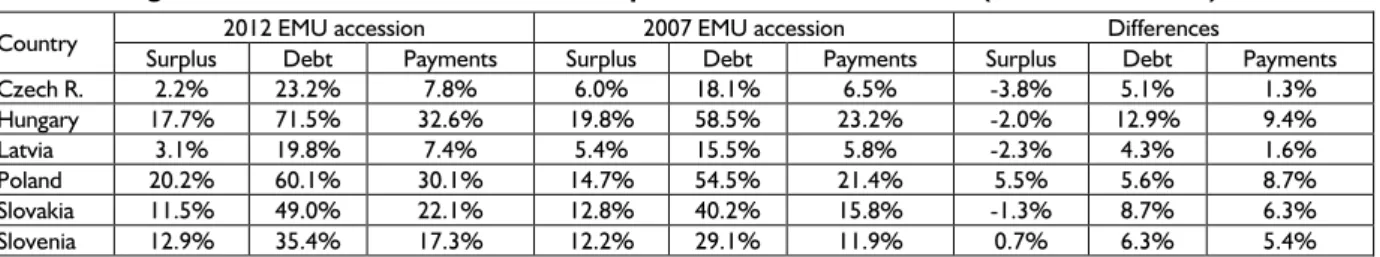
Table 7 compares the simulation results of the two above outlined scenarios, using three synthetic indicators. Statistics labeled ‘surplus’ add up the annual primary balances over the whole projection period (2004-2012), corrected by real GDP growth, in order to present it as a % of 2004 GDP. ‘Debt’ means the 2012 value of the total debt burden in relation to the 2004 GDP level (real numbers)15. ‘Payments’ describe the real interest payments in the period 2004-2012 as a % of 2004 GDP. As with the surplus, this is the sum of annual interest payments as a proportion of current GDP values, corrected by the real GDP growth. All three measures, although very simplified and static16, allow for comparison of scenarios results.
The results differ between countries, but all appear to benefit from earlier EMU accession. Under the second scenario the Czech Republic must bear the additional social cost of improving its total primary balances during the projection period by 3.8% in 2004, as compared to the late accession variant. However, fast accession would result in a reduction of the 2004-2012 interest payments by 1.3% of 2004 GDP and public debt at the end of the projection period would be lower by 5.1% of 2004 GDP.
15
This technique of comparing the size of debt accumulation in two scenarios gives the numeric results differing from those actually predicted in our simulation.
16
None of these measures were discounted by the interest rate values.
Table 7. Fast growth, different accession dates – comparison of simulation results (in % of 2004 GDP)
2012 EMU accession 2007 EMU accession Differences
Country
Surplus Debt Payments Surplus Debt Payments Surplus Debt Payments
Czech R. 2.2% 23.2% 7.8% 6.0% 18.1% 6.5% -3.8% 5.1% 1.3% Hungary 17.7% 71.5% 32.6% 19.8% 58.5% 23.2% -2.0% 12.9% 9.4% Latvia 3.1% 19.8% 7.4% 5.4% 15.5% 5.8% -2.3% 4.3% 1.6% Poland 20.2% 60.1% 30.1% 14.7% 54.5% 21.4% 5.5% 5.6% 8.7% Slovakia 11.5% 49.0% 22.1% 12.8% 40.2% 15.8% -1.3% 8.7% 6.3% Slovenia 12.9% 35.4% 17.3% 12.2% 29.1% 11.9% 0.7% 6.3% 5.4%
For Poland, faster EMU accession means not only lower cumulative interest payments and final debt but also a smaller average burden of fiscal adjustment. All three kinds of gains stem from the high initial interest rates and early fiscal adjustment.
Hungary is in a better position, since it does not suffer from primary deficits at the projection start. Therefore, there is no painful ‘getting-out-of-deficit’ process. Its cumulative fiscal adjustment efforts must be greater in the early accession variant (by 2.0% of 2004 GDP, totally). This is, however, highly rewarded by an astonishing reduction of the debt level (12.9% of 2004 GDP) and interest payments totalling 9.4% of 2004 GDP.
Due to its initial primary fiscal surpluses and moderate interest rate level, Slovenia gains in all three categories. A similar conclusion may be drawn for Slovakia: although it is not in as good a position in terms of ‘surplus’ statistics, it also benefits from good initial fiscal balance and faster surplus increase in the first years of the 2007 accession scenario. The results for Latvia may be described analogously to those for the Czech Republic.
4.4. Simulation results: the slow growth assumption
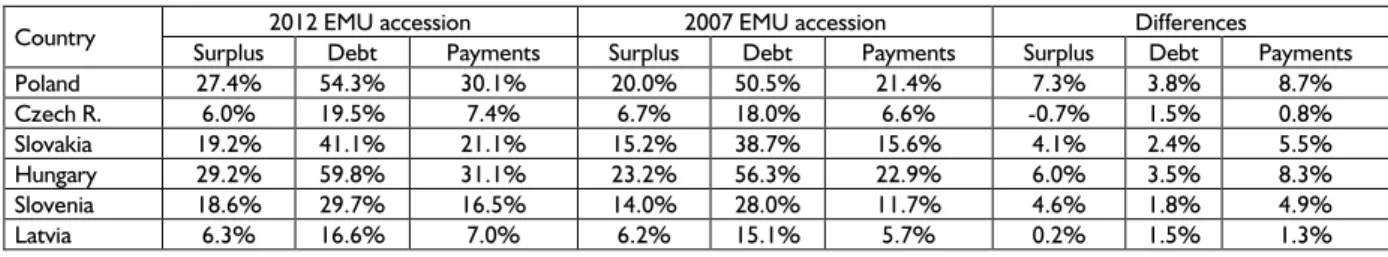
Table 8presents the results of simulation performed under the slow growth (2%) and late accession (2012) assumptions, whileTable 9presents them under the slow growth (2%) and early accession (2007) scenario.
The consequences of slow growth assumptions for the simulation results are relatively predictable: slower reduction of the debt/GDP ratio and higher budget surpluses required to control the relative debt level. Sometimes – as in case of Poland - even the fastest path allowed in the projection does not provide enough progress. In the late accession scenario for Poland the targeted debt level will remain substantially
Table 8. Slow growth, late accession scenario.
Item 2004 2005 2006 2007 2008 2009 2010 2011 2012 Czech Republic Deficit (-) or surplus -0.5% -0.2% 0.2% 0.6% 0.9% 1.3% 1.7% 0.7% 0.7% Total Debt 19.4% 20.0% 20.2% 20.5% 19.5% 18.6% 17.3% 17.0% 16.6% Interest Rate 4.2% 4.1% 4.1% 4.1% 4.1% 4.0% 4.0% 4.0% 4.0% Hungary Deficit (-) or surplus 1.7% 2.3% 2.8% 3.3% 3.8% 4.4% 4.5% 2.1% 2.0% Total Debt 59.2% 60.5% 60.9% 60.3% 58.7% 56.2% 53.1% 52.1% 51.1% Interest Rate 7.7% 7.2% 6.7% 6.1% 5.6% 5.1% 4.5% 4.0% 4.0% Latvia Deficit (-) or surplus -0.1% 0.1% 0.4% 0.6% 0.9% 1.2% 1.4% 0.6% 0.6% Total Debt 16.5% 17.0% 17.2% 17.0% 16.6% 15.8% 14.8% 14.5% 14.2% Interest Rate 5.2% 5.1% 4.9% 4.7% 4.5% 4.4% 4.2% 4.0% 4.0% Poland Deficit (-) or surplus -0.5% 0.5% 1.5% 2.5% 3.5% 4.5% 4.5% 4.0% 3.9% Total Debt 53.4% 56.5% 58.3% 58.8% 57.7% 55.2% 52.2% 49.2% 46.2% Interest Rate 8.0% 7.4% 6.9% 6.3% 5.7% 5.1% 4.6% 4.0% 4.0% Slovakia Deficit (-) or surplus 0.4% 1.0% 1.6% 2.1% 2.7% 3.2% 3.7% 1.4% 1.4% Total Debt 40.7% 42.0% 42.6% 42.3% 41.2% 39.2% 36.5% 35.8% 35.1% Interest Rate 7.5% 7.0% 6.5% 6.0% 5.5% 5.0% 4.5% 4.0% 4.0% Slovenia Deficit (-) or surplus 0.9% 1.3% 1.7% 2.2% 2.6% 3.0% 3.3% 1.0% 1.0% Total Debt 31.7% 32.5% 32.6% 32.1% 30.9% 29.0% 26.4% 25.9% 25.4% Interest Rate 7.8% 7.3% 6.7% 6.2% 5.6% 5.1% 4.5% 4.0% 4.0%
exceeded at the assessment date (2010). Moreover, it will come close to the 60% limit (over 58% in 2006-2007). Reduction of interest rates in the early accession scenario allows the projection goal to be obtained, but not before 2010.
The Czech Republic and Slovakia do manage to achieve the desired debt level on time in the late accession scenario. This requires a primary surplus increase of 0.4% and 0.6% of GDP p.a, respectively. The early accession assumption calls for the fastest surplus increase, but there are still some delays in reaching the debt target: one year for the Czech Republic and two years for Slovakia. Hungary follows the same path, with an annual surplus increase of 0.5% of GDP in the late scenario and a two-year delay in the early accession one. For Slovenia the numbers are: an annual surplus increase of 0.4% of GDP in late accession variant and a two-year delay in case of 2007 EMU accession. Latvia is the only country that manages to keep the debt to GDP ratio at the pre-projection level in the early accession scenario, by increasing its surplus by 0.9% of GDP in 2004-2005 (and by 0.3% in the late accession scenario).
Table 10 compares results of the late and early accession simulations, as performed in the previous subsection.
The results are very similar to those in Table 7. This indicates that the pace of economic growth is not the key factor in terms of the benefits afforded by early EMU entry. Of course, a higher growth rate helps to reduce the real debt to GDP ratio (by definition) and leaves countries in a better situation at the end of
Table 9. Slow growth, early accession scenario.
Item 2004 2005 2006 2007 2008 2009 2010 2011 2012 Czech Republic Deficit (-) or surplus 0.1% 1.1% 1.1% 0.7% 0.7% 0.7% 0.6% 0.6% 0.6% Total Debt 18.7% 18.0% 17.3% 16.9% 16.6% 16.3% 16.0% 15.7% 15.3% Interest Rate 4.1% 4.1% 4.0% 4.0% 4.0% 4.0% 4.0% 4.0% 4.0% Hungary Deficit (-) or surplus 2.2% 3.2% 4.2% 2.0% 2.1% 2.0% 2.0% 2.0% 1.9% Total Debt 58.1% 57.1% 54.0% 53.1% 52.0% 51.0% 50.0% 49.0% 48.1% Interest Rate 6.8% 5.4% 4.0% 4.0% 4.0% 4.0% 4.0% 4.0% 4.0% Latvia Deficit (-) or surplus 0.5% 1.4% 0.6% 0.6% 0.6% 0.5% 0.5% 0.5% 0.5% Total Debt 15.8% 14.8% 14.5% 14.2% 14.0% 13.7% 13.4% 13.1% 12.9% Interest Rate 4.9% 4.5% 4.0% 4.0% 4.0% 4.0% 4.0% 4.0% 4.0% Poland Deficit (-) or surplus -0.5% 0.5% 1.5% 2.5% 3.5% 4.0% 3.1% 1.8% 1.7% Total Debt 52.8% 54.4% 53.9% 52.5% 50.0% 47.0% 44.8% 43.9% 43.0% Interest Rate 7.1% 5.5% 4.0% 4.0% 4.0% 4.0% 4.0% 4.0% 4.0% Slovakia Deficit (-) or surplus 0.9% 1.9% 2.9% 1.6% 1.4% 1.4% 1.4% 1.3% 1.3% Total Debt 39.8% 39.4% 37.3% 36.5% 35.8% 35.1% 34.4% 33.7% 33.0% Interest Rate 6.7% 5.3% 4.0% 4.0% 4.0% 4.0% 4.0% 4.0% 4.0% Slovenia Deficit (-) or surplus 1.5% 2.5% 3.5% 0.7% 1.0% 1.0% 1.0% 1.0% 1.0% Total Debt 30.7% 29.4% 26.5% 26.4% 25.8% 25.3% 24.8% 24.4% 23.9% Interest Rate 6.9% 5.5% 4.0% 4.0% 4.0% 4.0% 4.0% 4.0% 4.0%
Source: own calculations based on IMF data.
Table 10. Slow growth, different accession dates – comparison of simulation results (in % of 2004 GDP)
2012 EMU accession 2007 EMU accession Differences
Country
Surplus Debt Payments Surplus Debt Payments Surplus Debt Payments
Poland 27.4% 54.3% 30.1% 20.0% 50.5% 21.4% 7.3% 3.8% 8.7% Czech R. 6.0% 19.5% 7.4% 6.7% 18.0% 6.6% -0.7% 1.5% 0.8% Slovakia 19.2% 41.1% 21.1% 15.2% 38.7% 15.6% 4.1% 2.4% 5.5% Hungary 29.2% 59.8% 31.1% 23.2% 56.3% 22.9% 6.0% 3.5% 8.3% Slovenia 18.6% 29.7% 16.5% 14.0% 28.0% 11.7% 4.6% 1.8% 4.9% Latvia 6.3% 16.6% 7.0% 6.2% 15.1% 5.7% 0.2% 1.5% 1.3%
simulation period, as compared to the slow growth assumption. However, it does not fundamentally affect the gains coming from faster accession.
4.5. The case of Estonia and Lithuania
Lithuania and Estonia, which have not been covered by the above simulation, enjoy a relatively comfortable macroeconomic situation. Estonia’s interest rates are already very close to the projection target value (4.7 in 2002 vs. 4.0 in the projection) and its public debt is virtually non-existent (~3% of GDP). Lithuania does have a moderate (~20% of GDP) level of public debt, but other indicators produce an excellent picture. Interest rates are 4.2% (almost as low as the 4.0% target assumed in our simulation) and the budget records primary surpluses. Since for both countries the high growth assumption is a realistic one, the GDP growth rate would exceed the interest rate in every year covered by the projection.
The current macroeconomic indicators are so good that even serious delay in EMU accession would not mean substantial costs. The reason is very simple – in fact both Estonia and Lithuania are already de facto in the Eurozone, with Euro-denominated currency boards.
4.6. Conclusions from the projection
For all the countries analyzed in our projection, choosing the faster EMU accession scenario would bring substantial benefits. These effects are greater, the worse a country’s initial macroeconomic conditions are. That is say: the higher the interest rate, the greater the debt ratio, and the larger the primary deficit. The pace of GDP growth does not matter in terms of gains offered by faster accession. On the other hand, a country does not have to be in a bad situation in order to benefit from the faster EMU accession scenario: even the Czech Republic and Latvia (both with moderate debt, low levels of interest rates and small deficits) would benefit from not delaying their EMU accession date.
5. The long-term fiscal challenges in the EU-25/27
In a longer run both the OMS and NMS may face the same unpleasant fiscal arithmetic stemming from slow rates of growth and unfavorable demographic trends.
A slow pace of economic growth makes even a small deficit dangerous from the point of view of long-term fiscal sustainability (public debt to GDP dynamics), which is demonstrated in our fiscal projection in Section 4. However, slow growth does not threaten all EU members, especially the NMS, with many in fact recording rather impressive GDP dynamics. Furthermore, this kind of risk can be potentially addressed through microeconomic reforms aiming to increase the competitiveness of the European economy (subject of the Lisbon agenda).
Unfavorable demographic trends constitute a common challenge to the entire EU-25/27 and a number of other nations in Europe (such as Russia, Ukraine, Belarus, Moldova and Serbia). They will lead unavoidably to a worsening of the dependency ratio and an increasing pension and health spending, other
things being equal (see Gros et al., 2004). Unless adequately addressed in time it may cause a serious fiscal crisis in the next twenty or thirty years. According to Gros (2004), aging will lead (ceteris paribus) to additional expenditures of 3-5 % of GDP on average for Eurozone member countries. In the case of the NMS, where the expected demographic crisis looks more severe, they may account even for 4-6 % of GDP.
One set of potential remedies may include increasing the formal and effective retirement age, decreasing the replacement rate (i.e. the ratio between the average public pension benefit and the average wage), the elimination of pension privileges for some sectors and professional groups (mostly in the public sector), more active immigration policies and cutting non-pension and non-health public expenditures. None of these measures are politically easy to implement.
6. Do EU fiscal surveillance rules need modification?
The EU’s fiscal surveillance rules have become the subject of heated economic and political debate during the last couple of years. It seems that the main cause of the controversy lies in the fact that an increasing number of member countries have failed or are about to fail to meet the numeric fiscal criteria set out by the Treaty and the SGP. This goes for both the OMS and NMS.
There have been many arguments raised against the current EU fiscal discipline rules. The most important and frequent refer to:
1. The upper limit on fiscal deficits (3% of GDP) does not leave room for an active countercyclical fiscal policy during recession or growth slowdown and does not allow the automatic fiscal stabilisers to work.
The main weakness of this argument is that it disregards the SGP provision obliging MS to achieve medium-term budgetary positions close to balance or in surplus. The current problems of some EU members in meeting their fiscal deficit requirements originate from their fiscal laxity in the years of higher economic growth (1999-2001 in the case of the Eurozone; see Gros, Mayer & Ubide, 2004). An additional counterargument relates to doubts regarding the short-term effects of fiscal policy. So-called ‘non-Keynesian’ effects can be expected in countries recording high deficits and public debts (see Siwinska & Bujak, 2003).
2. The 3% deficit limit neglects public investment needs. Higher investment (and higher deficits) today can contribute to higher rates of economic growth in the future, which make repaying the debt and lowering the deficit to GDP ratio much easier.
The main problem with this argument is that it assumes a substantial positive influence of additional public investment on economic growth and budget revenues. This need not be true. Growth may not accelerate and interest rates may increase as a result of higher public sector borrowing, causing debt dynamics to get out of control. Economic history provides many examples of misdirected and ineffective public investment programmes.
In addition, governments have little incentive to worry about the future solvency of their successors. Their current political needs (for example, forthcoming elections) may push them to over-investment, i.e. into the same kind of fiscal irresponsibility as occurs in the case of other public expenditures. 3. Inconsistency between the fiscal deficit and public debt requirements and the greater importance of
GDP ratio, while in some cases deficits higher than 3% of GDP may not deteriorate the debt-to-GDP ratio. This depends on a country’s average growth rate, inflation and interest rate (see debt equation in Section 4).
While we are sympathetic to ascribing the debt criterion (and particularly the changes in debt-to-GDP ratio) greater importance in the process of monitoring the fiscal positions of MS, we are against abandoning or relaxing the deficit criterion (because of the dramatic fiscal challenges connected with population aging - see Section 5). On the contrary, the SGP requirement of medium term budget balance and surplus should be given priority and in the case of countries that have low average growth rates the maximum deficit permitted should be lower than 3% of GDP.
What needs to be seriously discussed is the enforcement mechanism of the SGP and the Treaty’s fiscal requirements, although theoretically backed by financial sanctions, these are not automatic. Each step in the excessive deficit procedure requires qualified majority support in the Council of Ministers. In a situation in which an increasing number of MS face problems meeting the fiscal requirements a coalition of ‘bad boys’ that will block sanctions may become a frequent phenomenon.
At the technical level, the fiscal surveillance mechanism is additionally complicated by the practice of forecasting ex ante a country’s structural (i.e. cyclically adjusted) deficit, which requires one to forecast potential output and other macroeconomic parameters. Experience points to repeated mistakes in forecasting the future growth rates and fiscal positions of individual countries. Furthermore, we do not believe that it is possible to find any formula that would guarantee an unquestionable (and free of political bargaining) prediction for future structural deficits.
To improve the enforcement mechanism Rostowski (2004) suggests tightening fiscal rules at the national level, preferably enshrined in national constitutions (following the example of Poland). Another possibility is to introduce automatic sanctions at the EU level when countries breach the fiscal requirements. This could involve, for example, suspending a country’s voting rights in the ECB GC or on the ECOFIN Council of Ministers.
We believe that: (i) EU fiscal surveillance rules cannot be relaxed; (ii) their effective implementation requires a much better enforcement mechanism based on automatic sanctions; (iii) the NMS do not need different fiscal rules.
7. Summary and conclusions
The NMS entered the EU running structural fiscal deficits. More than half of them (including the biggest ones) breach the Treaty’s actual deficit limits and are already the subject of the excessive deficits procedure. A high rate of economic growth makes the fiscal situation of most NMS reasonably manageable in the short- to medium-term, but the long term fiscal outlook, mostly connected with the consequences of an aging population, is dramatic. The NMS should therefore prepare themselves now to be able to meet this challenge over the next decades (the same goes for the OMS). In addition, the perspective of EMU entry should provide the NMS with a strong incentive to reduce their deficits now because waiting (and postponing both fiscal adjustment and the adoption of the Euro) will only result in higher cumulative fiscal costs. The additional financial burden connected with EU accession cannot serve as an excuse in delaying fiscal consolidation.
In fact, the EMU accession can serve as an important positive incentive for governments and societies to start to impose fiscal order today. This ‘carrot’ will work if the opportunity of a fast EMU accession track is offered for those countries that are able to meet the Maastricht convergence criteria soon. Admission to the ERM-II of the three countries with the best fiscal and macroeconomic performance, i.e. Estonia, Lithuania and Slovenia, in June 2004, has created a positive demonstration effect for other NMS and should be followed by further admissions as the other candidates improve their fiscal situations.
In spite of the growing debate on the relevance of the EU’s fiscal surveillance rules and not excluding the possibility of their limited modification, they should not be relaxed. Frequent breaching of these rules cannot serve as an argument that they are irrelevant from the point of view of safeguarding fiscal prudence and avoiding fiscal ‘free riding’ under the umbrella of monetary union. Growth problems in some OMS and, again, forthcoming population aging across Europe may demand even tighter fiscal rules than those established in the Treaty and SGP.
Any version of fiscal surveillance rules (either current or modified) must be solidly anchored in an effective enforcement mechanism (including automatic sanctions) at the EU and national levels.
References
Antczak, M. (2003), Do Candidate Countries Need a Higher Fiscal Deficit?, CASE – Center for Social and Economic Research, Studies & Analyses, No. 260.
Backe, P. (2002), Fiscal Effects of the EU Membership for Central European and Baltic EU Accession Countries, Focus in Transition, No. 2.
Coricelli, F., and Ercolani V. (2002), Cyclical and Structural Deficits on the Road to Accession: Fiscal Rules for an Enlarged European Union,Centre for Economic Policy Research, Discussion Paper, No. 3672, December.
Dabrowski (2005), A Strategy for EMU Enlargement, CASE – Center for Social and Economic Research, Studies & Analyses, No. 290.
Dabrowski, M., and Rostowski, J., eds. (2001), The Eastern Enlargement of The EU, Kluwer Academic Publishers, Boston/ Dordrecht/ London.
EPI (1997), Fiscal Policy in Transition, Forum Report of the Economic Policy Initiative, No. 3, CEPR & IEWS.
EC (2002), Financial framework for enlargement 2004-2006 (Copenhagen package). Indicative allocation of payment appropriations, Presidency Conclusions, Copenhagen European Council, 12 and 13 December 2002, European Commission,
EC (2004), Economic Forecasts Autumn 2004. European Commission,
http://europa.eu.int/comm/economy_finance/publications/european_economy/2004/ee504en.pdf, EE (2002), Public Finances in EMU – 2002, European Economy, No 3, Brussels
Gorzelak, M. (2004), Fiscal Costs of Delaying the EMU Accession – Medium Term Fiscal Projection for Selected New EU Members, CASE – Center for Social and Economic Research, Studies & Analyses, No. 277.
Gros, D. (2004), The Fiscal Criteria and the New Member Countries?, paper prepared for CEPS/ESI annual conference on ‘EMU enlargement to the East and West’, Budapest, September 24/25.
Gros, D., Mayer T., and Ubide A. (2004), The Nine Lives of the Stability Pact, A Special Report of the CEPS Macroeconomic Policy Group, Center for European Policy Studies, Brussels.
Hallet, M. (2004), Fiscal Effects of Accession in the New Member States, European Commission, Economic Papers, No 203. Kopits, G., Szekely, I. (2002), Fiscal Policy Challenges of EU Accession for the Baltics and Central Europe, in:
Tumpel-Gugerell G. and Mooslechner P., eds.: Structural Challenges for Europe, Cheltenham: Edward Elgar. Natolin European Centre, (2003), Advantages and Costs of Poland’s EU Accession, Warsaw.
Mayhew, A. (2003), The Financial and Budgetary Impact of Enlargement and Accession, Sussex European Institute, SEI Working Paper, No 65, http://www.sussex.ac.uk/Units/SEI/pdfs/wp65.pdf
Polackova-Brixi, H. (2004): Contingent Liabilities in the new Member States, paper prepared for the Workshop on ‘Fiscal Surveillance in EMU: New Issues and Challenges’, Brussels, November 12,
http://europa.eu.int/comm/economy_finance/events/2004/events_brussels_1104_en.htm
Rostowski, J. (2002), When Should Central Europeans Join EMU?, CASE – Center for Social and Economic Research, Studies & Analyses, No. 253.
Rostowski, J. (2004), The Stability and Growth Pact – Essential and Unfeasible, CASE – Center for Social and Economic Research, Studies & Analyses, No. 275.
Siwinska, J., and Bujak, P. (2003), Short-run Macroeconomic Effects of Discretionary Fiscal Policy Changes, CASE – Center for Social and Economic Research, Studies & Analyses, No. 261.