Supporting Information
Terpene Cyclases and Prenyltransferases: Structures and Mechanisms of Action
Chun-Chi Chen1,#, Satish R. Malwal2,#, Xu Han3,#, Weidong Liu1, Lixin Ma1, Chao Zhai1, Longhai Dai1, Jian-Wen Huang1, Alli Shillo2, Janish Desai4, Xianqiang Ma5-7, Yonghui Zhang5-7, Rey-Ting Guo1,* and Eric Oldfield2,*
1State Key Laboratory of Biocatalysis and Enzyme Engineering, Hubei Collaborative Innovation Center for Green Transformation of Bio-resources, Hubei Key Laboratory of Industrial Biotechnology, School of Life Sciences, Hubei University, Wuhan 430062, China 2Department of Chemistry, University of Illinois at Urbana-Champaign, Urbana, IL 61801, USA
3Industrial Enzymes National Engineering Laboratory, Tianjin Institute of Industrial Biotechnology, Chinese Academy of Sciences, Tianjin 300308, China
4Center for Biophysics and Quantitative Biology, University of Illinois at Urbana–Champaign, Urbana, IL 61801, USA
5School of Pharmaceutical Sciences, MOE Key Laboratory of Bioorganic Phosphorus Chemistry and Chemical Biology, Tsinghua University, 100084 Beijing, China
6Joint Graduate Program of Peking-Tsinghua-NIBS, School of Life Sciences, Tsinghua University, 100084 Beijing, China
7Collaborative Innovation Center for Biotherapy, Sichuan University, Chengdu, 610041 Sichuan, China
# These authors contributed equally
Corresponding Authors
*E-mail: [email protected] (R-T. G.)
Table of Contents
Methods S3
Table S1. X-ray crystallographic results. S9
Figure S1. Stereo-views of the X-ray crystallographic structures of sesquisabinene
synthases. S10
Figure S2. Stereo-views of the X-ray crystallographic structures of sesquisabinene
and santalene synthases. S11
Figure S3. Non-conserved residues in SaSES1, 2. S12
Figure S4. Electron density maps of ligands bound to SaSES1, SaSES2. S13
Figure S5. Structure superpositions of DMAPP, GPP and FPP bound to chicken
FPPS. S15
Figure S6. Structures of 20 prenyltransferases and cyclases. S16
Figure S7: Diphosphate release assay of SaSES2 and mutants S24
Figure S8: Mutagenesis results on SaSES2. S25
Methods
Protein expression, purification, crystallization and structure determination.
SaSES1 (GenBank accession number: AIV42939.1) minus the 26 N-terminal amino acids; SaSES2 (GenBank accession number: AIV42940.1) minus the 28 N-terminal amino acids and santalene synthase (GenBank accession number: AGV01243.1) minus the 31 N-terminal amino acids were synthesized by GENE-ray Biotech Co. (Shanghai, China) and were ligated into the pET32a vector.
Expression and purification. pET32a-SaSES1, pET32a-SaSES2 and pET32a-SaSS plasmids were transformed into E. coli BL21(DE3) cells which were grown in LB medium at 37° C to an OD600 ~ 0.8, then induced by 0.6 mM isopropyl--D-thiogalactopyranoside (IPTG) at 16°C for 24 hours. Cells were harvested by centrifugation at 5,000 x g for 15 minutes then re-suspended in lysis buffer containing 25 mM Tris-HCl, pH 7.5, 150 mM NaCl and 20 mM imidazole, followed by disruption with a French Press. Cell debris was removed by centrifugation at 17,000 x g for 1 hour. The supernatant was then applied to a Ni-NTA (nickel nitrilotriacetic acid) column FPLC (fast protein liquid chromatography) system (GE Healthcare). The target proteins eluted at ~80 mM imidazole when using a 20-250 mM imidazole gradient. Proteins were dialyzed against buffer containing 25 mM Tris-HCl, pH 7.5, 150 mM NaCl, and subjected to overnight TEV protease digestion, to remove the 6x His tag. The mixtures were then passed through another Ni-NTA column. Untagged proteins were eluted with 25 mM Tris-HCl, pH 7.5, 150 mM NaCl. The purity of proteins (> 95%) was determined by SDS-PAGE analysis. The purified proteins were concentrated to 10 mg/mL for crystallization screening.
Crystallization, data collection, structure determination and refinement. All crystallization experiments were conducted at 25°C using the sitting-drop vapor-diffusion method in which 1 μL protein containing solution (25 mM Tris-HCl, 150 mM NaCl, pH 7.5; 10 mg/mL) was mixed with 1 μL of reservoir solution in 48-well Cryschem Plates, and equilibrated against 100 μL of the reservoir solution. The optimized crystallization condition for SaSES1 was 0.1 M NaCl, 0.1 M HEPES pH 7.5, 1.5 M ammonium sulfate. Within 3 to 4 days, the crystals reached dimensions suitable for X-ray diffraction. The optimized crystallization condition for SaSES2 (25 mM Tris-HCl, 150 mM NaCl, pH 7.5; 10 mg/mL) was 0.2 M ammonium tartrate, pH 7.0, 18% (w/v) PEG (poly(ethylene glycol)) 3350. The optimized crystallization condition for SaSS (25 mM Tris-HCl, 150 mM NaCl, pH 7.5; 46 mg/mL) was 1.0 M ammonium tartrate pH 7.0. Within 10 days, the crystals reached dimensions suitable for X-ray diffraction.
All of the X-ray diffraction data sets were collected at beam lines BL15A1 and BL13C1 of the National Synchrotron Radiation Research Center (NSRRC), Hsinchu, Taiwan. Crystals were mounted in a cryoloop and soaked with cryoprotectant (SaSES1, 0.1 M NaCl, 0.1 M HEPES pH 7.5, 1.5 M ammonium sulfate, 10% glycerol; SaSES2, 0.2 M ammonium tartrate, pH 7.0, 25% PEG 3350, 10% glycerol; SaSS, 1.0 M ammonium tartrate pH 7.0, 35% glycerol) prior to data collection at 100 K. Structures in complex with FSPP, FpCCl2p, FPP or sabinene were obtained by soaking apo-form crystals with mother liquor containing 5 mM ligand for 3 h prior to data-collection. Diffraction images were processed by using the HKL2000 program1. The crystal structure of SaSES1 was solved by using molecular replacement (MR) with the Phaser program2 from the CCP4 Suite3, using the structure of limonene synthase (PDB ID
code 2ONG, 42% sequence identity with SaSES1) as the search model. Further model building and refinement was carried out by using COOT4 and Refmac55. Prior to structure refinement, 5% randomly selected reflections were set aside for calculating Rfree6 as a monitor of model quality. Subsequent refinements involved incorporating ligands and water molecules at the 1.0 σ map level. Structures of SaSES2 and SaSS were determined by using the MR method with Phaser using the refined SaSES1 structure as the search model. The protein sequence identity of SaSES2 and SaSS against SaSES1 are 87% and 58%, respectively. Structures were aligned using VMD (http://www.ks.uiuc.edu/Research/vmd/) or the PyMOL programand protein structure Figures were prepared by using the PyMOL program7.
FPPS site-directed mutagenesis. The FPPS Q240R mutant was prepared by using a QuikChange site-directed mutagenesis kit in conjunction with the FPPS-expressing plasmid, and the double mutant K200Q/Q240R and K200A/Q240R were prepared by using FPPS Q240R expressing plasmid as a template.
The mutagenic oligonucleotides were synthesized by the Beijing Genomics Institution (BGI) and their sequences were:
5’-GAGATGGGGGAGTTCTTTCGTATTCAGGATGATTACCTT-3’ (Q240R); 5’-AAATCTATTGTCAAGTACCAGACAGCTTTCTACTCCTTC-3’ (K200Q); 5’AAATCTATTGTCAAGTACGCTACAGCTTTCTACTCCTTC-3’ (K200A).
These plasmids were verified by direct sequencing and transformed to E. coli BL21(DE3). Expression of variant proteins were induced by 0.4 mM isopropyl-thiogalactopyranoside (IPTG) at 37 ℃ for 4 h. The target protein was purified by using a Ni-NTA column and then a desalt column (GE Healthcare Life Sciences). The eluted protein was concentrated in buffer
containing 25 mM Tris-HCl, pH 7.5, and 150 mM NaCl and stored at -80 ℃.
SaSQS2 mutants. The plasmids encoding SaSQS2 variants were constructed by using a QuickChange site-directed mutagenesis kit (Agilent Technologies, Santa Clara, CA, USA) following the manufacturer’s instructions with the oligonucleotides listed below. The resulting plasmids were verified by sequencing.
Y409A_F CATAAACCTACCCTGGAAGAAGCTTTGGATAATGCCTTAGTGAGC Y409A_R GCTCACTAAGGCATTATCCAAAGCTTCTTCCAGGGTAGGTTTATG R132A_F TCATTACGCTTTCGTATTATGGCTGAAAATGGCATCTTTGTTCCA R132A_R TGGAACAAAGATGCCATTTTCAGCCATAATACGAAAGCGTAATGA R302A_F GAACCTAACCTCGGCGAAGTTGCTGAGATGGAAGCCAAAGTGGGC R302A_R GCCCACTTTGGCTTCCATCTCAGCAACTTCGCCGAGGTTAGGTTC
Synthesis of (E, E)-3,7,11-Trimethyl-2,6,10-dodecatrien- 1-yl diphosphate (FpCCl2p). The synthesis of the title compound is as outlined in Scheme 1 and followed in
part a previous report that used a difluoromethylene diphosphonate.8
Scheme S1. Reagents and conditions: a Nchlorosuccinimide, Me2S, CH2Cl2 (dry), 40˚C -0˚C, 2 h; b tris (tetra-n-butylammonium) hydrogen dichloromethylenediphosphonate, MeCN, Dowex (NH4+), RT, 2 h.
then warmed to 0˚C and stirred for 5 minutes. Then (E, E)-3,7,11-trimethyl-2,6,10-dodecatrien-1-ol (222 mg, 1 mmol) dissolved in dry CH2Cl2 (5 mL) was added to the solution, at -40˚C. The mixture was slowly allowed to warm to 0˚C over 1h and maintained at 0˚C for another hour, after which it was warmed to room temperature for 15 min. The mixture was then poured into a 100 mL separatory funnel containing 30 mL cold brine and extracted with hexanes. The combined organic layers were washed with cold brine, dried with MgSO4 and the solvent removed in vacuo, to yield 90% (1a). FpCCl2p (1b) was synthesized (35% yield) as a white solid, from the reaction of 1a with tris (tetra-n-butylammonium) hydrogen dichloromethylene diphosphonate, according to a previous report8. HRMS calc. 448.0795; found 448.0799; 1H NMR (400 MHz, D2O) δ ppm 5.40 (t, J = 6.6 Hz, 1H), 5.20 (m, 2H), 4.47 (t, J1 = J2 = 6.64 Hz, 2H), 2.16-2.02 (m, 8H), 1.71 (s, 3H), 1.68 (s, 3H),1.61 (s, 6H). 31P NMR (162 MHz, D2O) δ ppm 10.95 (d, J = 9.0 Hz, 1P), 8.10 (d, J = 9.0 Hz, 2P).
Diphosphate release assay for FPPS. FPPS activity was measured by means of a diphosphate release assay. Briefly, buffer containing 1 u/mL purine nucleotide phosphorylase, 1 u/mL inorganic phosphatase (baker’s yeast), 600 M 7-methyl-6-thioguanosine (MESG), and 2 M enzyme was used for these assays which were carried out at 25 ºC. To this mixture, FPP was added to 2 mM. The FPP was then serially diluted (2x) to 230 nM, while keeping the same buffer conditions and enzyme concentrations. The increase in absorbance at 360 nm, representing the formation of inorganic phosphate, was used to determine the rate of sesquisabinene synthesis. Product formation was verified by using a Waters GCT Premier GC-MS instrument employing the conditions reported in literature9.
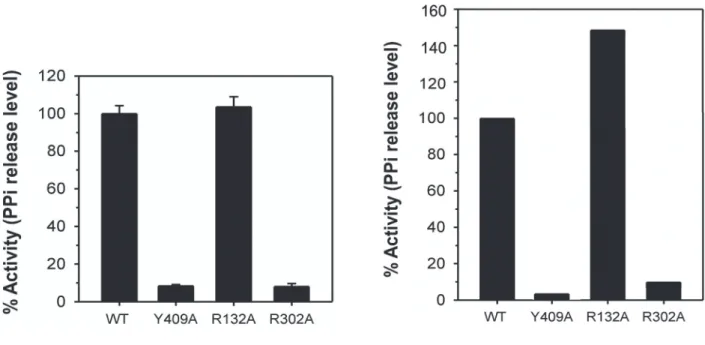
Diphosphate release assay for SaSES2. SaSQS2 activity was also measured by using a pyrophosphate (PPi) release assay. Recombinant proteins of SaSQS2 variants were expressed and purified following the protocol for wild type protein purification. PPi release was determined by using a continuous spectrophotometric assay in 96-well plates with 200 μL reaction mixtures containing 1.8 μM protein, 140 μM 2-amino-6-mercapto-7-methyl purine ribonucleoside (MESG), 4 μg/mL purine nucleoside phosphorylase and inorganic diphosphatase, 100 μM FPP, 50 mM Tris-HCl (pH 7.5), 0.1 mM sodium azide and 1 mM MgCl2. Absorption at 360 nm was measured as a function of time to determine enzyme activity and reported as a percentage of wild type enzyme activity. Total assay time was 15 minutes. We Samples were assayed in triplicate in each independent experiment.
GC-MS analysis of SaSES2 products. The assay mixture contained 300 μg wild type or mutant SaSQS2 protein and 300 μM (E,E)-FPP in a buffer of 25 mM HEPES, 10% v/v glycerol, 5 mM dithiothreitol, 10 mM MgCl2 (pH 7.4) to a final volume of 500 μL. The reaction mixture was overlaid by n-hexane and incubated at 30 for 2 h℃ in order to produce high product levels. The mixture was extracted with n-hexane (2×500 μL) at the end of reaction. The organic layers containing products were dried over anhydrous Na2SO4 and reduced to 100 μL with a stream of dry nitrogen. The extracts were analyzed on a thermo GC-MS via split injection onto a HP-5 column. A temperature gradient from 70 ℃ to 170 at 5 /min, ℃ ℃
followed by a second temperature gradient of 15 °C/min from 170 °C to 180 °C and a final hold at 180 ºC for 5 min was used.
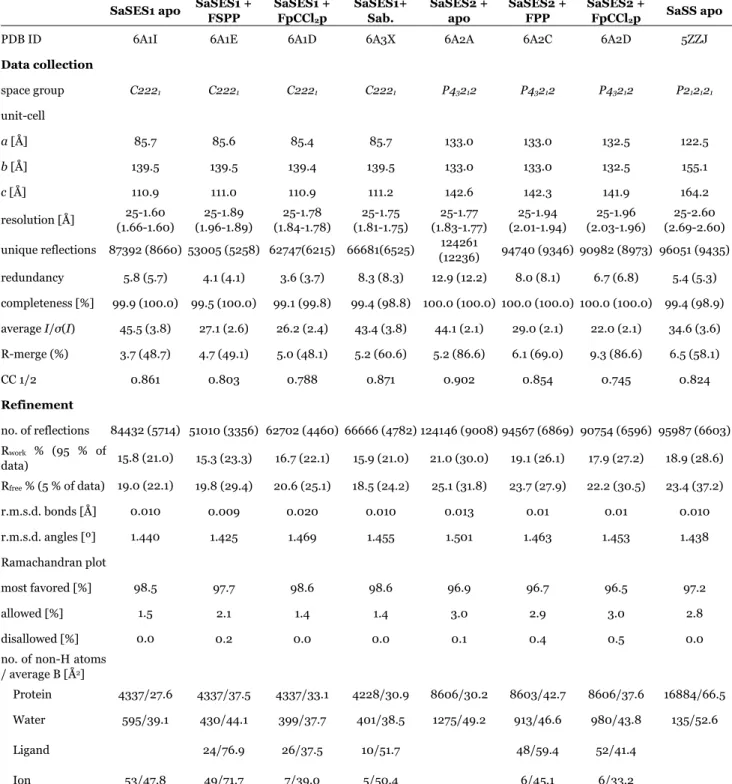
Table S1. X-ray crystallographic results.
SaSES1 apo SaSES1 +
FSPP SaSES1 + FpCCl2p SaSES1+ Sab. SaSES2 + apo SaSES2 + FPP SaSES2 + FpCCl2p SaSS apo
PDB ID 6A1I 6A1E 6A1D 6A3X 6A2A 6A2C 6A2D 5ZZJ
Data collection space group C2221 C2221 C2221 C2221 P43212 P43212 P43212 P212121 unit-cell a [Å] 85.7 85.6 85.4 85.7 133.0 133.0 132.5 122.5 b [Å] 139.5 139.5 139.4 139.5 133.0 133.0 132.5 155.1 c [Å] 110.9 111.0 110.9 111.2 142.6 142.3 141.9 164.2 resolution [Å] (1.66-1.60) 25-1.60 (1.96-1.89) 25-1.89 (1.84-1.78)25-1.78 (1.81-1.75) 25-1.75 (1.83-1.77)25-1.77 (2.01-1.94) 25-1.94 (2.03-1.96) 25-1.96 (2.69-2.60)25-2.60 unique reflections 87392 (8660) 53005 (5258) 62747(6215) 66681(6525) (12236) 124261 94740 (9346) 90982 (8973) 96051 (9435) redundancy 5.8 (5.7) 4.1 (4.1) 3.6 (3.7) 8.3 (8.3) 12.9 (12.2) 8.0 (8.1) 6.7 (6.8) 5.4 (5.3) completeness [%] 99.9 (100.0) 99.5 (100.0) 99.1 (99.8) 99.4 (98.8) 100.0 (100.0) 100.0 (100.0) 100.0 (100.0) 99.4 (98.9) average I/σ(I) 45.5 (3.8) 27.1 (2.6) 26.2 (2.4) 43.4 (3.8) 44.1 (2.1) 29.0 (2.1) 22.0 (2.1) 34.6 (3.6) R-merge (%) 3.7 (48.7) 4.7 (49.1) 5.0 (48.1) 5.2 (60.6) 5.2 (86.6) 6.1 (69.0) 9.3 (86.6) 6.5 (58.1) CC 1/2 0.861 0.803 0.788 0.871 0.902 0.854 0.745 0.824 Refinement no. of reflections 84432 (5714) 51010 (3356) 62702 (4460) 66666 (4782) 124146 (9008) 94567 (6869) 90754 (6596) 95987 (6603) Rwork % (95 % of data) 15.8 (21.0) 15.3 (23.3) 16.7 (22.1) 15.9 (21.0) 21.0 (30.0) 19.1 (26.1) 17.9 (27.2) 18.9 (28.6) Rfree % (5 % of data) 19.0 (22.1) 19.8 (29.4) 20.6 (25.1) 18.5 (24.2) 25.1 (31.8) 23.7 (27.9) 22.2 (30.5) 23.4 (37.2) r.m.s.d. bonds [Å] 0.010 0.009 0.020 0.010 0.013 0.01 0.01 0.010 r.m.s.d. angles [º] 1.440 1.425 1.469 1.455 1.501 1.463 1.453 1.438 Ramachandran plot most favored [%] 98.5 97.7 98.6 98.6 96.9 96.7 96.5 97.2 allowed [%] 1.5 2.1 1.4 1.4 3.0 2.9 3.0 2.8 disallowed [%] 0.0 0.2 0.0 0.0 0.1 0.4 0.5 0.0
no. of non-H atoms / average B [Å2]
Protein 4337/27.6 4337/37.5 4337/33.1 4228/30.9 8606/30.2 8603/42.7 8606/37.6 16884/66.5
Water 595/39.1 430/44.1 399/37.7 401/38.5 1275/49.2 913/46.6 980/43.8 135/52.6
Ligand 24/76.9 26/37.5 10/51.7 48/59.4 52/41.4
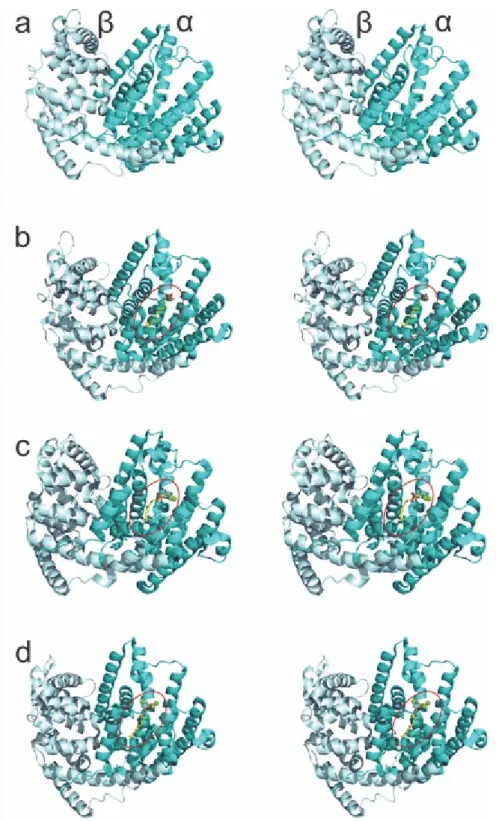
Figure S1: Stereo-views of the X-ray crystallographic structures of sesquisabinene synthases. (a) Apo-SaSES1 (PDB ID code 6A1I). (b) SaSES1/FSPP (PDB ID code 6A1E). (c) SaSES2/FpCCl2p (PDB ID code 6A2D). (d) SaSES2/FPP (PDB ID code 6A2C). The bound ligands are shown as yellow sticks, Mg2+ as green spheres, and the red ellipses highlight the ligand/Mg2+ binding site (in the -domain of these proteins). The structures of apo-SaSES2, apo-SaSS, SaSES1/FpCCl2p and SaSES1+sabinene are similar and are shown in Figure S2.
Figure S2. Stereo-views of the X-ray crystallographic structures of sesquisabinene and santalene synthases. (a) Apo-SaSES2 (PDB ID code 6A2A). (b) Apo-SaSS (PDB ID code 5ZZJ). (c) SaSES1/ FpCCl2p. (d) SaSES1/sabinene (PDB ID code 6A3X). The bound ligands are shown as yellow sticks, Mg2+ as green spheres, and the red ellipses highlight the ligand/Mg2+ binding site (in the -domain of these proteins).
Figure S3. Stereo-view of SaSES1 showing residues (yellow spheres) that are not conserved in SaSES2. Note that the vast majority of the non-conserved residues are in the non-catalytic, domain (on the left of the Figure).
Figure S4. 2Fo‒Fc maps of SaSES1, SaSES2 and SaSS with 2.0 sigma (red) and 1.0 sigma (marine) contours shown.(a) SaSES1/FSPP (PDB ID code 6A1E). (b) SaSES1/FpCCl2p (PDB ID code 6A1D). (c) SaSES2/FPP (PDB ID code 6A2C). (d) SaSES2/FpCCl2p (PDB ID code 6A2D). (e) SaSES1/sabinene (PDB ID code 6A3X). (f) Superimposition of all ligands: sabinene is in yellow; SaSES1/FSPP is in green; the SaSES1/FpCCl2p is in blue; SaSES2/FPP is in purple; SaSES2/FpCCl2p is in marine.
SaSES1/FSPP SaSES1/FpCCl2p
SaSES2/FpCCl2p
SaSES2/FPP
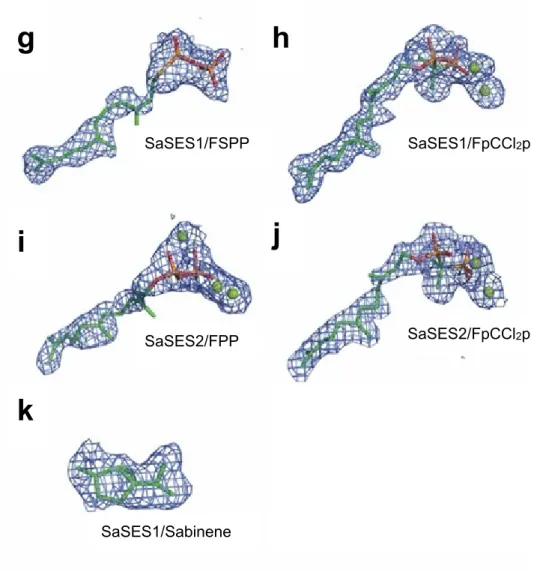
Figure S4 (continued). Omit maps of bound ligands in SaSES1 and SaSES2 complex structures contoured to 2.0 σ.(g) SaSES1/FSPP (PDB ID code 6A1E). (h) SaSES1/FpCCl2p (PDB ID code 6A1D). (i) SaSES2/FPP (PDB ID code 6A2C). (j) SaSES2/FpCCl2p (PDB ID code 6A2D). (k) SaSES1/sabinene (PDB ID code 6A3X). Maps are shown in mesh, while compounds and Mg ions are presented as sticks and spheres, respectively.
SaSES1/FSPP SaSES1/FpCCl2p SaSES2/FpCCl2p SaSES2/FPP SaSES1/Sabinene
g
h
i
j
k
Figure S5. Structure superpositions of DMAPP (green, PDB ID code: 1UBY), GPP (cyan, PDB ID code: 1UBW), and FPP (pink, PDB ID code: 1UBX) bound to chicken FPPS, together with the “DDXXD” residues. Note that only MgAC are present in all three structures.
Figure S6. Active site structures of the 20 prenyl transferases and cyclases discussed by Cao et al.10 showing at left stereo views of the AC-domain residues (in blue), the B, D (and D*) domain residues (in orange), together with (where present), Mg2+ and ligands. Surface views of the ligand-binding pockets are shown on the right. (a) Trichodiene synthase (PDB ID Code: 1JFG) from Fusarium sporotrichioides complexed with diphosphate. (b) 5-Epi-aristolochene synthase (PDB ID Code: 5EAS) from Nicotiana tabacum. (c) Cryptosporidium parvum putative polyprenyl pyrophosphate synthase (PDB ID Code: 2Q58) in complex with zoledronate. (d) T. brucei farnesyl diphosphate synthase (PDB ID Code: 2WEG) complexed with minodronate. (e) S. cerevisiae geranylgeranyl pyrophosphate synthase (PDB ID Code: 2E8T) in complex with magnesium, FSPP and IPP.
Figure S6 (continued). Structures of 20 prenyl transferases and cyclases (continued). (f) Crystal structure of human squalene synthase (PDB ID Code: 1EZF). (g) Dehydrosqualene synthase (PDB ID Code: 3W7F) from Staphylococcus aureus complexed with FSPP. (h) T. cruzi farnesyl diphosphate synthase (PDB ID Code: 1YHK). (i) S. aureus farnesyl pyrophosphate synthase (PDB ID Code: 1RTR). (j) Unliganded human FPPS (PDB ID Code: 2F7M).
Figure S6 (continued). Structures of 20 prenyl transferases and cyclases (continued). (k) Plasmodium vivax farnesyl/geranylgeranyl pyrophosphate synthase (Pv092040, PDB ID Code: 3MAV) (l) Shigella flexneri farnesyl pyrophosphate synthase complex with isopentenyl pyrophosphate (PDB ID Code: 2FOR) (m) Chicken farnesyl pyrophosphate synthetase (PDB ID Code: 1UBV) (n) E. coli farnesyl pyrophosphate synthase bound to isopentyl pyrophosphate and dimethylallyl S-thiolodiphosphate (PDB ID Code: 1RQI). (o) Aristolochene synthase from Penicillium roqueforti (PDB ID Code: 1DI1)
Figure S6 (continued). Structures of 20 prenyl transferases and cyclases (continued). (p) (+)-Bornyl diphosphate synthase (PDB ID Code: 1N1B) from sage. (q) Mentha spicata limonene synthase with 2-fluorogeranyl diphosphate (PDB ID Code: 2ONG, purple spheres are Mn2+). (r) Streptomyces exfoliatus pentalenene synthase (PDB ID Code: 1PS1). (s) Geranylgeranyl diphosphate synthase (PDB ID Code: 2J1O) from Sinapis alba. (t) Human geranylgeranyl pyrophosphate synthase bound to GGPP (PDB ID Code: 2Q80).
Figure S7. Activity of SaSES2 WT and mutant proteins as measured in a 15-minute diphosphate release assay. Results are shown from two different protein preparations.
Figure S8: Mutagenesis results on SaSES2. (a) GC-MS (total ion current) results for WT, Y409A, R132A and R302A mutants. The large peak at 16.1 minutes has a m/z=204.2 and is the sesquisabinene product. Proteins were incubated for 2 hours. (b) Peak intensities of the sesquisabinene product from each protein. Data from two separate assays are displayed by white and black dots, with their averages shown in by the boxes. (c) Mass spectral result for the sesquisabinene product of WT SaSES2. (d) MS of sesquisabinene reported by Rahmani
et al.11, Identification of sesquisabinene B in carrot (Daucus carota L.) leaves as a compound electrophysiologically active to the carrot psyllid (Trioza apicalis Förster).
References
1. Otwinowski, Z.; Minor, W., Processing of X-ray diffraction data collected in oscillation mode. Method Enzymol. 1997,276, 307-326.
2. McCoy, A. J.; Grosse-Kunstleve, R. W.; Adams, P. D.; Winn, M. D.; Storoni, L. C.; Read, R. J., Phaser crystallographic software. J Appl. Crystallogr. 2007,40, 658-674.
3. Winn, M. D.; Ballard, C. C.; Cowtan, K. D.; Dodson, E. J.; Emsley, P.; Evans, P. R.; Keegan, R. M.; Krissinel, E. B.; Leslie, A. G.; McCoy, A.; McNicholas, S. J.; Murshudov, G. N.; Pannu, N. S.; Potterton, E. A.; Powell, H. R.; Read, R. J.; Vagin, A.; Wilson, K. S., Overview of the CCP4 suite and current developments. Acta Crystallogr. D Biol. Crystallogr. 2011,67, 235-242.
4. Murshudov, G. N.; Skubak, P.; Lebedev, A. A.; Pannu, N. S.; Steiner, R. A.; Nicholls, R. A.; Winn, M. D.; Long, F.; Vagin, A. A., REFMAC5 for the refinement of macromolecular crystal structures. Acta Crystallogr. D Biol. Crystallogr. 2011,67, 355-367.
5. Emsley, P.; Cowtan, K., Coot: model-building tools for molecular graphics. Acta Crystallogr. D Biol. Crystallogr. 2004,60, 2126-2132.
6. Brunger, A. T.; Adams, P. D.; Clore, G. M.; DeLano, W. L.; Gros, P.; Grosse-Kunstleve, R. W.; Jiang, J. S.; Kuszewski, J.; Nilges, M.; Pannu, N. S.; Read, R. J.; Rice, L. M.; Simonson, T.; Warren, G. L., Crystallography & NMR system: A new software suite for macromolecular structure determination. Acta Crystallogr. D Biol. Crystallogr. 1998,54, 905-921.
7. The PyMOL Molecular Graphics System, Version 2.2.0 Schrödinger, LLC.
8. Davisson, V. J.; Woodside, A. B.; Neal, T. R.; Stremler, K. E.; Muehlbacher, M.; Poulter, C. D., Phosphorylation of isoprenoid alcohols. J. Org. Chem. 1986,51, 4768-4779.
9. Srivastava, P. L.; Daramwar, P. P.; Krithika, R.; Pandreka, A.; Shankar, S. S.; Thulasiram, H. V., Functional Characterization of Novel Sesquiterpene Synthases from Indian Sandalwood, Santalum album. Sci Rep 2015,5, 10095.
10. Cao, R.; Zhang, Y.; Mann, F. M.; Huang, C.; Mukkamala, D.; Hudock, M. P.; Mead, M. E.; Prisic, S.; Wang, K.; Lin, F. Y.; Chang, T. K.; Peters, R. J.; Oldfield, E., Diterpene cyclases and the nature of the isoprene fold. Proteins 2010,78, 2417-2432.
11. Rahmani, R.; Andersson, F.; Andersson, M. N.; Yuvaraj, J. K.; Anderbrant, O.; Hedenström, E., Identification of sesquisabinene B in carrot (Daucus carota L.) leaves as a compound electrophysiologically active to the carrot psyllid (Trioza apicalis Förster). Chemoecology2019, 29, 103-110.