Center for Immigration Studies
C
I
S
May 2014
W
hile employers argue that there are not enough workers with technical skills, most prior research has found little evidence that such workers are in short supply. This report uses the latest Census Bureau data available to examine the science, technology, engineering, and math (STEM) fields. Consistent with other research, the findings show that the country has more than twice as many workers with STEM degrees as there are STEM jobs. Also consistent with other research, we find only modest levels of wage growth for such workers for more than a decade. Both employment and wage data indicate there is no shortage of STEM workers in the United States.• Using the most common definition of STEM jobs, total STEM employment in 2012 was 5.3 million work-ers (immigrant and native), but there are 12.1 million STEM degree holdwork-ers (immigrant and native). • Only one-third of native-born Americans with an undergraduate STEM degree holding a job actually
work in a STEM occupation.
• There are more than five million native-born Americans with STEM undergraduate degrees working in non-STEM occupations: 1.5 million with engineering degrees, half a million with technology degrees, 400,000 with math degrees, and 2.6 million with science degrees.
• An additional 1.2 million natives with STEM degrees are not working — unemployed or out of the labor force in 2012.
• Despite the economic downturn, Census Bureau data show that, between 2007 and 2012, about 700,000 new immigrants who have STEM degrees were allowed to settle in the country, yet at the same time, total STEM employment grew by only about 500,000.
• Of these new immigrants with STEM degrees, only a little more than a third took a STEM job and about the same share took a non-STEM job. The rest were not working in 2012.
• Overall, less than half of immigrants with STEM degrees work in STEM jobs. In particular, just 23 per-cent of all immigrants with engineering degrees work as engineers.
• In total, 1.6 million immigrants with STEM degrees worked outside of a STEM field and 563,000 were not working.
• The supply of STEM workers is not just limited to those with STEM degrees. Nearly one-third of the na-tion’s STEM workers do not have an undergraduate STEM degree.
Is There a STEM Worker Shortage?
A look at employment and wages in science,
technology, engineering, and math
By Steven A. Camarota and Karen Zeigler
Steven A. Camarota is the Director of Research and Karen Zeigler is a demographer at the Center for Immigration Studies.
• Wage trends are one of the best measures of labor demand. If STEM workers are in short supply, wages should be increasing rapidly. But wage data from multiple sources show little growth over the last 12 years.
• Real hourly wages (adjusted for inflation) grew on average just 0.7 percent a year from 2000 to 2012 for STEM work-ers, and annual wages grew even less — 0.4 percent a year. Wage growth is very modest for most subcategories of engineers and technology workers.
Introduction
Prior Research. Reports by Georgetown University, the Economic Policy Institute (EPI), the Rand Corporation, the Urban Institute, and the National Research Council have all found no evidence that science, technology, engineering and math (STEM) workers are in short supply.1 The press release that accompanied EPI’s 2013 report was very clear that there is “no
shortage of STEM workers in the United States.”2 After looking at the evidence from the EPI study, PBS entitled its story on
the report, “The Bogus High-Tech Worker Shortage: How Guest Workers Lower US Wages”.3
Rand’s analysis looked backward in time and found that, “Despite recurring concerns about potential shortages of STEM personnel ... we did not find evidence that such shortages have existed at least since 1990, nor that they are on the horizon.”4
A 2013 resume analysis of American technology workers looking for employment and companies seeking to hire workers through the H-1B visa program found that there was a huge supply of qualified applicants for the vast majority of jobs that employers were seeking to fill with foreign workers. Steve Goodman of Bright Media, which conducted the analysis, con-ceded that, “We’re Silicon Valley people, we just assumed the shortage was true. It turns out there is a little Silicon Valley groupthink going on about this, though it’s not comfortable to say that.”5
Hal Salzman, a public policy professor at Rutgers University and one of the authors of the EPI report, observed in a differ-ent article that, “The nation graduates more than two times as many STEM studdiffer-ents each year as find jobs in STEM fields.” In his research, he has emphasized the lack of evidence that STEM workers are in short supply, particularly the lack of wage growth.6 After reviewing the same evidence as Salzman, B. Lindsey Lowell of Georgetown University’s Institute for the Study
of International Migration and a coauthor of the EPI report, has argued that, “Those who advocate increasing the supply of STEM talent should cool their ardor.”7
In a March 2014 article for the Atlantic Monthly entitled “The Science and Engineering Shortage Is a Myth”, demographer Michael Teitelbaum summarized much of the recent literature on STEM employment. For many years, Teitelbaum directed the Alfred P. Sloan Foundation’s research on the science and engineering labor market. He is currently a researcher at the La-bor and Worklife Program at Harvard Law School. In his Atlantic article he observed that, “No one has been able to find any evidence indicating current widespread labor market shortages or hiring difficulties in science and engineering occupations that require bachelor’s degrees or higher.”8 While Teitelbaum thinks that primary and secondary schools should emphasize
math and science more, and that a shortage could possibly develop someday, he is clear that there is not now, nor has there been a shortage of STEM workers. Although a significant body of research confirms this observation, employers and many in Congress continue to push for additional increases in the number of STEM workers allowed into the country.
In recent years, Bill Gates, Mark Zuckerberg, and other employers in technology have provided millions of dollars to lobby Congress to increase the number of workers, including those with STEM degrees allowed into the country. They have argued that the nation needs more of such workers.9 The Chamber of Commerce and other employer groups have worked tirelessly
to increase employment-based immigration, for both permanent (green card) and guest workers.10 At the behest of
employ-ers, the Gang of Eight’s Immigration bill that passed the Senate in 2013 (S.744) included very large increases in the number of both temporary and permanent STEM workers allowed into the country.11 In the House of Representatives, a number of
bills have been introduced designed to increase the number of both temporary and permanent STEM workers allowed into the country.12 The incongruity between what the employment and wage data show and what employers and Congress want
Methods
Data Sources. This analysis draws primarily on the public-use files of the American Community Survey (ACS) collected by the Census Bureau and to a lesser extent on the Bureau’s Current Population Survey (CPS).13 The 2012 ACS has a sample size
of 137,000 STEM degree holders and 57,000 individuals in STEM jobs with at least bachelor’s degrees. As already indicated, the acronym STEM stands for science (life and physical), technology (computer science), engineering, and math. While there are other potential data sources for studying STEM employment, the Census Bureau data has a number of strengths: 1) the ACS sample is very large, providing robust estimates; 2) it is designed to be nationally representative; 3) it is available to the public, and results can be easily replicated by other researchers; 4) it is relatively consistent over time; and 5) because STEM employment, STEM degrees, and earnings all come from the same source, they are directly comparable.
STEM Occupations. Though there are other ways to define STEM jobs, we use the same formulation (based on the ACS) of what constitutes STEM occupations and degrees as the Department of Commerce has used in its analysis.14 Table A1 in the
Appendix at the end of this report lists in detail the occupations that are considered STEM. STEM, as defined in this report, includes those considered to be “STEM management”. It should be noted that the Census Bureau reclassifies occupations every few years.15 However, these changes are relatively minor and do not impact our 2012 analysis and also do not affect the
broad STEM categories from 2000 to 2012.
While we employ the most common definition of STEM occupations, it is possible to define STEM more broadly. Some have suggested that high school and college teachers, some mangers (beyond STEM mangers), health professions, or even most social scientists should be considered STEM.16 There are a number of problems with including occupations outside of the
traditional STEM fields in an analysis of this kind. First, in the context of immigration, the argument for allowing in STEM workers is expressed in terms of a need for more engineers or scientists, not more sociologists or managers. Thus, at least when thinking about immigration policy, it makes sense to limit the analysis to traditional STEM fields.17
There are also limitations in the data that make a very broad definition of STEM difficult. For example, the ACS does not indicate an educator’s subject area, such as math or history. The inclusion of social scientists also seems problematic because a good deal of research in the constituent fields (e.g. anthropology or political science) is qualitative or even normative in nature and goes well beyond even what is normally considered science. In terms of health care professionals, many do have biology undergraduate degrees, but a central idea behind examining STEM fields is that the workers are involved in some way with research and development rather than practitioners, such as nurses or physicians.18 For those wanting to see a
de-tailed analysis of the occupational distribution of native-born STEM degree holders working in non-STEM jobs, Table A5 provides this information.
Consistent with most, but not all, research in this field, we confine our analysis of STEM occupations to only those with bach-elor’s degrees or higher. However, the degree does not have to be in a STEM field. Defined in this way there were 5.3 million STEM workers in 2012.19 Limiting the examination to those with at least a bachelor’s degree makes sense because it confines
the analysis to only more skilled STEM workers, for whom demand is presumably the highest. Moreover, programs like the H1-B visa as well as all proposals to admit more foreign STEM workers focus on those with at least a bachelor’s degree. Thus, when thinking about STEM workers in the context of immigration policy, it makes sense to compare natives and immigrants with at least this level of education.
STEM Degrees. Beginning in 2009, the ACS began to ask those with bachelor’s degrees about their undergraduate majors in college.20 Table A2 in the Appendix shows the degrees that are considered STEM. Although the ACS records if an individual
has a graduate degree, it does not record respondents’ graduate field of study. As a result, throughout this report a STEM degree refers to an individual’s undergraduate education only. The ACS shows that, of native-born Americans with STEM degrees holding any job (STEM and non-STEM), 59 percent have only an undergraduate degree. Of STEM degree holders employed in STEM occupations, 69 percent have only an undergraduate degree.
In this report, we focus on the number of STEM graduates not working in STEM jobs. We report figures for both native-born Americans and immigrants. We use the terms immigrant and foreign-born synonymously. The Census Bureau defines the foreign-born as individuals who are not U.S. citizens at birth.21 We also use the terms native, native-born, and U.S.-born to
Recent Trends in STEM Occupations
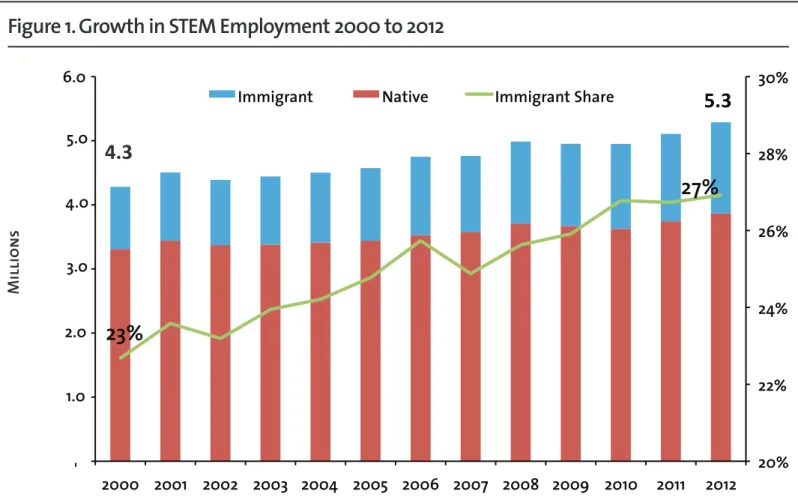
Growth in STEM Employment. Figure 1 uses the American Community Survey (ACS) to show the total number of people employed in science, technology, engineering, and math jobs from 2000 to 2012. Table A4 in the Appendix provides numbers and percentages from 2000 to 2012 for immigrants and natives in STEM jobs in more detail than Figure 1. Overall, there were 5.3 million STEM workers (immigrant and native) in 2012, up from 4.3 million in 2000. In 2012, immigrants accounted for 1.4 million of the nation’s STEM workers — 27 percent of the total. Immigrant STEM employment increased 453,000 from 2000 to 2012, accounting for 45 percent of the net gain in STEM employment in the last decade. Even though the number of immigrants entering the country since 2007 has slowed with the economy, immigrants still accounted for 45 percent of STEM employment growth from 2007 to 2012.
Figure 1. Growth in STEM Employment 2000 to 2012
Source: Public-use files of the 2000-2012 American Community Surveys. STEM employment is confined to those with a bachelor’s degree or higher employed in a STEM field.
23%
27%
20% 22% 24% 26% 28% 30% - 1.0 2.0 3.0 4.0 5.0 6.0 2000 2001 2002 2003 2004 2005 2006 2007 2008 2009 2010 2011 2012 Immigrant Native Immigrant Share4.3
5.3
Millions
Over the last decade, 65 percent of employment growth in science jobs went to immigrants, in technology (computer sci-ence) 45 percent went to immigrants, in engineering 39 percent, and in math 18 percent. There is no question that immigra-tion has had a very significant impact on STEM occupaimmigra-tions over the last decade, especially in science and technology. New Immigrants. In addition to the net change in the number of employed immigrants, we can also examine new arrivals. The ACS asks immigrants when they came to the United States to live. New arrivals and the net increase are not the same because there is significant churn in the foreign-born population as new immigrants arrive each year and some leave the country. Despite the economic downturn, the 2012 ACS shows that there were 704,000 immigrants with STEM degrees who arrived from the beginning of 2007 to the middle of 2012 — 129,000 new arrivals each year on average. These new arrivals are primarily new permanent residents (green card holders), guest workers, and others who have legally immigrated to the
of these new arrivals, and we do not attempt to impute their statuses. We do know that the vast majority of these immigrants arrived with their STEM undergraduate degrees. That is, they did not earn their degrees in the United States.23
Of these post-2007 immigrants with STEM degrees, a little more than a third (249,000) took a STEM job, a similar share took a job outside of STEM (252,000), and the rest (203,000) were not working in 2012. It is also worth noting that a little over 37,000 post-2007 immigrants with non-STEM undergraduate degrees also found work in a STEM field. Although many do not find work in STEM jobs, the Census Bureau data show that in recent years the United States has admitted about 129,000 immigrants with STEM degrees each year, yet total STEM employment growth since 2000 has averaged only about 84,000 jobs each year (see Table A4). If we examine growth from 2007 to 2012, we find that STEM employment growth was some-what higher, but it still averaged only 105,000 jobs annually. Thus, based on the ACS, the number of new immigrants with STEM degrees admitted each year is by itself higher than the total growth in STEM employment. This is truly extraordinary when one considers that the same data show that the number of U.S.-born STEM graduates is growing by 115,000 a year.24
Given these numbers, it should not be surprising that most STEM graduates (immigrant or native) do not have STEM jobs. Moreover, as we will see later in this report, there are 6.7 million natives and immigrants already here with STEM degrees working in non-STEM jobs. There are an additional 1.8 million STEM degree holders in the country not working at all. All of this calls into question the current level of STEM immigration. The dramatic increases in STEM immigration called for by employers and many in Congress would seem to be out of step with the absorption capacity of the STEM labor market. It is clearly the case that most new immigrants with STEM degrees are not finding STEM jobs.
The Total Potential STEM Workforce
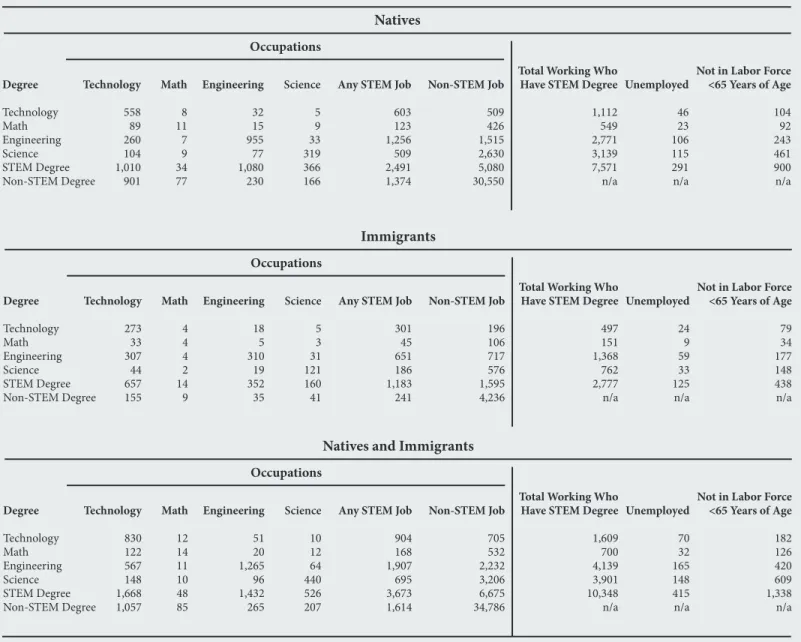
Natives with STEM Degrees. The top of Table 1 (next page) reports the number of native-born Americans with STEM un-dergraduate degrees working in and out of STEM occupations, based on the 2012 ACS.25 Table 1 reads as follows: In 2012
there were 558,000 natives with technology degrees (computer science) working in technology, 8,000 natives with technology degrees working in math occupations, and so on across the row. In total, there were 603,000 natives with technology degrees working in a STEM job of some kind and another 509,000 with such degrees working outside of any STEM field. Of course, the skills for one STEM job overlap with those from another. For example, someone with a math background can work in other fields requiring quantitative skills. But of all natives with a STEM degree, only about one-third (2.5 million) work in any STEM occupation, while 5.1 million work outside of STEM. (For a more specific information about the spread of natives across the occupations that comprise STEM, Table A9 in the Appendix reports figures for each occupation at the highest level of detail possible with the ACS.)
The right side of Table 1 reports the number of individuals with STEM degrees who are unemployed and those who are out of the labor market — not working or looking for work. If we add together those who are unemployed and those who are entirely out of the labor market (under age 65) to those with STEM degrees that work outside of STEM occupations, there are 6.3 million native-born Americans with STEM degrees not working at STEM jobs. This would seem to be a huge supply of potential STEM workers for the industry to draw upon. This is especially true given that the total number of people (im-migrant and native) working in STEM occupations is only 5.3 million.
Of course, some natives with STEM degrees may not wish to work in STEM. But it would be incorrect to say that STEM jobs do not interest natives. Table A9 in the appendix shows that a majority of workers in all 48 STEM occupations in 2012 were native-born. Thus, it is not the case that there are STEM jobs in which natives show no interest.
Total Population with STEM Degrees. The middle section of Table 1 shows the same information as the top of the table except it reports figures for immigrants. The bottom of the table shows the numbers for immigrants and natives combined. Looking at the combined figures for immigrants and natives at the bottom of Table 1 shows that there are 10.3 million immi-grants and natives working who have STEM degrees and another 1.8 million unemployed or out of the labor force. Of these, 12.1 million (10.3 plus 1.8 million) STEM degree holders, only 3.7 million have STEM jobs. The rest are working outside of any STEM job or are not working at all. (Later in this report we will discuss STEM workers who do not have STEM degrees.)
Degree Technology Math Engineering Science STEM Degree Non-STEM Degree
Table 1. Employment by Occupation and Degree for
Natives and Immigrants with a Bachelor’s Degree or More (thousands)
Technology 558 89 260 104 1,010 901 Science 5 9 33 319 366 166
Total Working Who Have STEM Degree
1,112 549 2,771 3,139 7,571 n/a Occupations
Source: Public-use files of the 2012 American Community Survey. Analysis confined to those with a bachelor’s degree or higher.
Engineering 32 15 955 77 1,080 230 Non-STEM Job 509 426 1,515 2,630 5,080 30,550
Not in Labor Force <65 Years of Age 104 92 243 461 900 n/a Math 8 11 7 9 34 77
Any STEM Job
603 123 1,256 509 2,491 1,374 Unemployed 46 23 106 115 291 n/a Natives Degree Technology Math Engineering Science STEM Degree Non-STEM Degree Technology 273 33 307 44 657 155 Science 5 3 31 121 160 41
Total Working Who Have STEM Degree
497 151 1,368 762 2,777 n/a Occupations Engineering 18 5 310 19 352 35 Non-STEM Job 196 106 717 576 1,595 4,236
Not in Labor Force <65 Years of Age 79 34 177 148 438 n/a Math 4 4 4 2 14 9
Any STEM Job
301 45 651 186 1,183 241 Unemployed 24 9 59 33 125 n/a Immigrants Degree Technology Math Engineering Science STEM Degree Non-STEM Degree Technology 830 122 567 148 1,668 1,057 Science 10 12 64 440 526 207
Total Working Who Have STEM Degree
1,609 700 4,139 3,901 10,348 n/a Occupations Engineering 51 20 1,265 96 1,432 265 Non-STEM Job 705 532 2,232 3,206 6,675 34,786
Not in Labor Force <65 Years of Age 182 126 420 609 1,338 n/a Math 12 14 11 10 48 85
Any STEM Job
904 168 1,907 695 3,673 1,614 Unemployed 70 32 165 148 415 n/a
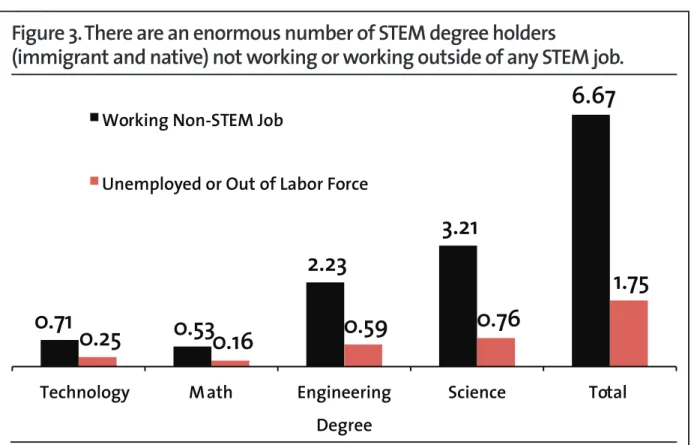
Figure 2 shows the large difference between the relatively modest number of STEM jobs and the much larger number of STEM degree holders (immigrant and native). Figure 3 shows the same numbers for the specific STEM degrees. Figure 3 reads as follows: There are 700,000 people with technology degrees not working in technology jobs and another 250,000 not working at all (unemployed or under age 65 and out of the labor force). The total number of people (immigrant and native) with STEM degrees is certainly very large and would seem to be more than adequate to meet the demand for the limited number of STEM jobs.
Figure 2. The number of potential STEM workers (immigrant and native) vastly exceeds the
number of STEM jobs.
Source: Public-use files of the 2012 American Community Survey. STEM employment is confined to those with a bachelor’s degree or higher employed in a STEM field.
* Includes 1.8 million with STEM degrees unemployed, out of the labor market, and under age 65.
5.3
12.1
8.4
1.6
Total workers in STEM jobs Total with STEM degrees* STEM degree holders not
working in a STEM job* Workers in STEM jobs without STEM degrees
Figure 3. There are an enormous number of STEM degree holders
(immigrant and native) not working or working outside of any STEM job.
Source: Public-use files of the 2012 American Community Survey. Analysis confined to those with a bachelor’s degree or higher.
0.71
0.53
2.23
3.21
6.67
0.25
0.16
0.59
0.76
1.75
Technology
Math
Engineering
Science
Total
Degree
Working Non-STEM Job
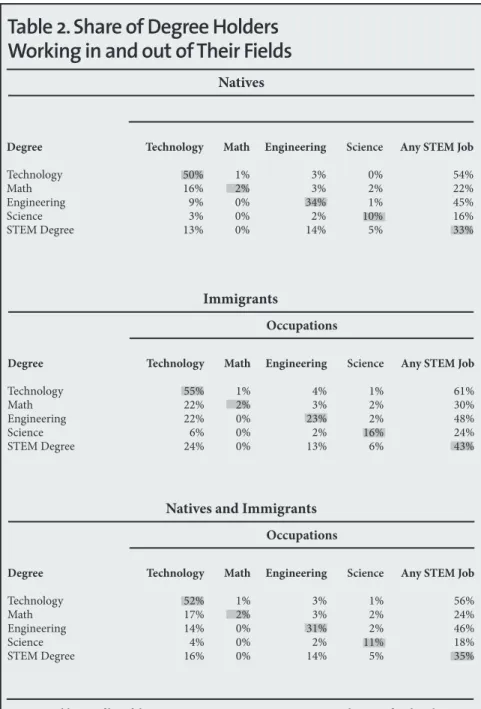
Share of Natives in Non-STEM Jobs. Table 2 uses the numbers from Table 1 to report the percentages of those with STEM degrees working in their field. Like Table 1, the top of the table reports figures for natives, the middle of the table reports figures for immigrants, and the bottom of the table is for both groups together. Table 2 reads as follows: 50 percent of natives with a technology degree have a technology job. The grayed boxes show the share of those working in the same field as their undergraduate degrees. Thus, only 2 percent of natives with a math degree have a math job, only 34 percent of the U.S.-born with an engineering degree work as an engineer, and 10 percent of those with a science degree have a job in science.
Degree Technology Math Engineering Science STEM Degree
Table 2. Share of Degree Holders
Working in and out of Their Fields
Source: Public-use files of the 2012 American Community Survey. Analysis confined to those with a bachelor’s degree or higher.
Natives Degree Technology Math Engineering Science STEM Degree Occupations Immigrants Degree Technology Math Engineering Science STEM Degree Occupations
Natives and Immigrants
Technology 50% 16% 9% 3% 13% Science 0% 2% 1% 10% 5% Engineering 3% 3% 34% 2% 14% Math 1% 2% 0% 0% 0%
Any STEM Job
54% 22% 45% 16% 33% Technology 55% 22% 22% 6% 24% Science 1% 2% 2% 16% 6% Engineering 4% 3% 23% 2% 13% Math 1% 2% 0% 0% 0%
Any STEM Job
61% 30% 48% 24% 43% Technology 52% 17% 14% 4% 16% Science 1% 2% 2% 11% 5% Engineering 3% 3% 31% 2% 14% Math 1% 2% 0% 0% 0%
Any STEM Job
56% 24% 46% 18% 35%
As already discussed, most Americans with STEM undergraduate degrees, including degrees in engineering, do not work in the field in which they earned their undergraduate degrees. The last column in Table 2 reports the share of those with each type of degree working in any STEM job. The table shows only 33 percent of all natives with an undergraduate STEM degree who hold a job do so in a STEM field. It is worth adding that all of these percentages would be lower if we included those with STEM degrees who are unemployed or out of the labor force.
Immigrants in Non-STEM Jobs. The middle section of Table 2 shows that, like natives, most immigrants with STEM de-grees also do not work at a job that corresponds to their undergraduate dede-grees. Compared to natives, immigrants with tech-nology degrees (computer science) are somewhat more likely to have a job in their field of study than natives with techtech-nology degrees — 55 percent vs. 50 percent. The share for immigrants (16 percent) and natives (10 percent) with science degrees who work in science jobs is very low. The percentage of immigrants and natives with math degrees working in math jobs is even lower, just 2 percent for both groups. It should be pointed out that the total number of math jobs is very small, less than 200,000. Therefore, there are not that many opportunities for employment in a math-specific occupation.
Because of a perceived need, there has been significant pressure to admit more immigrant engineers. But Table 2 shows that the share of immigrant engineers holding an engineering job is actually lower than natives — 23 vs. 34 percent. Even if more immigrant engineers are allowed into the country, the available evidence indicates that most will not find work as engineers. This indicates that increasing the number of immigrant engineers allowed into the country is not very efficient at increasing the number of people working as engineers. Overall, there are some differences between immigrants and natives with STEM degrees; however, the majority of both groups work outside of the area in which they earned their undergraduate degrees. Those Working Outside Their Field. What about STEM degree holders who are not employed in STEM jobs? Table A5 in the Appendix reports the occupational categories of native-born STEM graduates who are not employed in STEM jobs. Overall, healthcare and non-STEM management tend to be the most common non-STEM jobs held by STEM graduates. However, these occupational categories account for only 41 percent of non-STEM employment for STEM degree holders. For those natives with technology degrees, management, office and administrative support, and sales occupations account for about half of their non-STEM employment. For native holders of math degrees, roughly one-fifth teach in high school or college and roughly the same share are in management. About one-third of natives with engineering degrees working at non-STEM jobs are employed in non-non-STEM management occupations. For natives with science degrees working at non-non-STEM jobs, about one-third are in some kind of healthcare job and one-fifth are doctors. In general, Table A5 shows that some oc-cupations are more common than others for U.S.-born STEM graduates working outside of STEM ococ-cupations. But STEM graduates are spread out in many different occupations, including 66,000 in community and social service jobs, a similar number in protective services (e.g. security guard), 62,000 in food preparation and serving, and 45,000 in building cleaning and maintenance occupations.
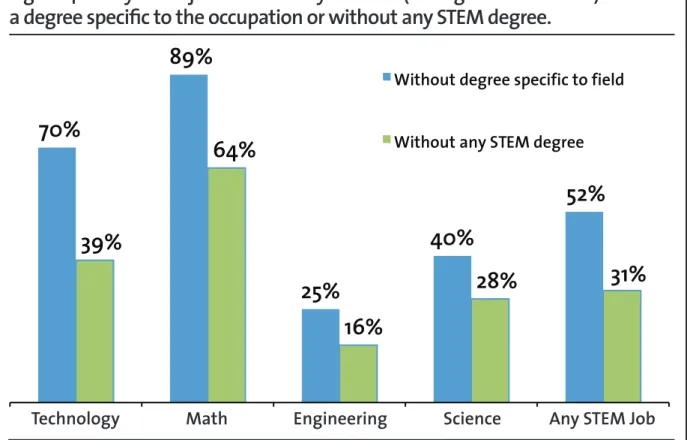
Non-Degree Holders in STEM Fields. As we have seen, there are many more STEM degree holders than there are STEM jobs. Another aspect of this issue that is sometimes overlooked is that many workers in STEM jobs do not have undergradu-ate degrees in the areas in which they work. When the argument is made that the country needs more workers with technical skills, it is sometimes assumed that to work in a STEM job one has to have a STEM degree. Figure 4 (next page) shows this is not the case. Figure 4 reads as follow: in technology, 70 percent of workers (immigrant and native) do not have a technology undergraduate degree, and 39 percent do not have a STEM degree of any kind. Overall, 52 percent of STEM workers do not have an undergraduate degree in the specific field in which they hold a job. Moreover, 31 percent of all STEM workers do not have a STEM undergraduate degree of any kind. Again, it must be remembered that these individuals do have bachelor’s de-grees, just not in a STEM field. The large share of STEM workers who do not have an undergraduate STEM degree certainly indicates that the supply of STEM workers is much larger and more flexible than is sometimes thought.
The 1.6 million STEM workers without STEM degrees must have gained their training on the job or in some other way. Some surely went back to school and earned a graduate degree in a STEM field. As already discussed, the ACS does not identify the field of study for those with graduate degrees, though it does record that a person has a graduate degree. We do know that the overwhelming majority of non-STEM degree holders who work in STEM jobs do not have graduate degrees. Of the 1.6 million people without STEM undergraduate degrees working in a STEM field, 1.1 million or 70 percent have only an undergraduate degree.
Figure 4. Many STEM jobs are filled by workers (immigrant and native) without
a degree specific to the occupation or without any STEM degree.
Source: Public-use files of the 2012 American Community Survey. Analysis confined to those with a bachelor’s degree or higher.
70%
89%
25%
40%
52%
39%
64%
16%
28%
31%
Without degree specific to field Without any STEM degree
Technology
Math
Engineering
Science
Any STEM Job
It is worth pointing out that the vast majority (85 percent) of those working in STEM occupations without STEM degrees are native-born. This indicates that allowing in large numbers of immigrants who seek STEM employment may create competi-tion for natives who themselves do not have STEM degrees, but who can do such work nonetheless. The large share of STEM workers who do not have a STEM degree of any kind is a clear indication that it would be a mistake to think that the supply of STEM workers is limited only to those who have a STEM degree.
Wages for Those Outside of Their Field
While most natives and immigrants who have STEM degrees do not have STEM jobs, this does not necessarily mean that they earn less because of this. It is entirely possible that STEM degree holders who work in non-STEM jobs earn more than those employed in STEM occupations. This may partly explain why so many work in non-STEM fields. On the other hand, it is very possible that immigration is reducing wages or employment opportunities for natives in STEM jobs. This would make non-STEM employment more attractive by default. If this is the case, non-STEM jobs may pay STEM degree holders more than STEM jobs, but this is due to the concentration of immigrants in STEM occupations. We do not know what STEM jobs would have paid absent immigration. We can, however, compare the current wages of natives with STEM degrees who work in their fields with those who work outside of their fields.
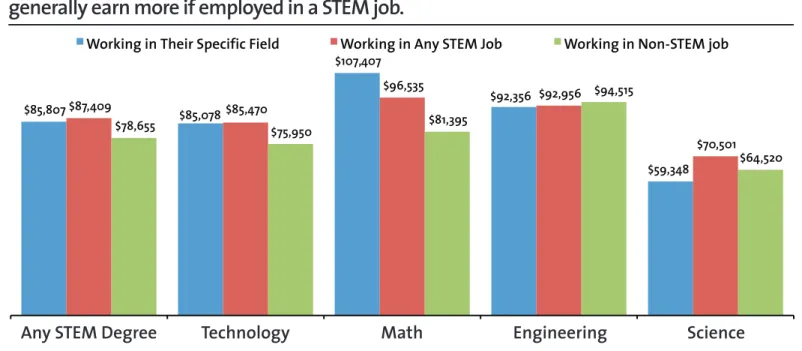
Natives with Only Bachelor’s Degrees. Figure 5 (next page) compares the average annual wages of natives with only STEM bachelor’s degrees working in and out of their fields.26 In 2012, 38 percent of natives with only a STEM bachelor’s degree
worked in a STEM job. (As already discussed, if we include those with graduate degrees, the figure for natives is 33 percent in Table 2). Figure 5 shows that, in general, those with STEM bachelor’s degrees working in STEM fields do better than their counterparts in non-STEM fields. Overall, STEM graduates earn about 10 percent ($8,754) more in STEM occupations com-pared to those employed in non-STEM occupations.
Figure 5. Natives with only STEM bachelor’s degrees
generally earn more if employed in a STEM job.
Source: Public-use files of the 2012 American Community Survey. Analysis confined to natives with only a bachelor’s degree under age 65.
$85,807 $85,078 $107,407 $92,356 $59,348 $87,409 $85,470 $96,535 $92,956 $70,501 $78,655 $75,950 $81,395 $94,515 $64,520
Working in Their Specific Field Working in Any STEM Job Working in Non-STEM job
Technology
Math
Engineering
Science
Any STEM Degree
There is some variation across categories. Those with computer degrees and science degrees tend to do better when they have STEM jobs, but are employed outside of their particular fields of study. In engineering, the differences are modest across categories, but those with engineering degrees tend to have slightly higher earnings (1.7 percent) when they work outside of a STEM field. In general, the wage data do not support the idea that those with STEM degrees do much better when they work at non-STEM jobs, at least for those with only undergraduate degrees. Thus, higher wages outside of STEM occupations do not seem to explain why so many STEM graduates work in non-STEM jobs, at least for the 59 percent of native STEM degree holders who have only an undergraduate degree.
However, it must be pointed out that Figure 5 is only a simple comparison; it does not control for things such as age or gender. But, these findings do indicate that it might be relatively easy to attract a significant share of STEM degree holders into STEM jobs by raising wages if, for example, the supply of immigrant STEM workers entering the country was curtailed.
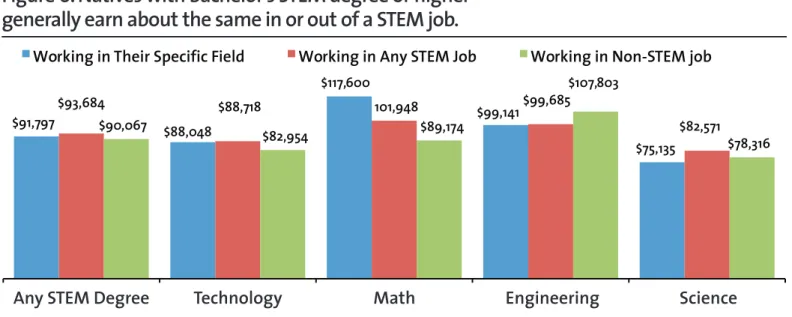
All Natives with STEM Degrees. As already mentioned, one of the limitations of the degree data from the ACS is that it only relates to respondents’ undergraduate degrees. This means we do not know the respondents’ graduate fields of study, only that they have one. Those with graduate degrees include doctors and lawyers, as well as those with master’s and PhDs in both STEM and non-STEM fields. When we examine wages for all those with STEM degrees working outside of STEM oc-cupations the results are heavily influenced by the modest number of doctors who are highly paid. Of the entire population of natives with STEM undergraduate degrees working in a non-STEM field (5.1 million), about one-tenth (528,000) work as doctors, most having undergraduate degrees in biology. Being a doctor is generally not considered a STEM occupation and they are not treated as one in this analysis.27 Figure 6 (next page) reports annual earnings for all STEM, including those with
graduate degrees, but excluding doctors.
Like the figures for those with only undergraduates degrees, Figure 6 shows that, overall, native STEM degree holders do somewhat better when working in a STEM job, earning about 4 percent more ($3,617). But this difference is not very large and is an indication that natives with STEM degrees (excluding doctors) earn about the same in and out of STEM fields, but with significant differences across degrees and occupations.
Unlike those with only undergraduate degrees, the picture is more muddled in Figure 6 when we include those with graduate degrees. Nonetheless, it is hard to argue, with the notable exception of doctors, that most natives with STEM undergraduate degrees work in non-STEM jobs because the jobs pay so much more than the field in which they earned their degrees. In general, this is not the case. One reasonable interpretation of the data is that STEM employment is not that attractive, at least
Figure 6. Natives with bachelor’s STEM degree or higher
generally earn about the same in or out of a STEM job.
Source: Public-use files of the 2012 American Community Survey. Analysis confined to natives with a bachelor’s degree or higher, under age 65, excluding doctors (physicians, surgeons, podiatrists, dentists, and optometrists).
Technology
Math
Engineering
Science
Any STEM Degree
in terms of wages relative to non-STEM jobs. If STEM workers were in short supply, we would expect to see a significant wage premium for STEM degree holders working in STEM fields compared to those working outside of STEM. But Figure 6 shows this is not the case.
Wage Trends
While Census Bureau data from the ACS on those with STEM degrees only go back to 2009, data on wages for workers in STEM occupations go back much further. Wage trends are a key measure of labor demand. As already discussed, those that want to allow more foreign STEM workers into the country argue that the demand exceeds the supply of such workers. One clear sign that demand for workers is outstripping supply would be rapidly rising wages as employers try to recruit and retain the limited number of workers available.
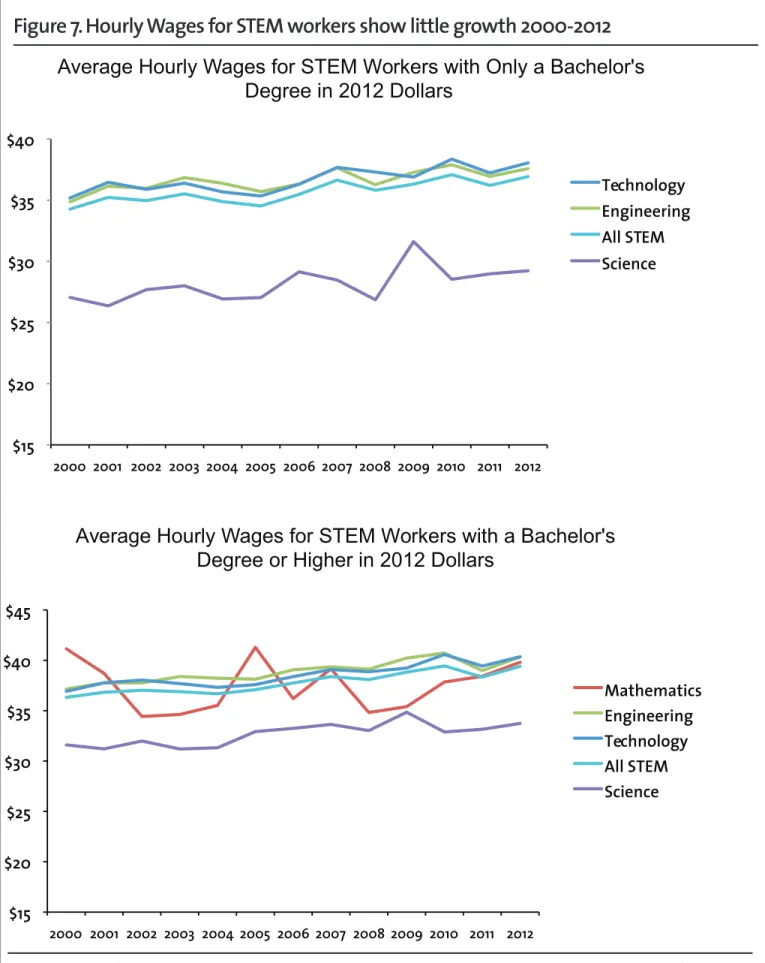
Hourly Wages. Figure 7 (next page) reports average hourly wages for STEM workers from 2000 to 2012 based on the month-ly Current Population Survey (CPS). The CPS is collected by the Census Bureau and is similar to the ACS, but it is smaller and collects data on a monthly basis; it is the primary source of information on unemployment and wages. Table A7 in the Appendix reports more detailed information on average hourly wages for sub-categories of STEM workers using the CPS. (Unlike the ACS, the CPS does not ask about degree field.)
The top of Figure 7 reports hourly wages for STEM workers with only bachelor’s degrees, and the bottom of the figure reports hourly wages for all STEM workers, including those with graduate degrees. Not surprisingly, the graph shows that when those with graduate degrees are included, hourly wages for STEM workers are somewhat higher. However, the overall trends are the same — hourly wages for STEM workers show very modest growth for more than a decade.
Over the entire period of 2000 to 2012, real hourly wages (adjusted for inflation) grew on average just 0.65 percent annually for those with only a bachelor’s degree and 0.71 percent for all STEM workers. Thus, in both cases average hourly wages grew less than 1 percent a year from 2000 to 2012. What growth there has been in hourly wages for STEM workers mostly occurred from 2000 to 2007. There has been almost no hourly wage growth since 2007. Hourly wage growth of less than 1 percent an-nually for over a decade is certainly not the pattern we would expect to see if workers were in short supply.
$91,797 $88,048 $117,600 $99,141 $75,135 101,948 $90,067 $82,954 $89,174 $78,316
Working in Their Specific Field Working in Any STEM Job Working in Non-STEM job
$93,684 $88,718 $99,685 $107,803
Figure 7. Hourly Wages for STEM workers show little growth 2000-2012
Source: Public-use files of the 2000 to 2012 Current Population Surveys. Each year averages 12 months of data. Analysis confined to STEM workers with at least a bachelor’s degree age below age 65. Pareto-imputed mean values for top-coded weekly wages are from the “State of Working America”, 12th edition, Economic Policy Institute, p. 467. Pareto-imputed means for 2012 were provided by EPI sepa-rately. Figures for math tend to be more volatile because of small sample size.
$15 $20 $25 $30 $35 $40 2000 2001 2002 2003 2004 2005 2006 2007 2008 2009 2010 2011 2012
Average Hourly Wages for STEM Workers with Only a Bachelor's
Degree in 2012 Dollars
Engineering Technology All STEM Science $15 $20 $25 $30 $35 $40 $45 2000 2001 2002 2003 2004 2005 2006 2007 2008 2009 2010 2011 2012Average Hourly Wages for STEM Workers with a Bachelor's
Degree or Higher in 2012 Dollars
Mathematics Engineering Technology All STEM Science
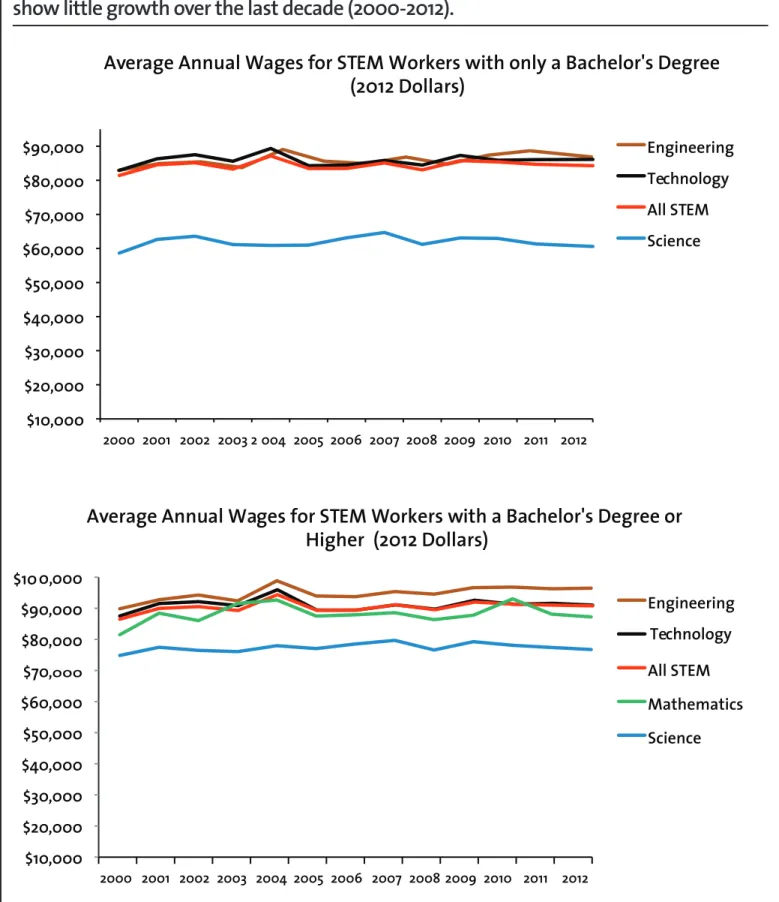
Annual Wages. Hourly wages have the advantage in comparison to annual earnings of controlling for hours worked. On the other hand, annual wages may be seen as providing a more complete picture of trends by reflecting what people are earning on a yearly basis. Figure 8 (next page) reports annual wages from 2000 to 2012 for full-time workers who worked for the entire year based on the ACS. Table A8 in the Appendix reports more detailed annual figures. Figure 8 and Table A8 show the same pattern as hourly wages from the CPS. Real annual wages for STEM workers with only bachelor’s degrees grew on average just 0.32 percent per year from 2000 to 2012 and 0.42 percentfor all STEM workers. In fact, all the growth was from 2000 to 2007. From 2007 to 2012, real annual wages actually declined slightly for STEM workers overall. Like the hourly data from the CPS, the lack of growth in annual earnings from the ACS strongly indicates that demand for STEM workers is not outstripping the supply of such workers, at least since 2000.
The Petroleum Engineer Exception. Some may wonder whether the ACS data is able to discern wage growth. In Table A8, we report annual earnings growth for petroleum, mining, and geological engineers, who should have benefited enormously from the massive increase in oil and gas production due to fracking in the United States during recent years. (We do not report hourly figures from the CPS because the sample of petroleum engineers is too small in that data source.) Real an-nual wages for this type of engineer with only an undergraduate degree were $46,000 higher in 2012 than 2000 — 14 times the $3,300 increase for all engineers with only undergraduate degrees. When those with graduate degrees are included, the increase was nearly $51,000 between 2000 and 2012. These findings are entirely consistent with what others have found for this type of engineer.28
This is a clear indication that increases in demand can drive up earnings in a STEM occupation. The laws of supply and de-mand apply to STEM worker wages just as they do to other things in the economy. It is also equally important to note that this finding indicates that Census Bureau data are able to capture an increase in wages. This makes the finding that wages for STEM workers grew modestly in the last decade all the stronger.
Wage trends show no shortage. Overall, the low hourly and annual wage growth for more than a decade indicates that de-mand for STEM workers in general is not particularly strong relative to supply. If it were, wages would be rising quickly, as they have for petroleum engineers. But Figures 7 and 8, along with Tables A7 and A8, show that STEM occupations have experienced a prolonged period of very modest wage increases, much less than 1 percent a year on average. In fact, in re-cent years wage growth has been virtually nonexistent. Like the employment data showing that there are many more STEM graduates than there are STEM jobs, trends in wages and earnings strongly indicate that the supply of workers is adequate to meet the demand.
Even though wage growth has been modest for STEM jobs, the goal of many employers is to keep wages in check by using immigration to increase the supply of workers. Alan Greenspan certainly has made this point. Speaking at a U.S. Treasury conference on U.S. Capital Markets Competitiveness in 2007, Greenspan argued that, “Our skilled wages are higher than anywhere in the world. If we open up a significant window for skilled guest workers, that would suppress the skilled-wage level and end the concentration of income.”29 Greenspan believes that reducing wages for skilled workers, including those
in STEM fields, has a number of desirable policy outcomes. Given how active many STEM employers have been in pushing for increases in immigration, they appear to agree with the former Federal Reserve chairman that immigration limits wage growth.
Measuring Wage Growth. With the very notable exception of petroleum engineers, STEM workers have generally experi-enced modest wage growth since 2000. However, some researchers have argued the contrary. Jonathan Rothwell of Brook-ing has made the case that STEM wages have, in fact, increased significantly. In a report arguBrook-ing the merit of the H-1B visa program, Rothwell and a colleague report that wage growth for U.S.-born workers has been “high” for some types of STEM workers. But inexplicably their analysis of wages is “not adjusted for inflation”. They even make a point of arguing that “nomi-nal wages” (not inflation adjusted) in computer occupations increased from 2000 to 2011 by “2.7 percent each year”.30 But this
almost exactly matches the inflation rate over this time period reported by the Bureau of Labor Statistics.31 Thus, there was no
wage growth once inflation is taken into account. Adjusting for inflation is a basic component of almost all economic analysis of this kind. Their decision not to incorporate inflation and then argue that wage growth has been “high” makes little sense.
Figure 8. Annual wages for STEM workers
show little growth over the last decade (2000-2012).
Source: Public-use files of the 2000 to 2012 American Community Surveys. Analysis confined to STEM workers with at least a bachelor’s degree under age 65, working 35 hours or more per week and at least 50 weeks a year. Figures for math tend to be more volatile because of small sample size.
$10,000 $20,000 $30,000 $40,000 $50,000 $60,000 $70,000 $80,000 $90,000 $100,000 2000 2001 2002 2003 2004 2005 2006 2007 2008 2009 2010 2011 2012
Average Annual Wages for STEM Workers with a Bachelor's Degree or
Higher (2012 Dollars)
Engineering All STEM Mathematics Science $10,000 $20,000 $30,000 $40,000 $50,000 $60,000 $70,000 $80,000 $90,000 2000 2001 2002 2003 2 004 2005 2006 2007 2008 2009 2010 2011 2012Average Annual Wages for STEM Workers with only a Bachelor's Degree
(2012 Dollars)
Engineering Technology All STEM Science Technologyin Figures 7 and 8 and Tables A7 and A8) it is not clear why Rothwell feels that relative wages are a key measure of labor demand.
It is true that STEM workers have done somewhat better than most non-STEM workers. For example, Table A7 shows that real hourly wages for all STEM workers increased 0.7 percent on average each year from 2000 to 2012 and 0.2 percent for all other workers with at least a bachelor’s degree. Table A8 shows that annual STEM wage growth averaged just 0.4 percent and non-STEM wages declined slightly. The underlying real wage growth is still less than 1 percent a year whether measured hourly and annually. A more reasonable interpretation of the data would be that wage growth has been weak for STEM and non-STEM occupation alike, rather than emphasize the relative difference. Long-term wage growth of less than 1 percent a year is certainly not evidence of a shortage, even if it is higher than for some other occupations.
Conclusion
The findings in this analysis are consistent with other examinations of the STEM labor market. We find no evidence of a general shortage of STEM workers. In 2012, there were more than twice as many people with STEM degrees (immigrant and native) as there were STEM jobs — 5.3 million STEM jobs vs. 12.1 million with STEM degrees. Only one-third of natives who have a STEM degree and hold a job do so in a STEM occupation. Further, one-third of STEM workers do not have a STEM degree, indicating that the supply of STEM workers in many cases is very flexible. Perhaps most important, real wages for almost all categories of STEM workers have shown only modest growth — both hourly and annual — for more than a decade. None of this is consistent with the idea that STEM workers are in short supply.
The number of immigrants with STEM degrees entering the country each year by itself is already more than all of the annual growth in STEM employment. Census Bureau data shows that over the last decade the number of STEM workers has grown on average by 84,000, while more than 129,000 new immigrants with STEM degrees have been allowed to settle in the coun-try each year. At the same time, the number of natives with STEM degrees is increasing by about 115,000 a year. These figures, coupled with the enormous number of STEM graduates already in the country not working in a STEM job, and the fact that many STEM jobs are done by workers without STEM degrees, calls into question the current level of STEM immigration. The large increases in STEM workers pushed by employers and many in Congress seem entirely divorced from what is actually going on in the U.S. labor market.
When formulating policy, elected representatives need to consider the actual conditions in the U.S. labor market, rather than simply responding to pressure from employers in industries that wish to hire large numbers of foreign STEM graduates. In general, STEM jobs still provide a good income and middle-class lifestyle. By allowing in many more immigrants than the labor market has been able to absorb, Congress is almost certainly holding down wage growth and reducing the incentive for native-born Americans to undertake the challenging course work that is often necessary for STEM careers. While employers may find this situation desirable, it is difficult to argue this is the interest of American people as a whole.
There may be a specific geographic area or a highly specialized field in which demand really is outstripping supply. However, it makes little sense to allow public policy to be driven by very narrow interests. If there is some special need in a highly tech-nical field then perhaps a narrowly focused immigration program is necessary. But overall, the data indicate that the supply of STEM workers vastly exceeds the number of STEM jobs, and there has been only modest wage growth in these profes-sions. This reality should inform and shape public policy moving forward.
End Notes
1 “Hard Time: College Majors, Unemployment and Earnings”, Georgetown University, 2013. Hal Salzman, Daniel Kuehn,
and B. Lindsay Lowell, “Guestworkers in the high-skill U.S. labor market: An analysis of supply, employment, and wage trends”, Economic Policy Institute, 2013. B. Lindsay Lowell and Hal Salzman, “Into the Eye of the Storm: Assessing the Evi-dence on Science and Engineering Education, Quality, and Workforce Demand”, Urban Institute, 2007. “Assuring the U.S. Department of Defense a Strong Science, Technology, Engineering, and Mathematics (STEM) Workforce”, National Research Council, 2012.
2 “EPI analysis finds no shortage of STEM workers in the United States”, Economic Policy Institute, press release, April 24,
2013.
3 Paul Solman,“The Bogus High-Tech Worker Shortage: How Guest Workers Lower US Wages”, PBS Newshour, July 24,
2013.
4 William P. Butz, Terrence K. Kelly, David M. Adamson, Gabrielle A. Bloom, Donna Fossum, and Mihal E. Gross, “Will the
Science and Technology Workforce Meet the Needs of the Federal Government”, Rand Corporation, 2004.
5 Daniel Maurath, “Domestic Prospects Shaded By H1-B Labor Condition Applications”, Bright Media Corporation, 2013. 6 Hal Salzman,“What Shortages? The Real Evidence about the STEM Workforce”, Issues in Science and Technology, Summer
2013.
7 Quoted in Science Insider, October 2009.
8 Michael S. Teitelbaum, “The Myth of the Science and Engineering Shortage”, The Atlantic, March 19, 2014. 9 Matt Egan, “Silicon Valley Goes to Washington to Take on Immigration Reform”, Fox News, March 27, 2014.
10 The Chamber’s immigration website provides a good overview of its views and efforts on immigration. The Business
Roundtable’s efforts and position on the issue can be found here.
11 The CBO has estimated the increases that the bill will create in temporary and permanent STEM workers in
“S. 744 Border Security, Economic Opportunity, and Immigration Modernization Act”.
12 H.R. 15, with 200 co-sponsors, it is very similar to the S.744 bill that has already passed the Senate. It contains a very large
increase in both skilled and unskilled immigration. Also introduced in the House is H.R. 714, which includes 50,000 new vi-sas for STEM workers; H.R.2131, which has 55,000 permanent vivi-sas for STEM workers and 90,000 new H-1B vivi-sas; and H.R. 1227 referred to as the STAPLE Act, which exempts STEM PhDs from H-1B numerical limitations among other changes designed to increase skilled immigration.
13 The ACS comes from the University of Minnesota’s IPUMS public-use data website. The CPS data come from the Census
Bureau’s Dataferrett public-use data website.
14 “STEM: Good Jobs Now and for the Future”, U.S. Department of Commerce Economics and Statistics Administration.
Issue Brief #03-11, 2011. David Beede, Tiffany Julian, David Langdon, George McKittrick, Beethika Khan, and Mark Doms, “Women in STEM: A Gender Gap to Innovation”, U.S. Department of Commerce, 2011. Some government statistics are con-fined to those over age 16, others are concon-fined to adults, and still others report figures for those 25 and older.
15 The ACS has consistent occupational codes 2000 to 2004, 2005 to 2009, and 2010 to 2012. Table A1 shows how the codes
and categories have changed.
17 Actuaries and architects are two occupations that could more reasonably be considered STEM, but are not considered
as such in most research or in this analysis. Architecture is a modestly sized profession, employing about 190,000 people equal to less than 5 percent of STEM occupations defined traditionally. On the other hand, the number of actuaries is small (~25,000) so its inclusion or exclusion would make little difference to this analysis.
18 It should be noted that if health care really is part of STEM, then there are also many more people with STEM degrees
that are not included in this or most other analyses, such as pre-med and nursing. These degrees are not considered STEM degrees because they are focused on practicing medicine, not research and development.
19 If we include everyone in STEM occupations, including those who have less than a bachelor’s degree, the total is 7.8 million. 20 Persons can select up to two undergraduate majors to report in the ACS. Throughout this report, we consider a person to
have a STEM undergraduate degree if at least one of the majors the person lists was in a STEM field.
21 This includes legal permanent residents, naturalized citizens, temporary workers, and illegal immigrants, but it does not
include those born in outlying territories (e.g. Puerto Rico) or those born abroad to American citizen parents.
22 The Department of Homeland Security estimates an undercount of post-1980 immigrants (foreign-born) in the ACS of
al-most 1.9 million or 5.8 percent. See Table 2 of “Estimates of the Unauthorized Immigrant Population Residing in the United States: January 2012”. We also know that the ACS undercounts STEM arrivals based on administrative data. For example ,the State Department’s Bureau of Consular Affairs reports more than 775,000 H1-B visas were issued 2007 to 2012. This does not include other temporary visa categories (e.g. L1, F1) in which a significant share of the applicants have STEM degrees, nor does it include new arrivals issued green cards (permanent immigration) who have STEM degrees.
23 The ACS is weighted to reflect the population as of July 1 of the year in which it was taken. Thus, the arrival figures for
2012 reflect the number of immigrants who reported in the survey that they have a STEM degree and entered January 2007 to the end of June 2012 and were still in the country in 2012 — a period of 5.5 years. The vast majority of these individuals arrived with an undergraduate STEM degree. We know this because 93 percent of these recent arrivals were over age 21. (The ACS asks questions making it easy to determine age at arrival.) Based on an analysis of the prior individual years of the ACS (2007 to 2011), there are only a tiny number of post-2007 arrivals living in the country in 2012 with STEM degree that did not have the degree when they arrived.
24 We can measure the growth in native-born STEM graduates using the 2009 ACS forward. As Table 1 shows, there were
a total of 8.761 million natives holding STEM degrees in 2012 (working and not working). In 2009, the number was 8.417 million — a growth of roughly 345,000. Thus, annual growth averaged slightly less than 115,000 over the last three years.
25 Table A6 in the Appendix reports the same figures for individuals with only bachelor’s degrees.
26 In 2012, 59 percent of those with a STEM degree had only a bachelor’s degree. Of those in STEM jobs, 69 percent had only
a bachelor’s degree.
27 In this analysis, doctors are defined as physicians and surgeons (MDs), podiatrists, dentists, and optometrists. Roughly
two-thirds of doctors defined in this way have a STEM undergraduate degree. If we include doctors, then the average an-nual wage for all STEM degree holders in non-STEM jobs is $100,361. This is a good deal higher than the $90,067 for STEM degree holders in non-STEM jobs when doctors are excluded, as shown in Figure 6.
28 Leonard Lynn, Hal Salzman, and Daniel Kuehn, “Dynamics of Engineering Labor Markets: Petroleum Engineering and
Responsive Supply”, conference paper presented at “U.S. Engineering in the Global Economy”, sponsored by the Alfred P. Sloan Foundation and the National Bureau of Economic Research, September 26-27, 2011.
29 Bloomberg News, “Greenspan: Let more skilled immigrants in”, March 14, 2007.
on itself because of the concept of compound interest. The BLS inflation calculator shows that inflation was 30.6% in from 2000 to 2011.
32 As part of an online debate in March of this year, sponsored by the Information Technology & Innovation Foundation,
Jonathan Rothwell presented a PowerPoint entitled “The Shortage of STEM Skills”. In the PowerPoint Rothwell reports rela-tive wage growth to make the case that STEM workers are in short supply. The entire debate can be found here. His Power-Point is here.
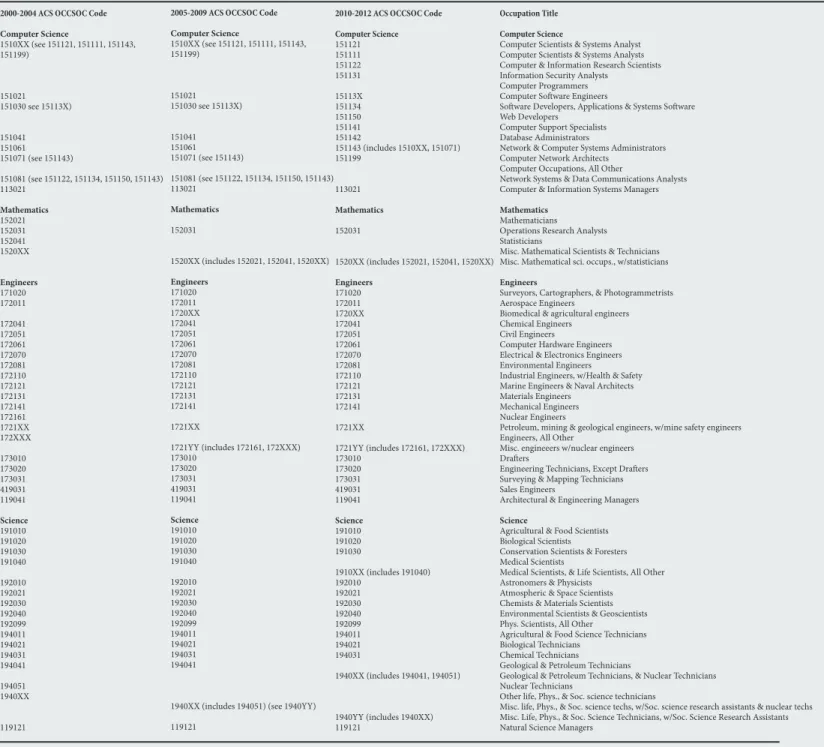
Table A1. STEM Occupations in the American Community Survey
Source: Code book from Integrated Public Use Microdata Series (IPUMS) website. IPUMS code book has been corrected for error dealing with occupation 172XXX in years 2000 to 2004.
2000-2004 ACS OCCSOC Code
Computer Science 1510XX (see 151121, 151111, 151143, 151199) 151021 151030 see 15113X) 151041 151061 151071 (see 151143) 151081 (see 151122, 151134, 151150, 151143) 113021 Mathematics 152021 152031 152041 1520XX Engineers 171020 172011 172041 172051 172061 172070 172081 172110 172121 172131 172141 172161 1721XX 172XXX 173010 173020 173031 419031 119041 Science 191010 191020 191030 191040 192010 192021 192030 192040 192099 194011 194021 194031 194041 194051 1940XX 119121
2005-2009 ACS OCCSOC Code
Computer Science 1510XX (see 151121, 151111, 151143, 151199) 151021 151030 see 15113X) 151041 151061 151071 (see 151143) 151081 (see 151122, 151134, 151150, 151143) 113021 Mathematics 152031 1520XX (includes 152021, 152041, 1520XX) Engineers 171020 172011 1720XX 172041 172051 172061 172070 172081 172110 172121 172131 172141 1721XX 1721YY (includes 172161, 172XXX) 173010 173020 173031 419031 119041 Science 191010 191020 191030 191040 192010 192021 192030 192040 192099 194011 194021 194031 194041
1940XX (includes 194051) (see 1940YY) 119121
2010-2012 ACS OCCSOC Code Computer Science 151121 151111 151122 151131 15113X 151134 151150 151141 151142 151143 (includes 1510XX, 151071) 151199 113021 Mathematics 152031 1520XX (includes 152021, 152041, 1520XX) Engineers 171020 172011 1720XX 172041 172051 172061 172070 172081 172110 172121 172131 172141 1721XX 1721YY (includes 172161, 172XXX) 173010 173020 173031 419031 119041 Science 191010 191020 191030 1910XX (includes 191040) 192010 192021 192030 192040 192099 194011 194021 194031 1940XX (includes 194041, 194051) 1940YY (includes 1940XX) 119121 Occupation Title Computer Science
Computer Scientists & Systems Analyst Computer Scientists & Systems Analysts Computer & Information Research Scientists Information Security Analysts
Computer Programmers Computer Software Engineers
Software Developers, Applications & Systems Software Web Developers
Computer Support Specialists Database Administrators
Network & Computer Systems Administrators Computer Network Architects
Computer Occupations, All Other
Network Systems & Data Communications Analysts Computer & Information Systems Managers
Mathematics
Mathematicians Operations Research Analysts Statisticians
Misc. Mathematical Scientists & Technicians Misc. Mathematical sci. occups., w/statisticians
Engineers
Surveyors, Cartographers, & Photogrammetrists Aerospace Engineers
Biomedical & agricultural engineers Chemical Engineers
Civil Engineers
Computer Hardware Engineers Electrical & Electronics Engineers Environmental Engineers
Industrial Engineers, w/Health & Safety Marine Engineers & Naval Architects Materials Engineers
Mechanical Engineers Nuclear Engineers
Petroleum, mining & geological engineers, w/mine safety engineers Engineers, All Other
Misc. engineeers w/nuclear engineers Drafters
Engineering Technicians, Except Drafters Surveying & Mapping Technicians Sales Engineers
Architectural & Engineering Managers
Science
Agricultural & Food Scientists Biological Scientists
Conservation Scientists & Foresters Medical Scientists
Medical Scientists, & Life Scientists, All Other Astronomers & Physicists
Atmospheric & Space Scientists Chemists & Materials Scientists Environmental Scientists & Geoscientists Phys. Scientists, All Other
Agricultural & Food Science Technicians Biological Technicians
Chemical Technicians
Geological & Petroleum Technicians
Geological & Petroleum Technicians, & Nuclear Technicians Nuclear Technicians
Other life, Phys., & Soc. science technicians
Misc. life, Phys., & Soc. science techs, w/Soc. science research assistants & nuclear techs Misc. Life, Phys., & Soc. Science Technicians, w/Soc. Science Research Assistants Natural Science Managers
Table A2. Undergraduate Degrees
Considered to Be STEM in the 2012 ACS
Source: Code book from Integrated Public Use Microdata Series (IPUMS) website. Technology Degrees
Census Code
2100 Computer & Information Systems 2101 Computer Programming & Data Processing 2102 Computer Science
2105 Information Sciences
2106 Computer Admin. Management & Security 2107 Computer Networking & Telecom. Mathematics Degrees
Census Code
3700 Mathematics 3701 Applied Mathematics 3702 Statistics & Decision Science 4005 Mathematics & Computer Science
Engineering Degrees Census Code 2400 General Engineering 2401 Aerospace Engineering 2402 Biological Engineering 2403 Architectural Engineering 2404 Biomedical Engineering 2405 Chemical Engineering 2406 Civil Engineering 2407 Computer Engineering 2408 Electrical Engineering
2409 Enging. Mechanics Physics & Science 2410 Environmental Engineering
2411 Geological & Geophysical Engineering 2412 Industrial & Manufacturing Engineering 2413 Materials Enging.& Materials Science 2414 Mechanical Engineering
2415 Metallurgical Engineering 2416 Mining & Mineral Engineering
2417 Naval Architecture & Marine Engineering 2418 Nuclear Engineering
2419 Petroleum Engineering 2499 Miscellaneous Engineering 2500 Enging.Technologies
2501 Enging.& Industrial Management 2502 Electrical Enging.Technology 2503 Industrial Production Technologies 2504 Mechanical Enging.Related Technologies 2599 Miscellaneous Enging.Technologies 3801 Military Technologies Science Degrees Census Code 1103 Animal Sciences 1104 Food Science
1105 Plant Science & Agronomy 1106 Soil Science 1301 Environmental Science 3600 Biology 3601 Biochemical Sciences 3602 Botany 3603 Molecular Biology 3604 Ecology 3605 Genetics 3606 Microbiology 3607 Pharmacology 3608 Physiology 3609 Zoology 3611 Neuroscience 3699 Miscellaneous Biology 4002 Nutrition Sciences 4003 Neuroscience
4006 Cognitive Science & Biopsychology
5102 Nuclear, Radiology, & Biological Technologies 5000 Physical Sciences
5001 Astronomy & Astrophysics
5002 Atmospheric Sciences & Meteorology 5003 Chemistry
5004 Geology & Earth Science 5005 Geosciences
5006 Oceanography 5007 Physics
Table A3. Number of Native STEM Workers with Technology
Degrees by Detailed Occupation 2012
Occupation
Cmm-Software Developers, Applications & Sys. Software Cmm-Computer Programmers
Mgr-Computer & Information Sys. Managers Cmm-Computer Sys. Analysts
Cmm-Computer Support Specialists Cmm-Computer Occups, All Other Cmm-Network & Computer Sys. Admins. Cmm-Web Developers
Cmm-Computer Network Architects Cmm-Database Admins.
Cmm-Information Security Analysts Eng-Misc. Engs., w/ Nuclear Engs. Cmm-Operations Research Analysts Eng-Computer Hardware Engs. Eng-Engineering Techs., Except Drafters Eng-Civil Engs.
Cmm-Computer & Information Research Scientists Eng-Aerospace Engs.
Mgr-Architectural & Engineering Managers Eng-Electrical & Electronics Engs. Sci-Physical Scientists, All Other Eng-Industrial Engs., w/ Health & Safety Sci-Chemists & Materials Scientists Eng-Mechanical Engs.
Sal-Sales Engs.
Cmm-Misc. Mathematical Sci. Occups Eng-Drafters
Eng-Biomedical & Agricultural Engs.
Sci-Medical Scientists, & Life Scientists, All Other Eng-Surveyors, Cartographers, & Photogrammetrists Eng-Materials Engs.
Sci-Chemical Techs.
Sci-Misc. Life, Physical, & Soc. Sci. Techs. Sci-Agricultural & Food Scientists Sci-Biological Scientists
Eng-Marine Engs. & Naval Architects Sci-Biological Techs.
Eng-Chemical Engs.
Eng-Petroleum, Mining & Geological Engs., w/ Mining Safety Engs. Sci-Geological & Petroleum Techs., & Nuclear Techs. *
Eng-Surveying & Mapping Techs.
Total
Percent of Natives with Tech. Degree in Occupation 27.5 16.0 10.3 8.7 8.6 6.5 4.8 3.3 2.2 2.2 1.9 1.3 1.2 .6 .5 .5 .5 .5 .5 .5 .3 .2 .2 .2 .1 .1 .1 .1 .1 .1 .1 .1 .0 .0 .0 .0 .0 .0 .0 .0 .0 100.0 Number 165,799 96,483 61,821 52,649 51,815 39,135 29,018 19,944 13,344 13,331 11,175 7,960 7,030 3,804 3,102 3,050 2,995 2,913 2,891 2,888 2,017 1,504 1,135 1,025 894 842 615 602 528 398 329 304 282 274 225 191 83 79 66 51 46 602,637
Source: Public-use files of the 2012 American Community Survey. Analysis confined to native-born STEM workers with a bachelor’s degree or higher. Prefix shows occupational category: Sci. stands for science; Eng. stands for engineering; Cmm. stand for computer science (technology) and math; Sal. stands for sales; and Mgr. stands for management.
Table A3 Cont. Number of Native STEM Workers with Math
Degrees by Detailed Occupation 2012
Occupation
Cmm-Software Developers, Applications & Sys. Software Cmm-Computer Programmers
Mgr-Computer & Information Sys. Managers Cmm-Computer Sys. Analysts
Cmm-Misc. Mathematical Sci. Occups Cmm-Computer Occups, All Other Eng-Misc. Engs., w/ Nuclear Engs. Cmm-Computer Support Specialists Cmm-Operations Research Analysts Sci-Physical Scientists, All Other Cmm-Network & Computer Sys. Admins. Cmm-Web Developers
Eng-Aerospace Engs. Cmm-Database Admins. Eng-Civil Engs.
Cmm-Computer Network Architects
Sci-Medical Scientists, & Life Scientists, All Other Mgr-Architectural & Engineering Managers Eng-Industrial Engs., w/ Health & Safety Eng-Electrical & Electronics Engs. Sci-Misc. Life, Physical, & Soc. Sci. Techs Eng-Engineering Techs., Except Drafters Sci-Environmental Scientists & Geoscientists Sci-Biological Scientists
Eng-Mechanical Engs.
Sci-Chemists & Materials Scientists Eng-Computer Hardware Engs. Mgr-Natural Sci.s Managers Eng-Drafters
Sci-Astronomers & Physicists
Cmm-Computer & Information Research Scientists Eng-Surveyors, Cartographers, & Photogrammetrists Sci-Atmospheric & Space Scientists
Cmm-Information Security Analysts Sal-Sales Engs.
Eng-Biomedical & Agricultural Engs.
Eng-Petroleum, Mining & Geological Engs., w/ Mining Safety Engs. Eng-Materials Engs.
Eng-Chemical Engs. Eng-Environmental Engs. Sci-Agricultural & Food Scientists Eng-Surveying & Mapping Techs. Sci-Chemical Techs.
Eng-Marine Engs. & Naval Architects
Total
Percent of Natives with Math Degree in Occupation 22.0 14.4 10.5 10.2 6.3 4.2 3.0 2.9 2.3 2.3 2.2 2.1 1.7 1.6 1.3 1.2 1.0 1.0 .9 .8 .7 .7 .6 .5 .5 .5 .5 .5 .4 .4 .4 .4 .4 .3 .2 .2 .2 .1 .1 .1 .1 .1 .0 .0 100.0 Number 27,104 17,785 12,940 12,619 7,732 5,210 3,719 3,626 2,849 2,778 2,742 2,620 2,044 1,982 1,550 1,462 1,254 1,225 1,146 938 872 814 787 676 671 600 563 555 519 506 501 443 434 409 302 221 202 151 145 144 112 96 60 52 123,160
Source: Public-use files of the 2012 American Community Survey. Analysis confined to native-born STEM workers with a bachelor’s degree or higher. Prefix shows occupational category: Sci. stands for science; Eng. stands for engineering; Cmm. stand for computer science (technology) and math; Sal. stands for sales; and Mgr. stands for management.
Table A3 Cont. Number of Native STEM Workers with
Engi-neering Degrees by Detailed Occupation 2012
Occupation
Eng-Misc. Engs., w/ Nuclear Engs. Eng-Civil Engs.
Cmm-Software Developers, Applications & Sys. Software Eng-Mechanical Engs.
Eng-Electrical & Electronics Engs. Mgr-Architectural & Engineering Managers Eng-Aerospace Engs.
Eng-Industrial Engs., w/ Health & Safety Mgr-Computer & Information Sys. Managers Eng-Chemical Engs.
Cmm-Computer Programmers Cmm-Computer Sys. Analysts
Eng-Petroleum, Mining & Geological Engs., w/ Mining Safety Engs. Cmm-Computer Support Specialists
Eng-Engineering Techs., Except Drafters Eng-Materials Engs.
Eng-Environmental Engs. Cmm-Computer Occups, All Other Sci-Physical Scientists, All Other Eng-Drafters
Eng-Computer Hardware Engs. Sal-Sales Engs.
Cmm-Network & Computer Sys. Admins. Eng-Biomedical & Agricultural Engs. Cmm-Computer Network Architects Cmm-Operations Research Analysts Eng-Marine Engs. & Naval Architects
Eng-Surveyors, Cartographers, & Photogrammetrists Cmm-Database Admins.
Cmm-Web Developers
Sci-Environmental Scientists & Geoscientists Sci-Misc. Life, Physical, & Soc. Sci. Techs. Sci-Medical Scientists, & Life Scientists, All Other Cmm-Information Security Analysts
Sci-Chemists & Materials Scientists Sci-Chemical Techs.
Sci-Astronomers & Physicists Mgr-Natural Sci.s Managers Eng-Surveying & Mapping Techs. Sci-Agricultural &