Clemson University
TigerPrints
All Theses Theses
5-2009
TESTING THE INDIVIDUAL EFFECTIVE
DOSE HYPOthesis
Hung Vu
Clemson University, [email protected]
Follow this and additional works at:https://tigerprints.clemson.edu/all_theses Part of theEnvironmental Sciences Commons
This Thesis is brought to you for free and open access by the Theses at TigerPrints. It has been accepted for inclusion in All Theses by an authorized administrator of TigerPrints. For more information, please [email protected].
Recommended Citation
Vu, Hung, "TESTING THE INDIVIDUAL EFFECTIVE DOSE HYPOthesis" (2009).All Theses. 566. https://tigerprints.clemson.edu/all_theses/566
TESTING THE INDIVIDUAL EFFECTIVE DOSE HYPOTHESIS
A Thesis Presented to the Graduate School of
Clemson University
In Partial Fulfillment
of the Requirements for the Degree Master of Science
Environmental Toxicology
By
Hung Thi Hong Vu May 2009
Accepted by
Dr. Stephen J. Klaine; Committee Chair, Dr. Cindy M. Lee
ABSTRACT
The assumption of the individual effective dose is the basis for the probit method used for analyzing dose or concentration- response data. According to this assumption, each individual has a uniquely innate tolerance expressed as the individual effective dose (IED) or the smallest dose that is sufficient to kill it. An alternative to IED, stochasticity suggests that individuals do not have uniquely innate tolerance; deaths result from random processes occurring among similar individuals. While the probit method has been used extensively in toxicology the underlying assumption has not been tested rigorously. The goal of this study was to test which assumption, IED or stochasticity, best explained the response of Daphnia magna exposed to multiple pulses of copper sulfate (CuSO4)
over 24-d. Daphnia magna were exposed to subsequent age-dependent 24-h LC50 Cu
concentrations. Age-dependent 24-h LC50 values were determined prior to the 24-d bioassay. These LC50 values were inversely related to organism age. A Cu depuration test was conducted to determine time between Cu exposures. Results indicated that five days was sufficient for D. magna to depurate accumulated Cu and recover from previous
exposure. Hence, recovery time between Cu exposures during the 24-d test was five days. The Cu depuration of D. magna did not depend on age or Cu concentration. Daphnia magna were exposed to four 24-h Cu exposures each separated by five days during the
24-d bioassay. Surviving organisms were transferred after each exposure to Cu-free culture media for recovery time before the next exposure. Stochasticity best explained the survival and reproduction response of D.magna exposed to Cu.
DEDICATION
This work is dedicated to all people in my family. This dissertation exists because of their love and encouragement.
I would also like to dedicate this to my fiancé who provided me with love, support, and all-important stress-relief.
ACKNOWLEGEMENTS
I would like to thank my advisor, Dr. Stephen J. Klaine, for his guidance, encouragement, and education through courses. I am also grateful to Dr. Cindy M. Lee for her education through courses and evaluating my thesis. I also would like to thank Dr. Hoang C. Tham for his support and suggestions for my research.
I would like to thank all my labmates for their selfless help and friendships. Holly Zahner and Joe Bisesi did help me a lot with my experiment.
I acknowledge the Vietnam Education Foundation for partial funding of my research.
TABLE OF CONTENTS
Page
TITLE PAGE ……….………...i
ABSTRACT...ii
DEDICATION...iii
ACKNOWLEGEMENTS...iv
TABLE OF CONTENTS...v
LIST OF FIGURES ...vi
LIST OF TABLES...vii
CHAPTER...1
1111111. LITERATURE REVIEW ...1
Individual effective dose hypothesis and stochasticity hypothesis...1
Pulsed exposure ...3
Copper in the aquatic environment and toxicity...8
Daphnia magna...16
1111112. TESTING THE INDIVIDUAL EFFECTIVE DOSE...20
Introduction...20
Materials and methods ...22
Results...27
Discussion...35
Conclusions...39
APPENDICES ...41
A. Water chemistry data ...42
B. Biological data ...48
LIST OF FIGURES
Figure Page
Figure 1. 24-h nominal LC50 as a function of organism weight ...30
Figure 2. Copper body burden of treated and control organisms as a function of recovery time. ...31
Figure 3. Cu and Na body burden as functions of recovery time. ...32
Figure 4. Change in Cu body burden during recovery period. ...33
Figure 5. Percent survival of D.magna population during 24-d bioassay. ...34
Figure 6. Accumulative reproduction for D. magna at the end of each exposure period...34
LIST OF TABLES
Table Page
Table 1. Estimated age dependent 24-hLC50 ...29
Table 2. Water chemistry data for ≤24-h LC50 test. ...42
Table 3. Water chemistry data for 6d-LC50 test...42
Table 4. Water chemistry data for 12-d LC50 test...43
Table 5. Water chemistry data for 18-d LC50 test...43
Table 6. Water chemistry data for neonate copper depuration test...44
Table 7. Water chemistry data for juvenile copper depuration test. ...44
Table 8. Water chemistry data for adult copper depuration test. ...45
Table 9. Water chemistry data for the first exposure in 24-d bioassay...45
Table 10. Water chemistry data for the second exposure in 24-d bioassay...46
Table 11. Water chemistry data for the third exposure in 24-d bioassay. ...46
Table 12. Water chemistry data for the fourth exposure in 24-d bioassay. ...47
Table 13. Copper burden data for neonate depuration test (µg Cu/g dry wt). ...48
Table 14. Copper burden data for juvenile depuration test (µg Cu/g dry wt)...48
Table 15. Copper burden data for adult depuration test (µg Cu/g dry wt). ...48
Table 16. Survival data for 24-d bioassay (number of surviving daphnids)...49
CHAPTER ONE
CHAPTER
1111111. LITERATURE REVIEW
Individual effective dose hypothesis and stochasticity hypothesis
The individual effective dose (IED) is the basis for probit analysis widely used to characterize dose or concentration- response data and generate metrics such as LC50 values. The IED concept was first discussed by Bliss [1] and later called the individual effective dose or individual tolerance hypothesis depending on the exposure method (e.g. chemical is injected into the organism versus organism is exposed in the medium)[2]. According to this hypothesis, each individual has uniquely innate tolerance to a contaminant expressed as the IED - the smallest dose sufficient to kill it [1]. The IED values among individuals in population usually exhibit a lognormal distribution, requiring a logarithmic transformation of dosage to convert it to a normal distribution [3] suitable for fitting quantal data by the probit method [4][5]. The probit approach has been used extensively in toxicology but the underlying assumption has not been rigorously tested. Several explanations for the lack of experimental data on this fundamental concept have been discussed in the literature. First, in the context of early toxicology assays, the hypothesis was introduced mainly to support the application of the lognormal model in fitting dose-response data [2]. Hence, it was initially used as an explanation and not a justification. Second, toxicologists have been interested in finding if the lognormal or a log-logistic model is better for analyzing dose-response data [6]. Third, there is genetic evidence to support the differences in susceptibility to toxicants among individuals [2]. Finally, many toxicology tests traditionally focused on the effects of toxicant on
individuals rather than population consequences [2] with fixed concentration and for predetermined duration while the organisms need to be re-challenged to test the IED hypothesis.
Another alternative explanation for the lognormal model is a stochastic hypothesis that suggests the risk of dying is the same for all individuals receiving the same dose and that mortality occurs randomly [6]. The major difference between two hypotheses is that the variation in response is (IED) or is not (stochasticity) determined predominantly by unique qualities of the individuals [2]. Stochasticity was initially supported by Berkson in 1951[7]. Candidate aviators were tested for their tolerance to high altitude and the results showed that the tolerance varied from trial to trial suggesting that the IED did not explain the results. Gaddum [5] described a random process in which several “hits” were required to cause death at the site of action that resulted in lognormal mortality. The ability of IED or stochasticity to explain dose-response data has been a focus of recent research. Newman and McCloskey [6] tested the two hypotheses by two types of experiments. In the first experiment, time to stupefaction (TTS) of zebra fish exposed to benzocaine was measured in five separate trials. They reported that no consistent temporal trends in tolerance were apparent among trials and that the IED hypothesis was supported with a minor stochastic component being present. In the second experiment, mosquitofish were exposed to sublethal and lethal sodium chloride (NaCl) and pentachlorophenol (PCP) concentrations until a large portion of lethally exposed fish died. Fish surviving from both groups were allowed to recover and subsequently exposed to another lethal toxicant concentration. In contrast to the first experiment, the second one provided no support for
IED hypothesis. Zhao and Newman [8] also found that stochastic processes better explained data for copper sulfate (CuSO4) and sodium pentachlorophenol (NaPCP)
toxicity to amphipods (Hyallella azteca).
However, there were several factors that could influence toxicity such as animal age, sex, and size that should be considered but were ignored in previous studies. These previous studies controlled size and sex but did not take into account the impact of organism age. Furthermore, most of previous the studies used double pulsed exposure experiments in which organism exposure to the toxicant was only a very short portion of its lifespan. Even Newman and McCloskey’s [6] research with zebra fish only exposed the organisms for a small fraction of its life cycle (1 month out of 3 yrs) [9].
Pulsed exposure
Concentration of contaminants entered aquatic ecosystem through spills, surface runoff, discharge of industrial effluent, and application of agrochemicals often vary with time; the concentration is highest right after entry into waterway and then may reduce to low or nondetectable levels [10]. Therefore, aquatic organisms may experience multiple-pulse exposure to toxicant. The episodic characteristic of aquatic contaminants has been of concern for decades [11-13] and subject to recent study [14-17]. There are several factors that are important in studying intermittent contaminant exposure including contaminant of concern (i.e., organic vs. inorganic), magnitude of contaminant concentration, duration, pulse frequency, recovery time between sequential exposures. The effects of one factor or the relative relationship among factors on toxicity of a
contaminant to aquatic organisms have been studied extensively in literature. Two types of pollutant have been well documented in literature are pesticides [10, 18-20] and metals [13-16, 21] because of their episodic characteristics in aquatic ecosystem. Contaminant concentration and exposure duration are important factors and the effect of either one or both on toxicity of a contaminant to aquatic organisms have been characterized in early episodic contaminant studies [10, 11, 13, 20]. Most of studies showed the inadequacy of the conventional toxicity test in predicting the effect of a toxicant on organisms in real environments in which brief exposure may be sufficient for the toxicant to cause death of exposed organisms even if they are maintained in clean water subsequently. This results in the fact that the duration of exposure which will cause certain percent of mortality (i.e., 50%) is far less than is indicated by a conventional toxicity test in which animals are continuously exposed to the toxicant [11, 13]. Several early studies of episodic exposure reported that intermittent exposure was more toxic than continuous exposure or that there was no significant difference [10, 21-24]. However, more indepth investigations should be done in these studies to consider the modes of action of toxicants, kinetics of uptake and elimination or the role of intervals. The intervals in all aforementioned studies were often short so that they may be not sufficient for the animal to recover from the exposure. Naddy et al. [18] evaluated the effect of binary combinations of concentration and duration of organophosphate insecticide chlorpyrifos (CPF) exposure to D.magna and
reported that CPF concentration was a greater determining factor of CPF toxicity to
D.magna than exposure duration and that the relationship between concentration and
duration resulting in a 50% response in survival was 6.5 h at 1.0 mg/L, 12.2 h at 0.5 mg/L, and 48 h at 0.25 mg/L). Recently, Hoang et al. [14] investigated relative individual effects of concentration and pulsed duration on toxicity of four metals (Cu, Zn, Se, and As) to D. magna. Their results showed that depending on the metal of concern, exposure
duration may have stronger, equal or weaker effect than concentration. With that result they suggested that the common method using area under the curve (AUC = concentration x duration) may not always be accurate in estimating environmental risk from metal.
The impact of the interval in multiple-exposure has been studied latter than that of concentration and duration [14, 16-19]. Early studies in episodic exposure [11, 12, 25] suggested that an organism may have opportunities to recover during the interval period between pulses. Studies of the effect of interval on the toxicity of both organic [17, 19] and inorganic [14, 17, 26] toxicants have shown that multiple pulse exposures are less toxic than continuous exposures due to the ability of organism to recovery from exposure given that there is adequate time for recovery between exposures. Several factors influencing recovery time include toxicant of concern, concentration of toxicant [19], tested organism, test conditions (e.g., with or without food) [27], and measured endpoint (e.g., mortality, reproduction or growth) [28]. Higher exposure concentrations will have greater effects on organisms [14, 18], and therefore, will require longer recovery time [19, 28]. Naddy and Klaine [19] found that at least a 72-h interval was needed for D. magna to recover from 0.5 µg/L CPF, while a 96-h interval was needed at 1.0 µg/L CPF.
to eliminate toxicant and require different intervals for recovery. Also tested with D. magna as in the experiment by Naddy and Klaine [19] but using different toxicant (Cu),
Hoang [28] found that 48 h was long enough for D.magna to completely recover from a
12 h exposure to 32 µg/L Cu while an interval of 192 h or longer was needed for
D.magna to recover from 12 h exposure to 48 and 64 µg/L Cu, respectively. Zhao and
Newman [17] also found that the amphipods (Hyalella azteca) required fivefold longer
recovery times for CuSO4 than for NaPCP. Using different measured endpoints
(mortality, reproduction or growth) may result in different required recovery times since organisms have the ability to allocate energy for different purposes such as survival, reproduction or growth [29]. Hoang [28] reported that when using reproduction endpoint, 24 h was long enough for D. magna to completely recover while with mortality endpoint
a longer time was required. Different organisms used in test will need different intervals. For example, Zhao and Newman [17] and Hoang [28] studied the effect of interval length with the same toxicant but with different species in the same Crustacea class; Hyalella azteca and D.magna, respectively. The exposure duration was the same in two studies
(12-h exposure) but Zhao and Newman [17] found that Hyalella azteca needed 83 ± 3 h
to completely recover between exposures whereas Hoang [28] showed that D.magna
needed 192-h interval even though the nominal Cu concentration in Hoang’s study was much lower than that of Zhao and Newman, 48 and 1,100 µg/L Cu, respectively. Diamond et al. [16] also demonstrated that crustacean exhibited less mortality as two Cu pulses were separated further apart while fish were equally or more affected with longer recovery times between Cu pulses. Test conditions may also affect the recovery time
between exposures. Naddy [27] observed that the presence of food altered the toxicity of CPF to D.magna.
Like interval, the effect of exposure frequency on the toxicity of contaminants to aquatic organisms has been considered latter on in episodic studies [16, 19, 26]. Milne et al. [26] studied the sublethal effects of exposure frequency on brown trout exposed to ammonia and reported that growth, gill condition, organ weights, and hematocrit were all significantly affected by high exposure frequency. However, in the experiment by Milne et al. [26], the exposure duration was constant resulting in the organisms exposed to higher frequency having longer total exposure time. This factor was controlled by Naddy and Klaine [19] by exposing D.magna to CPF with higher frequency and lower duration
so that the total exposure time was held constant. Under such experimental condition, they reported that CPF toxicity was reduced by exposing D.magna to shorter but more
frequent pulses [19]. From mentioned above studies, we notice that in episodic studies all factors (concentration, duration, intervals, and frequency) are important and are related to with each other. Very rarely do studies in intermittent exposures consider all factors. One exception is the study by Diamond et al. [16] in which they examined a range of magnitudes, durations, frequency, and recovery time periods between pulses for three different contaminants (Cu, Zn, and ammonia) and two indicator test species (Pimephales promelas and D. magna). With that extensive study, they suggested that chronic water
quality criteria and effluent permit limits, expressed as a 4-d or 30-d average concentration, respectively, may not be appropriate for protecting against effects of
pulsed exposures, depending on the frequency, magnitude, and duration of pulses, as well as the recovery period between events.
Copper in the aquatic environment and toxicity Sources and concentrations
Copper is an abundant trace element found in various types of rocks and mineral, the average abundance of Cu in the earth’s crust is 68 ppm [30]. Copper occurs in most natural waters at relatively low concentrations and the Cu level in river water is often higher than in seawater [31]. The world median concentration of Cu is 3 µg/L, ranging from 0.2 to 30 µg/L in uncontaminated fresh-water system, 0.03 to 0.23 µg/L in surface seawater, 0.2 to 0.69 µg/L in deep seawater [32], and less than 100 µg /L in ground water [30]. However, ambient Cu concentrations may vary significantly among locations and at different times within a given locations because of the differences in land use, geology, and climate [33-35]. Buhler [33] reported that the mean total Cu concentration in rivers in the United States is 15 µg/L but the range is from 1 to 250 µg/L.
Copper compounds have been used widely in many industrial activities and in agriculture. The annual world production of Cu has increased rapidly, 5.8 x 10⁹ kg in 1968, 8.3 x 10⁹ kg in 1985 [32] to more than 17.9 109 kg in 2007 [36]. Natural input of copper to aquatic environment is primarily from soils and mineral deposits by the erosional action of water [34]. Anthropogenic activities by which Cu enters aquatic environment include smelting, mining, industrial and domestic waste emission, as well as the applications of fertilizers and pesticides [32]. Copper from anthropogenic sources can
be directly released to the aquatic environment or emitted to the atmosphere and then deposited (dry or wet) on to the land surface and aquatic ecosystem [28].
Copper levels in the water column of lakes are generally lower than in the sediment since Cu is removed from water to sediment by natural purification processes including chemical complexation, precipitation, and adsorption [32]. Background Cu levels in uncontaminated freshwater sediments range from 0.8 to 50 mg/kg sediment dry weight [37]. Elevated Cu levels in surface water and sediment have been documented in the literature. Lopez and Lee [38] reported Cu levels of 100 µg/L in surface water and 3,860 mg/kg in sediment in Torch Lake, Michigan, a lake receiving mine tailing discharge. Lake Monona, Wisconsin, received over 1.5 x 10⁶ pounds of copper sulfate in over 50 yr to control excessive algal growth resulting in Cu concentration in the water column of about 3 µg/L but Cu levels in the sediment ranged from 250 to 650 mg/kg [39]. Average copper concentrations in sediment in Milltown Reservoir, a reservoir that trapped sediments from upstream mining activities over 100 years, ranged from 83 mg/kg to more than 5,000 mg/kg [40]. According to Hall et al. [41], Cu concentration in surface water of Chesapeake Bay has increased from background level to 72 µg/L.
Aqueous environmental chemistry of copper
Cu is the first element in group IB in the periodic table, it has an atomic number of 29, an atomic weight of 63.54. Copper is an intermediate Lewis acid, highly reactive with both soft and hard bases. In the environment, Cu is relatively partitioned into three phases: aqueous (free ionic and soluble complex); solid (particulates, colloids, soils, and
sediments); and biological (adsorbed and incorporated) [32][32]. Copper has been isolated in the I, II, and III oxidation states; however, copper (II) is the normal oxidation state for soluble aqueous complexes. Insoluble aqueous complexes of Cu (I) are quite stable. Complexes of Cu (III) are few in number and unstable in aqueous environment [42]. Therefore, the most important aspects of the aqueous chemistry of Cu belong to Cu (II) compound [43]. Processes that control levels of Cu in solution, its conversion into various forms, its mobility in aquatic environment and its availability to biota are complexation, precipitation, and adsorption [32, 34].
Complexation is one of the important mechanisms controlling the form and concentration of dissolved Cu. The two major inorganic complexing ligands in most natural waters, particularly fresh waters, are hydroxyl (OH-) and carbonate (CO32-) ion.
The common inorganic Cu complexes include Cu hydrolysis products (CuOH+, Cu(OH)2o, Cu2(OH)22+) and carbonate complex ions (CuCO3o, Cu(CO3)22-) [44, 45]. The
predominant hydroxyl- or carbonate-Cu species in aqueous environment depends on pH and water hardness [32]. Ionic Cu (Cu2+) is dominant the species at pH < 6. The species CuCO3 is the most important one near neutral pH, reflecting the binding strength of
carbonate for cupric ions. At pH > 8 the dihydroxo-Cu (II) complex predominates [43, 46]. It has been reported that increased water hardness significantly reduces Cu toxicity to aquatic organisms due to increase Cu complexing capacity of water [46, 47]. Other important inorganic complexing ligands in natural water may include HS-, PO43-, Cl-, and
NH3 [43]. In both fresh and seawater systems organic ligands play a more important role
organic complexation of dissolved Cu in fresh water rivers may range from 75 to 99% of total dissolved Cu [34, 48]. The relative stability of Cu complexes depends on the nature of the ligands present and varies considerably with the composition of solution. In general, the stability of chelate complex is inherently greater than non-chelate complexes. [43].
Precipitation is the second process that controls the levels of Cu in natural water. It has been reported that precipitation of Cu minerals is an important pathway in the reduction of soluble Cu levels in natural waters [46]. The most common Cu precipitates in natural water are Cu(OH)2, and ultimately CuO, Cu2(OH)2(CO3), Cu3(OH)2(CO3)2 [45,
46]. In polluted water phosphates can also form a Cu precipitate if present in elevated amounts [46]. Carbonates and sulfides in sediment contribute to Cu accumulation and retention in sediments. It has been reported that Cu retention in sediment was proportional to carbonate content [39].
The third mechanism responsible for dissolved Cu levels in natural waters is adsorption. Adsorbent species can be living and non-living particulate matter such as minerals, organic matters, other metal (e.g., Al, Fe, Mn) hydrous oxides, and living or dead cells [32]. Metals bind to adsorbent species by associations ranging in strength from weak van der Waals forces to strong covalent bonding, coprecipitation with ferromanganese oxides and incorporation into clay crystal lattices [49]. Metal sorption and partitioning between sediment and solution depend on partition coefficients, which are related to metal and adsorbent characteristics as well as many environmental
parameters [49]. Factors that influence Cu sorption/desorption process in natural environments include pH, Cu and adsorbent concentrations, type and concentration of ligands, and competing cations in solution [32].
Toxicity and factors influencing toxicity
The presence of Cu in plant and animal tissues was recognized more than 170 years ago, long before it was recognized as an essential element in the diets of birds and mammals [37]. Although Cu is a required element, at elevated levels Cu becomes toxic. Copper is relatively non-toxic to mammals, according to clinical studies on man, and studies on domestic and laboratory animals. Some domestic animals such as rabbits, ponies, and pigs can tolerate high levels of Cu in their diets (300 to 800 µg/g dry weight feed) without toxicity developing [32]. However, relative to mammals, Cu is exceedingly toxic to aquatic biota. Toxicological tolerance levels in mammals are generally 10 to 100 fold higher than those of crustacean and fish [37]. The sensitivity of fish and aquatic invertebrates to Cu is dependent upon their surface to volume ratio, respiratory rates, and flow rates over gill surfaces. Cu uptake is facilitated when these parameters increase [47]. In laboratory studies, acute toxicity of Cu to aquatic invertebrates vary widely from species to species and depend on experimental conditions (e.g., with or without food, soft or hard water) and organism life-stage. Hodson et al. [47] summarized LC50s for many fresh water invertebrates including rotifers (e.g., Philodina acuticornis, 96-h LC50 range
from 700 to 1,100 µg/L ); ectoprocts (e.g., Plumatella casmiana, 96-h LC50 range from
annelids (e.g., Tubifex sp., 48-h LC50 range from 6.4 to 890 µg/L); insects (e.g., Caddis
fly., 96-h LC50 range from 6,200 to 64,000 µg/L); mollusks (e.g., snail, 96-h LC50 range from 39 to 1,700 µg/L). Similarly to invertebrates, the sensitivity of fish to Cu varies from species to species. Lethal effects may be observed over a wide range of Cu concentrations (23 to 10,200 µg/L). The sublethal effects of Cu on fish occur at concentrations up to the lethal level. However, the thresholds of effect were observed at concentrations less than 160 µg/L [47]
The chemical form of Cu is critical to its behavior in biological processes. As discussed above, the form taken by Cu (ionic, complexed, and precipitated) depends on environmental factors such as pH, water hardness, organic content, and so on. To be available to aquatic organisms, Cu must be present in a readily soluble form [46, 47]. In natural waters, the inorganic forms of Cu that are most toxic to fish and D. magna are
Cu2+ and CuOH+, however, Cu2(OH)22+ has been considered toxic in some case [50, 51].
Precipitated forms of Cu (e.g., oxides, phosphates, carbonates) are generally assumed to be non-bioavailable and non toxic [52]. Organically bound Cu is less available and, therefore, less toxic to aquatic organisms [53]. Several organic ligands such as nitrilotriacetate (NTA) and ethylenediaminetetraacetate (EDTA) were shown to be able to reduce Cu toxicity [52].
Factors influencing the toxicity of metals to aquatic organisms have been documented in the literature. The toxicity of Cu is affected by many physico-chemical factors which alter the chemical form of Cu and physiological response or susceptibility
of organism. Physico-chemical factors that influence toxicity of Cu to aquatic organisms include pH, water hardness, DOC, oxygen content, alkalinity, temperature, light intensity, salinity, and the presence of other metal ions [32]. Water hardness, pH, and DOC are three important factors that have been received considerable attention in the literature. The most important factor is probably pH since pH influence both form and mobility of Cu. As mentioned above, at pH less than 6, Cu2+, which is the most toxic form, predominates in aqueous environment. According to De Schamphelaere et al. [54], in the range from 5.3 to 8.5, an increase in pH resulted in a linear increase of 21-d Cu NOEC and EC50 values for D.magna. Stouthart et al. [55] reported that a decreased water pH
(from 7.6 to 6.3) leads to increased Cu toxicity during the early life stages of the carp. This enhanced toxicity could be explained by the increased concentration of Cu2+ at lower water pH. According to Miwa et al. [56], at pH 7.6, 32% of the total Cu is present as Cu2+, and this amount increases to 92% at pH 6.3 However, Long et al. [57] reported that differences in pH (range 5.5 to 8.5) did not influence the acute toxicity of Cu to
D.magna. Wilde et al. [58] mentioned that changes in solution speciation due to variation
of pH alone did not explain the changes in toxicity [58]. There was a decrease in toxicity of Cu to a tropical freshwater alga (Chlorella sp.) when pH decreased in a range 8.0 to
5.5 [58]. Wilde et al. used the biotic ligand model (BLM) theory of competition between protons (H+) and metals for binding sites at the algal cell surface to support their observation. They measured extracellular Cu concentrations and shown that higher extracellular metal concentrations were observed at high pH, indicating reduced
competition. Similarly, Takasusuki et al. [59] reported that Cu toxicity to neotropical fish (Prochilodus scrofa) was higher in water with pH 8.0 than pH 4.5.
Considerable attention has been given to the effects of water hardness on aquatic organism sensitivity to Cu toxicity. Naddy et al. [60] demonstrated that dissolved copper (48-h) EC50s for Ceriodaphnia dubia increased approximately two fold when exposed
in very hard water (404 mg/L as CaCO3) compared to moderately hard waters (94 mg/L
CaCO3) regardless of the hardness of the culture medium. This is in agreement with the
results found by Kallanagoudar and Patil [61], who reported that toxicity of Cu was decrease with an increase in the hardness (50, 150 and 300 mg/l CaCO3). Cu toxicity was inversely related water hardness not only at high hardness levels but also at low hardness levels. Long et al. [57] demonstrated a positive relationship between hardness and 48-h total Cu LC50 at hardness below 50 mg/l as CaCO3. Other studies further investigated the relative contribution of the Ca and Mg components of total hardness to Cu toxicity [62, 63]. Perschbacher and Wurts [62] reported fish mortality decreased significantly as Ca hardness levels increased from 50 to 350 mg/L while magnesium hardness provided no protection from Cu toxicity. Welsh et al. [63] also shown that acute Cu toxicity was significantly lower, i.e., 96-h LC50s were higher, in laboratory waters containing proportionately more Ca (Ca:Mg molar ratios of 1.5-5.2) than in waters containing less Ca (Ca:Mg molar ratios of 0.2-0.8).
DOC is another important factor affecting the toxicity of Cu to aquatic organisms. It is well documented in the literature that natural organic matter such as humic and
fulvic acids are able to form complexes with Cu that result in less bioavailability of Cu [51, 54, 64]. Meador [51] demonstrated that ionic Cu concentration was strongly controlled by DOC and the complexing capacity of the solution was exceeded only when the DOC concentration was low or total copper concentration was high. De Schamphelaere et al. [54] reported that DOC is the most important factor for chronic toxicity to D.magna and in a range from 1.6 to 18.4 mg/L, an increase in DOC
concentration had a significant decrease in Cu toxicity to D.magna. This is similar to the
result found by Kramer et al. [64] who shown clear evidence of a linear relationship between DOC and the ecotoxicological effect of Cu to D.magna expressed as EC50.
Daphnia magna
Daphnia magna as a standard toxicity test animal
Daphnia magna is a species of small freshwater crustaceans that have been used
widely in toxicity test. Daphnia magna is a valuable test organism since it is sensitive to
toxicants, ubiquitously distributed, extensively used in toxicity tests, easy to identify, culture and handle [65]. Of all species of daphnids, D. magna is the largest and easiest to
handle [66]. Daphnia magna fecundate and reproduce parthenogenecally that allows for
the establishment of clones with little genetic variability and with reproducible testing results [65]. Daphnia magna has been used in both acute and chronic tests, for single
compounds as well as mixtures. Test animal of any desired age are available during the year, and chronic toxicity tests can be extended to several generations of animals [67, 68]. Daphnia magna is sensitive to metals and other toxicants (e.g., pesticides) and has
been used in metal toxicity tests across the world. Toxicity test based on this animal may provide conservative estimates of metal impacts on the aquatic environment [69].
Life history
Daphnia magna attains a maximum length of 5 to 6 mm [70]. The average life
span of D. magna, from the release of the egg in to brood chamber until adult death, is
about 40 d at 25oC and about 56 d at 20oC [71]. D. magna usually goes through 6 to 22
instars during its life span; each instar stage is terminated by a molt. In general, the duration of instars increases with age, but also depends on environmental conditions [70]. Four distinct periods may be recognized in the life history of D.magna: egg, juvenile,
adolescent and adult. When a clutch of eggs is released into the brood chamber, segmentation begins promptly; the young, in the first juvenile instar and similar in form to the adult, are released from the brood chamber in about two days when the female molts. There are three to five juvenile instars. The adolescent period is a single instar between the last juvenile instar and the first adult instar; during this instar the first clutch of eggs reaches full development in the ovary. The time required to reach sexual maturity varies from 6 to 10 d and depends on the temperature. As soon as D.magna molts at the
end of the adolescent instar and enters the first adult instar, the first clutch of parthenogenetic eggs is released into the brood chamber. During the first adult instar the second clutch of eggs is developing in the ovary. Successive adult instars and new clutches of young are produced in a similar manner. The number of young per brood is highly variable for Daphnia, depending primarily on food availability and environmental
conditions. Daphnia magna may produce as many as 30 young during each adult instar,
but more commonly the number is six to ten [70]. Daphnia magna increases in size after
each molt. During juvenile instars, D.magna may double in size after molting; the
increase in volume occurring within a few seconds or minutes while the new exoskeleton is till elastic. [65, 71]
Distribution
Daphnia magna is widely distributed and can be found in almost any body of
fresh water. It is one of the Cladocera considered truly cosmopolitan [71, 72]. It is a common inhabitant of lakes, ponds, permanent pools and temporary pools, and slow-moving streams and rivers [72-74]. In North America it appears to be absent from only the eastern United States and Alaska [70].
Ecology
Daphnia magna populations are generally less abundant in winter and early
spring, but when water temperatures reach 6°C to 12°C, they increase in abundance and may reach population densities as high as 200 to 500 individuals/L [71]. Daphnia magna
populations consist of almost exclusively females during most of the year, males are found only in spring or autumn. For most of the year, Daphnia reproduce
parthenogenecally and only female produce young. Males can be differentiated from females by their smaller size, lager antennules, modified postabdomen, and first legs having a stout hook used in clasping [72]. Production of males appears to occur typically
under stress conditions such as dense populations, less availability of food, exposure to extreme temperatures, or subsequent accumulation of excretory products. These conditions also can induce the appearance of sexual (resting) egg in cases (ephippia) that are cast off during the next month. The shift towards males and sexual egg production appears related to the parent metabolic rate [65].
Daphnia magna plays an important role in aquatic ecosystem. It is an
intermediate in the aquatic food chain, located between primary producers (e.g., algae) and secondary consumers (e.g., carnivorous fish) [68]. Therefore, D. magna is a major
food source of fish and invertebrate predators and have a relatively important impact on water clarity by feeding on algae [73]. Depending on the size, each animal can clear more than 1 mL per hour [75]. Theoretically, D.magna population with density over 40 per L
CHAPTER TWO
1111112. TESTING THE INDIVIDUAL EFFECTIVE DOSE
Introduction
The individual effective dose (IED) is an assumption for probit analysis widely used to fit dose or concentration- response data. The IED concept was first proposed by Bliss [1] and referred to as the individual tolerance hypothesis depending on if the toxicant was administered internally (dose) or if the organism was exposed to it in the medium [2]. According to the IED, each individual has a uniquely innate tolerance to a particular toxicant that is the smallest dose sufficient to cause mortality [1]. A specific individual will only die if it receives a dose or exposure equal to or higher than its IED. The IED values among individuals in a population usually exhibit a lognormal distribution and logarithmic transformation of dosage will convert mortality data to a normal distribution [3] suitable for probit analysis [4][5].
An alternative explanation for lognormal responses is stochasticity suggesting that the risk of dying is the same for all individuals receiving a particular dose [6]. The major difference between IED and stochasticity is that while organism response in the former is a function of the unique quality of individuals, the organism response in the latter is totally random [2]. The IED suggests that approximately 50% of a population of individuals will die when exposed to an LC50 concentration and that subsequent exposure to an LC50 concentration after recovery will result in a much smaller percent of remaining individuals dying because the sensitive organisms have already died leaving
more tolerant organisms. Alternatively, stochasticity suggests that 50% of the population would die during the initial exposure and each subsequent exposure. Berkson [7] supported stochasticity reporting that candidate aviators tested for their tolerance to high altitude showed random tolerance from trial to trial. Gaddum [5] described a random process in which several “hits” were required to cause death at the site of action that resulting in a lognormal distribution of mortality.
Little research has been conducted to test the underlying assumption of the IED. Most of this work has focused on multiple exposures of a population to contaminant exposures with each exposure separated by a recovery period. Newman and McCloskey [6] measured the time to stupefaction (TTS) of zebra fish exposed to benzocaine in five trials to test whether the same order for TTS was maintained among trials. They reported that no consistent temporal trends in tolerance were apparent among trials and the IED hypothesis was supported with a minor stochastic component being present. They also exposed mosquitofish to sublethal and lethal sodium chloride (NaCl) and pentachlorophenol (PCP) concentrations killing a large portion of the population. After recovering, surviving fish were subsequently exposed to another lethal toxicant concentration. In contrast to the first experiment, the second one provided no support for the IED hypothesis. Zhao and Newman [8] also found that stochastic processes were the dominant explanation for results of copper sulfate (CuSO4) and sodium
These and other studies used the same contaminant concentrations for each of the multiple exposures during the experiments. Previous research has demonstrated age dependent susceptibility to contaminants [76]. The present study evaluated the response of a Daphnia magna population to multiple 24-h exposures of age-dependent LC50 Cu
concentrations to further test the validity of the IED in explaining organism response to contaminant exposure.
Materials and methods
Daphnia magna culture
Daphnia magna were obtained from cultures maintained at the Institute of
Environmental Toxicology, Clemson University (CU-ENTOX), Pendleton, SC. Routine reference acute toxicity tests have been performed with this culture to ensure consistent culture sensitivity to copper. Results are available through CU-ENTOX. Organisms were cultured in moderately hard water (MHW) (80-100 mg/L CaCO3) according to U.S EPA
methods [77]. MHW was prepared by adding reagent-grade salts (Fisher Scientific, Atlanta, GA, USA) (NaHCO3, CaSO4.2H2O, MgSO4, and KCl) into deionized water
(Super-QTM; Millipore Corporation, Bedford, MA, USA) and aerated for at least 24 h to
completely dissolve the salts before using. Daphnia magna cultures were maintained at
25 ± 1oC under 16:8 (L: D) photoperiod. Organisms were fed once daily with concentrated algae (Selenastrum capricornutum, 3x10⁷cells/mL) and YTC (yeast trout
when the culture medium was renewed. The culture medium was renewed three times per week and neonates were removed.
Acute toxicity bioassays
Acute tests to determine age dependent 24-h LC50 were modified from U.S EPA methods [70]. Four 24-h bioassays tested D.magna of different ages (≤ 24-h, 6-d, 12-d,
and 18-d) at six different Cu concentrations in triplicate. Exposure concentrations ranged from 30 to 80 µg Cu/L. Organisms were fed during the Cu exposures. Test solutions were prepared by adding an equivalent volume of alga, YTC, and Cu stock solution to MHW and aerated for at least 24 h before test initiation. Food concentrations were similar to those used in the D. magna culture as described above. Copper sulfate hexahydrate
(Fisher Scientific, Atlanta, GA, USA) was used to make the stock solution. Tests were conducted in 600-mL graduated polypropylene beakers, each contained 100mL of test solution. The beakers were placed on a table held at ambient room temperature (25 ± 1oC) with a 16:8 (L: D) photoperiod. Ten D.magna of appropriate age were randomly
pipetted into each beaker. The transfer of D.magna to the beaker initiated the bioassay.
After 24-h exposure, surviving organisms were transferred to additional beakers containing culture medium (MHW) and maintained until test termination (5 days). Surviving organisms in each test beaker were fed daily with an appropriate volume of algae and YTC and renewed every two days. Offspring and dead organisms were removed daily; dead organisms were recorded. A daphnid was considered as dead and was removed from the beaker if there was no sign of movement after gentle prodding.
The cumulative mortality after 24-h exposure and 5-d recovery were used to calculate the 24-h LC50.
Copper depuration test
Three copper depuration tests were conducted using three different organism life stages: neonate (≤ 24-h-old) juvenile (6-d-old) and adult (12-d-old) to determine sufficient recovery time between exposures. Tests were conducted in triplicate in 2-L graduated polypropylene beakers held at ambient room temperature (25 ± 1oC) with a 16:8 (L: D) photoperiod. Copper concentrations were appropriate age dependent 24-h LC50s. The test solution volume and the number of exposed D.magna in each test were
determined based on the required tissue for copper analysis, approximately 0.3 mg dry weight [78]. Daphnia magna were exposed to the appropriate age dependent 24-h LC50
for 24h. Following exposure, surviving organisms were transferred to culture medium and maintained until test termination (5 days). Each day, a sufficient number of surviving
D.magna was removed for copper analysis; offspring and dead organism were also
removed. Organism tissues were dried at 60oC in an oven (model 825F, Fisher Scientific, Atlanta, GA, USA) for 24 h, weighed, and then digested with 2.5 mL 50% nitric acid in 15 mL polypropylene centrifuge tubes for 24h at ambient (25 ± 1oC) room temperature. Sample tubes were boiled in pyrex vessels on a hot place until the sample solutions became clear. Samples were diluted with deionized water to 5% nitric acid and measured on a Spectro Arcos ICP at the Agricultural Service Laboratory, Clemson University, Clemson, SC, USA.
Multiple exposure bioassay
The twenty-four day bioassay followed modified standard methods [U.S EPA [77]. Test medium was prepared by adding an equivalent volume of alga, YTC, and Cu stock solution to MHW and aerating for at least 24 h before test initiation. Copper sulfate hexahydrate (Fisher Scientific, Atlanta, GA, USA) was used to make stock solution. The Cu concentration at each pulsed exposure was appropriate age dependent 24-h LC50. However, nominal Cu concentrations were increased by 30% since we initially observed less than 50% mortality. Tests were conducted in 2-L graduated polypropylene beakers, each containing 1000 mL test solution. The beakers were placed on a table held at ambient (25 ± 1oC) room temperature with a 16:8 (L: D) photoperiod. One hundred ≤ 24-h old D.magna were randomly pipetted to each beaker. The transfer of D.magna to the
beaker initiated the Cu exposure test. Three replicates were used for this test. There were four 24-h exposures during 24 d; between exposures organisms were given a 5-d recovery period, which was determined based on copper depuration results. All organisms, including controls, were transferred to fresh cultural medium in between Cu exposures. Test solution volumes for the second, third and fourth exposure were based on the surviving organisms of the previous exposures. After each 24-h exposure, surviving organisms in each beaker were transferred to culture medium (MHW) and maintained until the next exposure. Offspring and dead organisms were removed and recorded daily. Accumulative reproduction (AR) was measured by calculating the average number of neonates produced per living organisms each day and summed for each exposure period (24-h exposure and 5-d recovery) and at 24 d. At test termination, surviving adults were
transferred to aluminum weigh boats, dried in an oven (model 825F, Fisher Scientific, Atlanta, GA, USA) at 60o C for 24 h and weighed (Mettler balance model AT201, Greenville Scale Co., Inc., SC, USA) to quantify growth.
Water chemistry
Water hardness, pH, alkalinity, and dissolved oxygen (DO) were measured before and after each exposure for all tests following standard methods [77]. Total Cu, dissolved Cu, and major anions were analyzed at the beginning and the end of each exposure. Water samples for Cu analysis were placed in ICP vials and acidified with concentrated nitric acid. Dissolved Cu samples were filtered through 0.45-µm Gelman Nylon Mesh® prior to acidification. Hardness and alkalinity were determined by titration with 0.01 M EDTA and 0.02 N H2SO4, respectively. DO and pH was measured with a Thermo Orion 4 star pH - DO portable meter (Orion Research Inc. Beverly, MA, USA). Average pH, DO, hardness, and alkalinity in all bioassays were 8.01 ± 0.02; 8.15 ± 0.02 mg/L, 85.46 ± 0.16 mg/L as CaCO3, and 61.2 ± 0.15 mg/L as CaCO3, respectively. Total and dissolved Cu was approximately 80% and 60% of nominal concentrations, respectively.
Data analysis
Lethal concentration values were calculated using the Trimmed Spearman Karber method [79]. T-tests were used to test the differences between the control and the treatment of Cu and Na body burden at each time point in copper depuration test, AR and growth in 24-d bioassay. Linear regression was used to determine Cu depuration rate constants; depuration curves were tested for first-order rate kinetics by performing log
transformations of the Cu burden body values and testing for linearity. ANCOVA was used to test the differences in slopes of fitted lines. Statistic analysis was performed using Microsoft Excel 2007 and SAS version 9.2 (SAS Institute Inc., Cary, NC, USA). An effect with a p value ≤ 0.05 was considered significant.
Results
Age dependent 24-h LC50
Age dependent 24-h LC50 values were significantly different, with the exception of 6-d and 12-d treatments, based on nonoverlapping 95% confident intervals (Table 1). The nominal values were used in the copper depuration test and the multiple exposure bioassay.
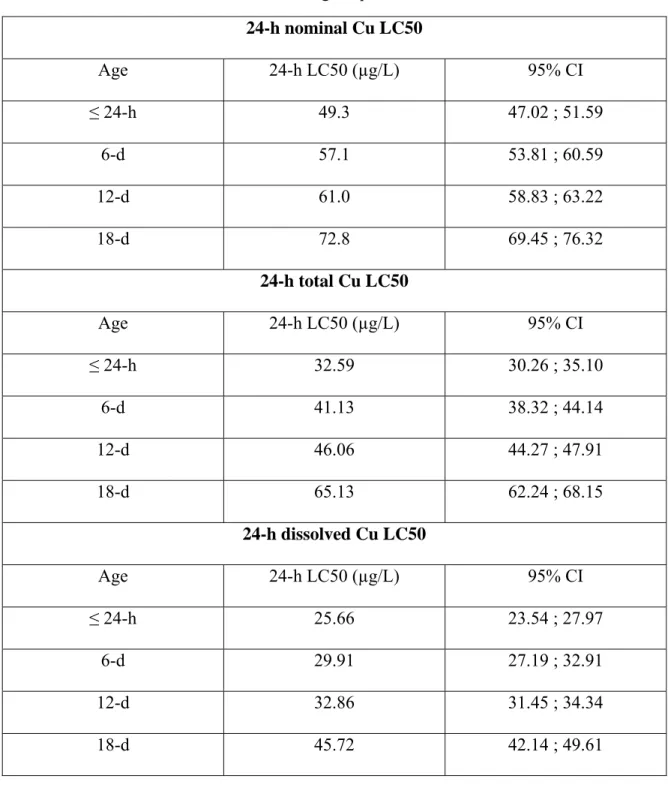
Copper depuration test.
Daphnia magna eliminated a significant amount of accumulated Cu after 24 h and
there was no significant difference between exposed and control organisms after the 5-d recovery period (Figure 2). Neonates and juveniles had higher body burdens after Cu exposure and took slightly longer time to depurate than adults. However, calculated depuration rates were not significantly different (Figure 4). Hence, Cu depuration in
D.magna was not age dependent or dependent on initial Cu body burden. The Na body
burden increased and inversely related to Cu body burden with the exception of 24-h recovery (Figure 3). There were no significant different in Na body burdens between treated and control organisms after 5-d recovery for neonates and adults (p = 0.6712 and
0.4967, respectively). Na body burden of control juveniles was even lower than that of exposed organisms after 5-d recovery (p = 0.9809).
Multiple exposure bioassay
Cumulative survival data during the 24-d bioassay suggests that overall population sensitivity declined during the bioassay (normalized for organism age) (Figure 5). After the first exposure and 5-d recovery, 48.33 ± 1.76 % (mean ± standard error) of
D.magna population died. The population continued to decline after the second exposure
(57.77 ± 2.26 % mortality) but there was very little mortality after the third exposure (16.69 ± 7.33 % mortality). After the fourth exposure (68.47 ± 9.06 33 % mortality), only about 5.67 ± 2.03 % (mean ± standard error) of the population survived to the end of the experiment. In all four exposures, the mortality was high during the exposure period and in the first two days after exposure. Survival in the controls was 94.33 ± 0.88 % (mean ± standard error)
The effects of Cu exposure on reproduction and growth were significant. Treatment 24-d AR was significantly less than the control, 48.41 ± 2.49 and 114.46 ± 0.34 (mean ± standard error), respectively. The average dry weight of an exposed organisms was significantly different from that of a control, 0.33 ± 0.01 mg/adult and 0.40 ± 0.01 mg/adult (mean ± standard error), respectively.
Table 1. Estimated age dependent 24-hLC50 24-h nominal Cu LC50 Age 24-h LC50 (µg/L) 95% CI ≤ 24-h 49.3 47.02 ; 51.59 6-d 57.1 53.81 ; 60.59 12-d 61.0 58.83 ; 63.22 18-d 72.8 69.45 ; 76.32 24-h total Cu LC50 Age 24-h LC50 (µg/L) 95% CI ≤ 24-h 32.59 30.26 ; 35.10 6-d 41.13 38.32 ; 44.14 12-d 46.06 44.27 ; 47.91 18-d 65.13 62.24 ; 68.15 24-h dissolved Cu LC50 Age 24-h LC50 (µg/L) 95% CI ≤ 24-h 25.66 23.54 ; 27.97 6-d 29.91 27.19 ; 32.91 12-d 32.86 31.45 ; 34.34 18-d 45.72 42.14 ; 49.61
Figure 2. Copper body burden of treated and control organisms as a function of recovery time.
n = 3, error bars represent standard error around the mean. (*) is significantly different from control ( ≤ 0.05)
Figure 4. Change in Cu body burden during recovery period.
Slopes were significantly different from 0. Slopes of linear regression represent depuration rate constants. Data from Figure 2.
Figure 5. Percent survival of D.magna population during 24-d bioassay.
Figure 6. Accumulative reproduction for D. magna at the end of each exposure period.
Discussion
Age dependent 24-h LC50
To our knowledge, this is the first time 24-h LC50 values were reported for
D.magna at different life stages; D.magna used in most acute bioassays are ≤ 24-h old.
Age-dependent 24-h LC50 values for Cu increased with age (Table 1). Forget et al. [80] found that 96-h LC50 values were significantly different for different life stages of the marine copepod (Tigriopus brevicornis) exposed to cadmium and arsenic. Hoang et al.
[76] reported that at an age ≥ 96-h old, the sensitivity of D.magna to Cu, Zn, Se, and As
was inversely related to age. Research on the effect of age on metal acute toxicity to
D.magna (48-h exposure) by Muyssen and Janssen [81] also showed that ≤ 24-h-old
daphnids were more sensitive to Cu and Zn than 7-d old organisms. However, the underlying factor which affected LC50 values and related to animal age was the average weight of an organism. 24-h nominal Cu LC50s and organism average weights had a linear relationship with very high correlation coefficient, R2 = 0.901 (Figure 1).
Copper depuration test
After 24 h exposure, Cu burden in neonates (305 ± 27.15 µg/g) and juveniles (318.67 ± 6.96 µg/g) were not statistically different (p= 0.234) but they were significantly
higher than the adults (168.67 ± 10.33 µg/g). One reason for this lower Cu body burden in adult daphnids might be increased size. However, transfer to offspring may contribute to Cu elimination in adult D.magna since Cu is an essential element. Detailed
mechanisms underlying Cu assimilation and elimination in D.magna are not yet
identified due to lack of a suitable radioisotope for such purpose [68]. Recent studies on the biokenetics of other metals (Ag, Cd, Se, and Zn) in D.magna [82-85] have revealed
that several processes contribute to metal elimination in D.magna including excretion,
egestion, molting, and reproduction. They also reported that maternal transfer of metals to offspring is highly efficient but metal specific. Essential metals such as Zn and Se were found to transfer from mothers to offspring more efficiency [83] than nonessential metals such as Cd and Ag that showed no or very minimal maternal transfer [82, 83].
However, the depuration rate constants among the different life stages of D. magna were not statistically different from each other suggesting that depuration rate was
not dependent on organism age. This was consistent with results of other studies including Lam and Wang [82] who found similar efflux rates of Ag in juvenile and adult
D. magna. Tsui and Wang [68] also mentioned age-independent elimination rate
constants for Cd, Se, Zn, Cr, Hg of adult D.magna. During the recovery time, the D.magna Cu burden decreased with time and followed first order kinetics similar to
results reported for other metals [82, 83, 85]. Depuration of Cu by D.magna in all three
treatments included an initial rapid loss (after 24 h), followed by a more gradual loss. Guan and Wang [83] found that the depuration of Cd, Se and Zn depurations in D.magna
followed similar trends.
Even though D.magna rapidly depurated Cu, based on latent mortality up to 4
5 days to fully recover from previous Cu exposure. Hoang et al. [14] showed that 96 h between Cu exposures was sufficient for D.magna to recover such that the effect of the
second pulse was independent from the effect of the first pulse. Latent mortalities following Cu exposure were observed by Zhao and Newman [86] on amphipods (H. azteca) and Meyer et al. [87] on fathead minnows (Pimephales promelas). Na body
burden data also suggested that 5 days was sufficient recovery time since the Na body burden of treated organisms were not significant different from or even statistically higher than that of control organisms after 5-d recovery times. It has been shown in the literature that mechanisms of Cu toxicity to aquatic organisms are the inhibition of Na transport into organism, specifically the inhibitions of Na+/Ka+-ATPase, and the loss of Na through tight junctions between epithelial cells since Cu can displace Ca2+ at the gill surface due to its greater binding ability [88-90]. Because Cu binding to the gill is a reversible interaction, recover of sodium balance may be possible after Cu exposure. Inverse relationship between Cu and Na body burden from day two during recovery period demonstrated the ability of D.magna to depurate accumulated copper and regain
sodium loss after 5-d recovery. This was in agreement with the results found by Zahner et al. [91] who reported that larval fathead minnows (Pimephales promelas) had an ability
to recover whole-body sodium within 48 h after exposure to concentrations below 0.47
μM Cu2+ for 3, 6, or 9 h but organisms required more than 48 h to recover at higher exposure concentrations. Hence, we concluded that the 5-d interval between Cu exposures was sufficient for recovery in the multiple pulse bioassay.
Multiple exposure bioassay
Results of this research support the stochasticity hypothesis: mortality occurred randomly during and after each 24-h Cu exposure with the exception of the third one. Although some acclimation to Cu could have occurred for the third exposure the fact that the 4th exposure caused significant mortality suggests that these organisms were not acclimated. Newman and McCloskey [6] also found that the stochasticity hypothesis was strongly supported by NaCl and PCP double pulse exposure experiment on mosquitofish. In those experiments, fish were challenged to sublethal and lethal concentration of NaCl and PCP but the exposure duration was not constant. The argument could be that exposure duration has an effect on mortality of fish. Hoang et al. [14] showed that depending on metal of concern (Cu, Zn, Se, and As), exposure duration may have stronger, equal or weaker effect than concentration. Zhao and Newman [8] reported that under the specific concentration and duration used in their experiment, stochastic processes better explained results for CuSO4, while both stochasticity and IED appeared
to influence NaPCP toxicity but stochasticity was dominant. Even though these investigators arrived at the same conclusion with the same toxicant but different experimental organism, our approach was somewhat different. Unlike Zhao and Newman [8] we kept the exposure duration and recovery time between exposures constant in order to exclude the effect of exposure duration and recovery time on mortality. Furthermore, the organisms in our experiment were challenged three additional times (4 pulsed exposures total) and in all exposures organism were exposed to age-appropriate lethal concentrations that may provide stronger support for stochastic hypothesis.
Reproduction and growth data suggest that Cu exposure significantly affected growth and reproduction of D.magna. The growth and 24-d AR of the control and the
treatment were statistically different (p= 0.01 and 0.0012, respectively). Cu appeared to
have more effect on reproduction than growth suggesting a prioritization of energy expenditure. Reproduction in the treatment occurred latter than in the control by two days. The treatment AR after each exposure period and after 24-d were significantly different from the control (Figure 6). This was not in agreement with results with the insecticide, chlorpyrifos, that demonstrated no effect on reproduction as long as D.magna
survived from pulsed exposures [18]. Diamond et al. [16] who exposed D.magna to Cu
and Zn, and Hoang et al. [14] who exposed D.magna to Cu, Zn, Se, As also reported no
effects on reproduction. However, all of these studies used either single or double pulse exposures and the concentration for double pulsed exposure was kept constant. The reproduction data in the present study not only support stochasticity of the toxic effects but raise the issue of the role of energy allocation in these processes. Further research is needed to clarify this effect at the population level.
Conclusions
Stochastic processes best explain the response of D.magna to multiple Cu
exposures. This conclusion has significant implications for predicting population consequences of intermittent Cu exposure in receiving streams. While the IED hypothesis would suggest that these populations would acclimate and persist because more sensitive organisms would be deleted from the population leaving those more fit, this research
supports a more random (stochastic) response of the population to each subsequent exposure ultimately having severe effects on the population.
APPENDICES
Appendix A
A. Water chemistry data
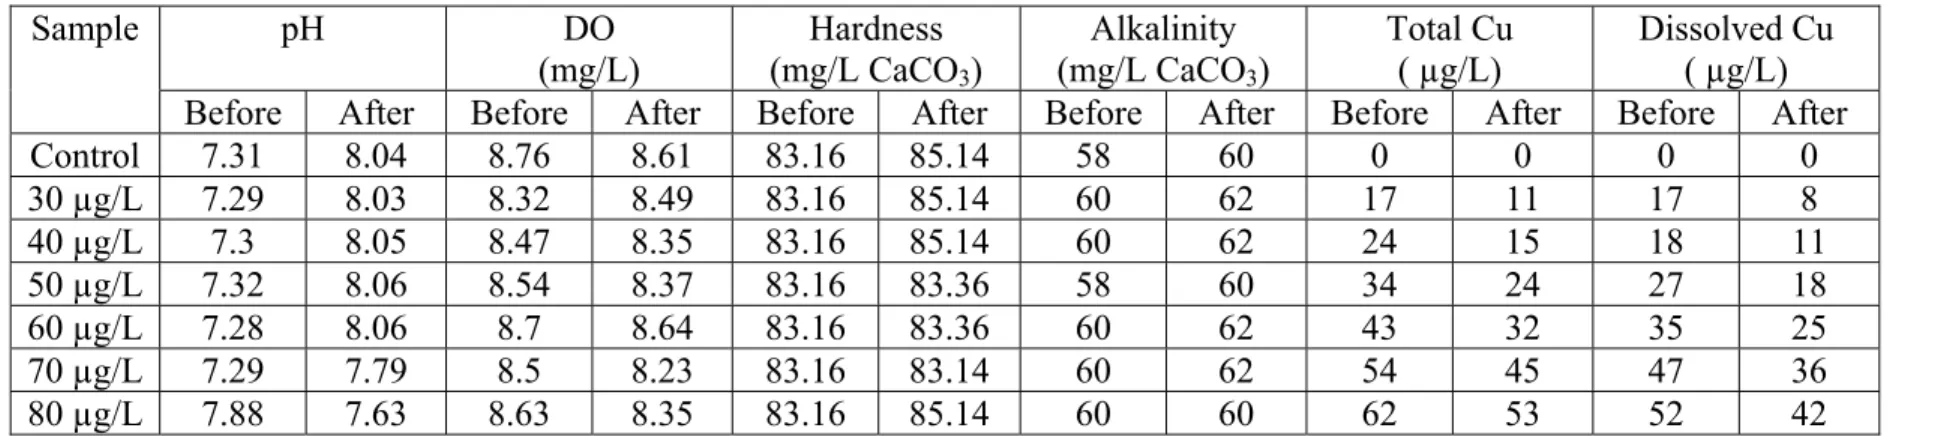
Table 2. Water chemistry data for ≤24-h LC50 test. pH DO (mg/L) Hardness (mg/L CaCO3) Alkalinity (mg/L CaCO3) Total Cu ( µg/L) Dissolved Cu ( µg/L) Sample
Before After Before After Before After Before After Before After Before After
Control 7.31 8.04 8.76 8.61 83.16 85.14 58 60 0 0 0 0 30 µg/L 7.29 8.03 8.32 8.49 83.16 85.14 60 62 17 11 17 8 40 µg/L 7.3 8.05 8.47 8.35 83.16 85.14 60 62 24 15 18 11 50 µg/L 7.32 8.06 8.54 8.37 83.16 83.36 58 60 34 24 27 18 60 µg/L 7.28 8.06 8.7 8.64 83.16 83.36 60 62 43 32 35 25 70 µg/L 7.29 7.79 8.5 8.23 83.16 83.14 60 62 54 45 47 36 80 µg/L 7.88 7.63 8.63 8.35 83.16 85.14 60 60 62 53 52 42
Table 3. Water chemistry data for 6d-LC50 test. pH DO (mg/L) Hardness (mg/L CaCO3) Alkalinity (mg/L CaCO3) Total Cu ( µg/L) Dissolved Cu ( µg/L) Sample
Before After Before After Before After Before After Before After Before After
Control 7.8 7.79 7.91 7.89 87.12 89.10 60 62 0 0 0 0 30 µg/L 8.21 7.96 7.93 7.90 87.12 89.10 62 62 22 15 13 11 40 µg/L 8.22 7.83 8.02 8.00 87.12 87.12 60 62 28 19 17 15 50 µg/L 8.24 7.79 7.85 7.83 87.12 89.10 60 64 36 28 25 22 60 µg/L 8.23 8.18 8.23 8.07 87.12 89.10 60 62 41 32 30 25 70 µg/L 8.05 8.17 8.04 8.01 87.12 89.10 60 62 55 44 45 36 80 µg/L 7.88 8.16 7.92 8.90 87.12 89.10 60 62 64 50 51 41
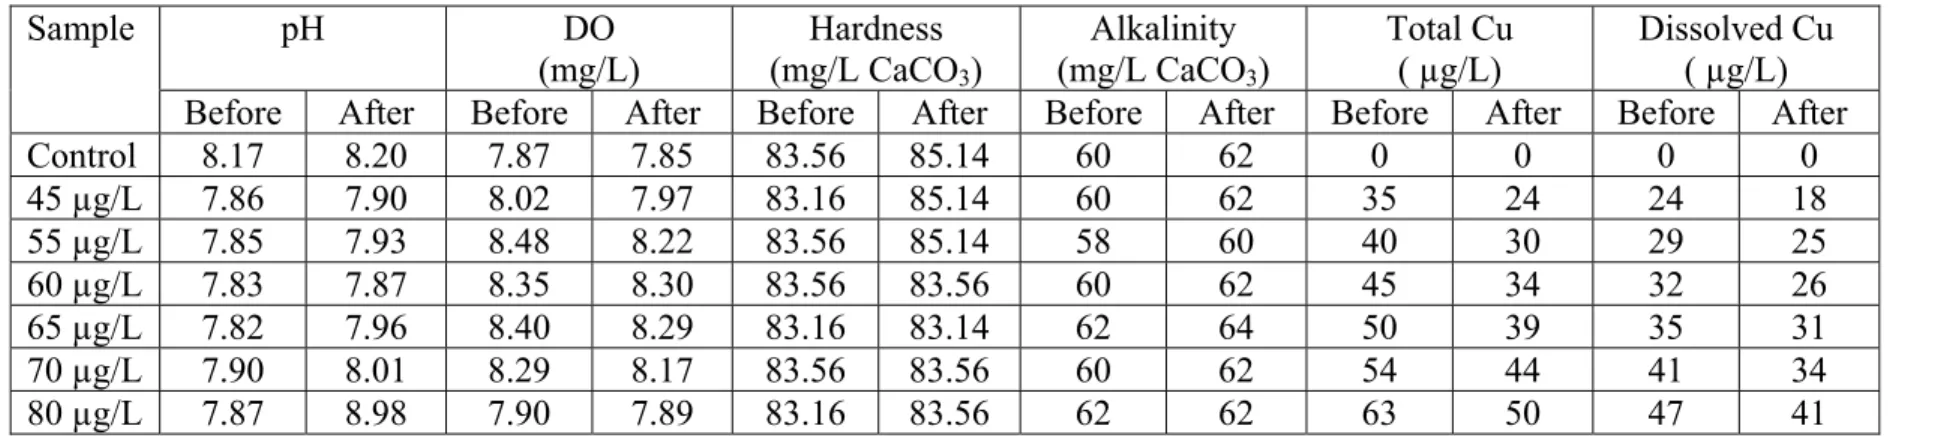
Table 4. Water chemistry data for 12-d LC50 test. pH DO (mg/L) Hardness (mg/L CaCO3) Alkalinity (mg/L CaCO3) Total Cu ( µg/L) Dissolved Cu ( µg/L) Sample
Before After Before After Before After Before After Before After Before After
Control 8.17 8.20 7.87 7.85 83.56 85.14 60 62 0 0 0 0 45 µg/L 7.86 7.90 8.02 7.97 83.16 85.14 60 62 35 24 24 18 55 µg/L 7.85 7.93 8.48 8.22 83.56 85.14 58 60 40 30 29 25 60 µg/L 7.83 7.87 8.35 8.30 83.56 83.56 60 62 45 34 32 26 65 µg/L 7.82 7.96 8.40 8.29 83.16 83.14 62 64 50 39 35 31 70 µg/L 7.90 8.01 8.29 8.17 83.56 83.56 60 62 54 44 41 34 80 µg/L 7.87 8.98 7.90 7.89 83.16 83.56 62 62 63 50 47 41
Table 5. Water chemistry data for 18-d LC50 test. pH DO (mg/L) (mg/L CaCOHardness 3) Alkalinity (mg/L CaCO3) Total Cu ( µg/L) Dissolved Cu ( µg/L) Sample
Before After Before After Before After Before After Before After Before After
Control 8.02 8.04 8.01 7.98 85.14 87.12 62 64 0 0 0 0 50 µg/L 7.97 8.01 8.03 8.02 85.14 87.12 62 64 40 30 33 22 55 µg/L 8.01 8.04 7.98 7.97 83.56 87.12 60 62 48 32 30 25 60 µg/L 8.04 8.07 8.02 8.00 85.14 89.10 62 64 54 34 37 24 65 µg/L 7.98 8.02 7.97 7.95 85.14 87.12 62 62 58 35 39 24 70 µg/L 7.96 7.98 8.01 7.97 83.16 89.10 60 64 63 45 46 32 80 µg/L 8.02 7.97 7.98 7.96 85.14 87.12 62 62 71 51 52 39
Table 6. Water chemistry data for neonate copper depuration test. pH DO (mg/L) Hardness (mg/L CaCO3) Alkalinity (mg/L CaCO3) Total Cu ( µg/L) Dissolved Cu ( µg/L) Sample
Before After Before After Before After Before After Before After Before After
Control 1 8.01 8.04 8.29 8.09 85.14 87.12 60 62 1 0 0 0 Control 2 7.89 8.02 8.17 8.11 83.16 87.12 58 62 0 0 0 0 Control 3 8.00 8.03 8.15 8.07 83.16 87.12 60 64 0 0 0 0 49.3 µg/L 7.95 7.98 8.21 8.16 85.14 87.12 62 62 37 31 19 15 49.3 µg/L 7.97 8.02 8.23 8.17 85.14 87.12 60 64 37 30 19 16 49.3 µg/L 7.98 8.01 8.18 8.08 85.14 87.12 62 64 37 29 20 15
Table 7. Water chemistry data for juvenile copper depuration test. pH DO (mg/L) Hardness (mg/L CaCO3) Alkalinity (mg/L CaCO3) Total Cu ( µg/L) Dissolved Cu ( µg/L) Sample
Before After Before After Before After Before After Before After Before After
Control 1 8.13 8.22 8.33 8.22 83.56 85.14 60 64 1 0 0 0 Control 2 8.11 8.19 8.27 8.17 83.16 85.14 58 62 0 0 0 0 Control 3 8.09 8.17 8.19 8.09 83.56 83.56 60 62 0 0 0 0 57.1 µg/L 8.12 8.15 8.15 8.01 83.56 85.14 62 62 47 43 31 24 57.1 µg/L 8.05 8.11 8.23 8.11 83.16 85.14 60 62 45 39 30 30 57.1 µg/L 8.07 8.21 8.18 8.07 83.56 83.16 62 64 45 50 29 25
Table 8. Water chemistry data for adult copper depuration test. pH DO (mg/L) Hardness (mg/L CaCO3) Alkalinity (mg/L CaCO3) Total Cu ( µg/L) Dissolved Cu ( µg/L) Sample
Before After Before After Before After Before After Before After Before After
Control 1 7.76 8.15 8.27 8.03 85.14 87.12 58 62 1 0 0 0 Control 2 7.96 8.21 8.17 7.98 84.35 87.12 56 60 0 0 0 0 Control 3 7.98 8.33 8.31 8.01 85.54 89.10 58 62 0 0 0 0 61.0 µg/L 8.01 8.24 8.22 8.07 85.54 87.12 58 62 49 49 38 32 61.0 µg/L 7.89 8.17 8.19 7.89 83.16 85.54 58 62 49 47 40 32 61.0 µg/L 8.05 8.21 8.17 7.91 84.35 87.12 56 60 51 45 39 28
Table 9. Water chemistry data for the first exposure in 24-d bioassay. pH DO (mg/L) Hardness (mg/L CaCO3) Alkalinity (mg/L CaCO3) Total Cu ( µg/L) Dissolved Cu ( µg/L) Sample
Before After Before After Before After Before After Before After Before After
Control 1 8.09 8.23 8.23 8.01 84.35 87.12 60 64 0 0 0 0 Control 2 8.01 8.17 8.31 8.09 85.14 85.54 58 62 0 0 0 0 Control 3 7.95 8.15 8.32 8.07 85.15 87.12 60 62 0 0 0 0 65.0 µg/L 7.94 8.09 8.27 8.01 83.16 87.12 62 62 57 43 44 41 65.0 µg/L 8.02 8.14 8.19 7.98 84.35 87.12 62 62 57 44 49 32 65.0 µg/L 7.91 8.11 8.25 8.03 85.54 89.10 60 64 54 42 43 31
Table 10. Water chemistry data for the second exposure in 24-d bioassay. pH DO (mg/L) Hardness (mg/L CaCO3) Alkalinity (mg/L CaCO3) Total Cu ( µg/L) Dissolved Cu ( µg/L) Sample
Before After Before After Before After Before After Before After Before After
Control 1 7.95 8.09 8.42 8.07 83.56 85.14 60 62 0 0 0 0 Control 2 8.02 8.17 8.37 8.03 83.16 85.14 60 60 0 0 0 0 Control 3 7.91 8.07 8.33 8.05 83.56 83.56 62 62 0 0 0 0 74.0 µg/L 7.89 8.05 8.29 8.01 83.56 85.14 62 64 64 58 54 46 74.0 µg/L 8.01 8.13 8.31 8.06 83.16 87.12 60 62 63 58 53 47 74.0 µg/L 8.03 8.19 8.35 8.04 83.16 83.56 62 64 63 57 53 46
Table 11. Water chemistry data for the third exposure in 24-d bioassay. pH DO (mg/L) Hardness (mg/L CaCO3) Alkalinity (mg/L CaCO3) Total Cu ( µg/L) Dissolved Cu ( µg/L) Sample
Before After Before After Before After Before After Before After Before After
Control 1 8.02 8.11 8.27 8.05 85.14 87.12 60 62 0 0 0 0 Control 2 8.01 8.10 8.22 8.03 85.14 87.12 62 64 0 0 0 0 Control 3 7.93 8.07 8.19 8.00 83.16 83.56 60 62 0 0 0 0 80.0 µg/L 8.04 8.12 8.23 8.02 85.14 87.12 60 64 69 57 57 47 80.0 µg/L 7.89 8.09 8.27 8.01 83.56 85.14 60 62 73 56 57 47 80.0 µg/L 8.07 8.21 8.21 7.98 85.14 87.12 60 62 68 56 57 47
Table 12. Water chemistry data for the fourth exposure in 24-d bioassay. pH DO Hardness (mg/L CaCO3) Alkalinity (mg/L CaCO3) Total Cu ( µg/L) Dissolved Cu ( µg/L) Sample
Before After Before After Before After Before After Before After Before After
Control 1 7.97 8.03 8.25 8.01 87.12 89.10 58 62 0 0 0 0 Control 2 8.02 8.07 8.17 7.97 87.12 89.10 56 60 0 0 0 0 Control 3 8.05 8.09 8.24 8.03 83.56 87.12 60 62 0 0 0 0 95.0 µg/L 8.09 8.12 8.19 7.98 87.12 89.10 58 62 82 76 72 58 95.0 µg/L 7.98 8.06 8.22 8.02 85.14 87.12 58 60 81 73 71 56 95.0 µg/L 8.06 8.11 8.31 8.05 87.12 89.10 60 62 83 75 72 56
Appendix B B. Biological data
Table 13. Copper burden data for neonate depuration test (µg Cu/g dry wt). Recovery
time (h)
Control 1 Control 2 Control 3 Treatment 1 Treatment 2 Treatment 3 0 179 210 162 257 351 307 24 54 65 55 101 66 58 48 29 26 41 46 43 51 72 23 17 23 27 29 39 96 23 38 32 32 27 36 120 16 28 25 28 25 31
Table 14. Copper burden data for juvenile depuration test (µg Cu/g dry wt). Recovery
time (h)
Control 1 Control 2 Control 3 Treatment 1 Treatment 2 Treatment 3 0 78 34 33 306 330 320 24 57 26 27 91 91 199 48 49 24 22 63 59 125 72 39 33 38 43 44 57 96 35 35 20 34 80 54 120 32 27 23 26 41 40
Table 15. Copper burden data for adult depuration test (µg Cu/g dry wt). Recovery
time (h)
Control 1 Control 2 Control 3 Treatment 1 Treatment 2 Treatment 3 0 45 22 19 184 149 173 24 11 23 26 42 17 15 48 9 21 25 13 12 12 72 8 16 20 40 11 12 96 7 29 27 51 13 12 120 10 15 17 13 6 11