Bug Triaging with High Confidence Predictions
Aindrila Sarkar A Thesis in The Department ofComputer Science and Software Engineering
Presented in Partial Fulfillment of the Requirements for the Degree of
Master of Applied Science (Software Engineering) at Concordia University
Montréal, Québec, Canada
December 2019
CONCORDIA
UNIVERSITY
School of Graduate StudiesThis is to certify that the thesis prepared
By: Aindrila Sarkar
Entitled: Bug Triaging with High Confidence Predictions
and submitted in partial fulfillment of the requirements for the degree of Master of Applied Science (Software Engineering)
complies with the regulations of this University and meets the accepted standards with respect to originality and quality.
Signed by the Final Examining Committee:
Chair Dr. Aiman Hanna Examiner Dr. Juergen Rilling Examiner Dr. Yann-Gael-Guéhéneuc Supervisor Dr. Peter C. Rigby Approved by
Dr. Lata Narayanan, Chair
Department of Computer Science and Software Engineering
December 2019
Dr. Amir Asif, Dean
Abstract
Bug Triaging with High Confidence Predictions
Aindrila Sarkar
Correctly assigning bugs to the right developer or team,i.e.,bug triaging, is a costly activity. A
concerted effort at Ericsson has been done to adopt automated bug triaging to reduce development costs. We also perform a case study on Eclipse bug reports. In this work, we replicate the research approaches that have been widely used in the literature including FixerCache. We apply them on over 10k bug reports for 9 large products at Ericsson and 2 large Eclipse products containing 21 components. We find that a logistic regression classifier including simple textual and categorical attributes of the bug reports has the highest accuracy of 79.00% and 46% on Ericsson and Eclipse bug reports respectively.
Ericsson’s bug reports often contain logs that have crash dumps and alarms. We add this infor-mation to the bug triage models. We find that this inforinfor-mation does not improve the accuracy of bug triaging in Ericsson’s context. Eclipse bug reports contain the stack traces that we add to the bug triaging model. Stack traces are only present in 8% of bug reports and do not improve the triage accuracy.
Although our models perform as well as the best ones reported in the literature, a criticism of bug triaging at Ericsson is that accuracy is not sufficient for regular use. We develop a novel approach that only triages bugs when the model has high confidence in the triage prediction. We find that we improve the accuracy to 90% at Ericsson and 70% at Eclipse, but we can make predictions for 62% and 25% of the total Ericsson and Eclipse bug reports,respectively.
Acknowledgments
I would like to take the opportunity to convey my gratitude towards the people who have played an inevitable role in this memorable journey.
I would like to express my sincere gratitude and respect towards my thesis supervisor, Dr. Peter Rigby. This work would not have been possible without his guidance, continuous support and motivation. His valuable advice has always helped me in every phase of this journey, from carrying out the research to writing the paper and the thesis. I have been very fortunate to have a great supervisor like him.
I would like to thank Ericsson Inc for providing me the necessary data and hardware to carry out the research. I am really grateful to my manager Chris Griffiths and my colleagues Béla Bartalos and Vishal Pravin for all the support and suggestions.
I would also like to thank the respectable committee members and other professors and staffs of Concordia University for the help and support I have received from them.
Last but not the least, I would like to thank my parents, my sister and my husband for their continuous love and support which have always been the inspiration in every phase of my life.
Contents
List of Figures vii
List of Tables viii
1 Introduction 1
2 Literature Review 5
2.1 Machine Learning Techniques . . . 5
2.2 Bug Tossing . . . 8
2.3 MSR Techniques . . . 8
2.4 Social Network Analysis . . . 10
2.5 Activity Models . . . 11
3 Triaging Ericsson Bug Reports 18 3.1 Case Study Data and Methodology . . . 18
3.1.1 Textual Attributes . . . 20
3.1.2 Categorical Attributes . . . 21
3.1.3 Alarms . . . 21
3.1.4 Crash Dumps . . . 22
3.1.5 Classification With Logistic Regression Models . . . 23
3.1.6 Evaluation Setup . . . 24
3.2 Ericsson Results . . . 25
3.2.2 RQ2. Crash Traces . . . 26
3.2.3 RQ3. Combined Model . . . 27
3.2.4 RQ4. High Confidence Predictions . . . 28
3.3 Discussion of Threats to Validity . . . 31
3.3.1 Processing of Logs . . . 31
3.3.2 Training Time Period . . . 32
3.3.3 Alternative Classifiers . . . 32
3.4 Ericsson Conclusions . . . 33
4 Triaging Eclipse Bug Reports 35 4.1 Data and Methodology . . . 35
4.1.1 Feature Extraction and Models . . . 36
4.1.2 Evaluation Setup . . . 40
4.2 Eclipse Results . . . 40
4.2.1 RQ1. Replication . . . 40
4.2.2 RQ2. Crash Traces . . . 43
4.2.3 RQ3. Combined Model . . . 44
4.2.4 RQ4. High Confidence Predictions . . . 44
4.3 Threats to Validity . . . 46
4.3.1 Alternative Classifiers . . . 46
4.4 Eclipse Conclusions . . . 47
5 Discussion and Conclusion 49 5.1 Comparison of Ericsson and Eclipse . . . 49
List of Figures
Figure 3.1 Bug report process . . . 19
Figure 3.2 Distribution of bug reports across the 43 teams . . . 19
Figure 3.3 Cleaning alarm logs . . . 22
Figure 3.4 Cleaning crash dumps . . . 23
Figure 3.5 Incremental evaluation setup . . . 24
Figure 3.6 Ericsson Confidence Cutoffs . . . 30
Figure 4.1 Stack Trace Extraction from bug report comments . . . 39
Figure 4.2 Incremental evaluation setup . . . 40
List of Tables
Table 2.1 Comparison of previous works: techniques, attributes, evaluation methods,
and results . . . 14
Table 2.2 Comparison of previous works: techniques, attributes, evaluation methods, and results . . . 15
Table 2.3 Comparison of previous works: techniques, attributes, evaluation methods, and results . . . 16
Table 2.4 Comparison of previous works: techniques, attributes, evaluation methods, and results . . . 17
Table 3.1 Bug report features used in the models . . . 20
Table 3.2 Models of bug reports containing alarm logs . . . 27
Table 3.3 Model features and accuracy . . . 28
Table 3.4 Accuracy of TopN Recommendations . . . 29
Table 3.5 Triaging bugs with above a confidence level cutoff. With a higher cutoff, fewer bugs are triaged, but the accuracy of the prediction improves . . . 31
Table 3.6 Results with limited training data . . . 32
Table 3.7 Results for alternative classifiers . . . 33
Table 4.1 Bug report features used in the models . . . 36
Table 4.2 Fixing Period and Prediction Accuracy of Model M3 . . . 42
Table 4.3 Commit Period and Prediction Accuracy of Model M4 . . . 43
Table 4.4 Comparison of all the models . . . 44
Chapter 1
Introduction
Bug fixing is an integral part of the development and maintenance phase in the lifecycle of a software project. Large critical software projects must deal with bugs quickly. The first step in the process is to triage an incoming bug by assigning it to the team or developer that can fix the bug. The large volume of bug reports submitted daily makes manual bug triaging a time-consuming process. Furthermore, when a bug is assigned to the wrong team or developer, the cost and time to fix the bug is increased.
We conduct a case study at Ericsson, which has a significant number of internal and external bug reports submitted daily. Ericsson uses a bug tracking system developed in-house. The first level of triage involves routing the bug reports to the appropriate team. Human triagers do this job manually. We conduct a second case study on Eclipse bug reports. Eclipse has an average of 48 bugs submitted per day around the release time and 13 bugs after release. Over 58 developers have fixed at least one bugs in 6 months of period. On open source projects many developers fix bugs making the triage problem difficult.
Bug triage has been extensively studied including approaches based on machine learning [6, 13, 26, 32], collaborative filtering [42], social network analysis [22, 58, 72], experience model of developers [40, 49, 65, 69] and mining software repository [28, 33, 35, 45]. The majority of previous works address bug assignment to individual developers as we do for the Eclipse project. In contrast, at Ericsson, bugs are assigned to the development teams not the developers and we assign bugs to 43 teams.
We apply a simple machine learning approach to assign bug reports at Ericsson and Eclipse. Selection of the features is important for supervised machine learning. The majority of triaging techniques in the past use text descriptions of bug reports [6, 10, 13] and categorical attributes, in-cluding product, component, severity [9, 19, 26, 32]. In our work, we find that right selection of categorical features combined with textual contents is effective. For Eclipse, we reproduce Fixer-Cache [54] results by considering active developers. We also explore additional information from the alarm logs, crash dumps, and stack traces attached to the bug reports.
Although our models have a comparable accuracy to other large scale bug triaging research works, they were not sufficient for regular use at Ericsson. While we can suggest the top N devel-opment teams and improve our accuracy, this approach still requires manual triage effort to decide among the top suggestions. Instead, we decide to only triage those bug reports for which the model has high prediction confidence. Using this approach we are able to attain a high accuracy and substantially reduce the manual effort for Ericsson and Eclipse.
The cross validation approach frequently used in prior works (see Table 2.1, 2.2, 2.3, 2.4) is unrealistic because future bug reports are used to assign developers to past bug reports. For our evaluation, we use time split validation and incremental learning across the entire dataset. We answer the following research questions.
RQ1. Replication: How well do existing bug triaging approaches work on industrial and open source projects?
The vast majority of work in bug triaging is conducted on open source projects. In this work, we first replicate the existing research approaches on 9 products at Ericsson. We then replicate the results on a recent Eclipse dataset and also test our novel approach to high confidence prediction. We have two replication questions.
RQ1a. Textual & Categorical: How accurately do models containing textual and categorical features triage bugs?
The most common bug triage models contain the texts of the bug report,e.g.,summary,
descrip-tion and categorical features,e.g.,product, component. We find that a logistic regression classifier
with these simple attributes has an accuracy of 79% and 46% on Ericsson and Eclipse bug reports respectively. While this model serves as a baseline approach, the categorical features have a very
strong predictive power and are difficult to improve upon.
RQ1b. FixerCache: Does a developer’s affinity to working on specific components improve the accuracy of bug triaging?
On open source projects a large number of developer fix bugs, but a smaller core team fix the vast majority of bugs [36]. Wang et al.[54] introduced FixerCache that uses the recent software
component level bug fixing activities of a developer to predict active fixers. Reproducing Fixer-Cache, we create a model that assigns scores to the developers based on their recent activities and find that this model achieves an accuracy of 43%.
This activeness score research question does not apply to Ericsson because teams are always active. We add the software component as a categorical feature for the Ericsson projects in RQ1a. RQ2. Crash Traces: Does the information contained in alarm logs, crash dumps, and stack traces help in bug triaging?
Ericsson Bug reports often contain crash dumps and other log information. We make a novel contribution by determining how well this data helps in bug triaging. Alarm logs and crash dumps are available for only 51.17% and 5.52% of all Ericsson bug reports. Even when we train the models with the subset of bug reports that contain the alarms, there is no improvement in the accuracy when compared with the model that contains only the textual and categorical features.
Only 8% of Eclipse bug reports contain the stack traces. Using the infoZilla tool [11] we extract the stack traces and the packages in which the error occurred. We make a commit score based model by assigning the scores to the developers based on the recent code commits done by the developer and recommend developers according to their scores. We find that this model achieves 16% accuracy.
RQ3. Combined Model: Does the model trained with text, categorical and log features im-prove accuracy of bug triaging?
At Ericsson, we train a logistic regression model by combining the textual and categorical fea-tures and the feafea-tures extracted from the alarm logs and the crash dumps. This model does not improve accuracy and achieves 78.85% accuracy.
In contrast, for the Eclipse case study we have different modelsi.e.,supervised classifier,
that this complex model achieves an accuracy of 46.78% with a less than 1 percentage point gain. RQ4. High Confidence Predictions: What is the impact of high confidence prediction on the accuracy of triaging?
At Ericsson, even the highest accuracy of 79% was too low to be used in production. Previous works have dealt with this issue by suggesting the top N developers. Although we have a Top3 accuracy above 90%, Ericsson did not like this approach because it still requires manual interven-tion. In contrast, we use the novel approach of making predictions only when the model has high statistical confidence in the predicted developer. At Ericsson, when we set the cutoff confidence to 90% we are able to triage the bug reports with an accuracy of 90%. This level of confidence means that we automatically triage 61% of the total bug reports, leaving the remaining 39% to be manually triaged. High confidence bug triage is currently being used in production at Ericsson.
We apply the high confidence prediction approach on the logistic regression classifier trained with textual and categorical attributes on the Eclipse bug reports. We vary the cutoff confidence and find that the best trade-off between accuracy and the number of automatically triaged bugs is that we achieve is 70% accuracy and 25% predicted bug reports.
This thesis is structured as follows. In Chapter 2, we describe the existing research literature. In Chapter 3 we explain the testing and triaging process at Ericsson, the case study dataset, the methodology, the experimental results, and the threats to validity. In Chapter 4, we use the same sections to present the Eclipse case study. In Chapter 5, we contrast the Ericsson and Eclipse results, describe our contributions, and conclude the work.
Chapter 2
Literature Review
In this section, we discuss the related work in the context of the recommendation technique, the attributes of the bug reports used to train the model, the evaluation metrics, the evaluation setup, and the resulting accuracy of bug triage. Tables 2.1, 2.2, 2.3, and 2.4 summarize the related works.
We divide the previous works in five categories. The bug fixer recommendation techniques used in the previous works explore a wide range of approaches including machine learning (ML) [7, 14, 63], bug tossing graph models [23, 24], mining software repositories (MSR) [33, 48], social network analysis [64, 67], and developer activity models [37, 40].
Information retrieval (IR) techniques [2, 29] have been widely used in almost all categories of bug triaging techniques. A significant number of researchers [6, 46] use the common IR approach of Term Frequency multiplied by inverse document frequency (TF-IDF) to vectorize texts. Some authors [2,28] also used other IR techniques including Latent Semantic Indexing (LSI) to reduce the dimensions of term vectors. Latent Dirichlet Allocation (LDA), a popular topic modelling algorithm has also been used by many authors [41, 60, 62, 70]. Some researchers [19, 45] also used natural language processing (NLP) techniques to mine informative terms from the texts.
2.1
Machine Learning Techniques
Previous works investigate different techniques with a majority of them analyzing textual informa-tion of the bug reports. A wide variety of classifiers including Decision Tree, SVM, Naive Bayes and
ensemble classifier [3, 6, 20, 39] has been used in the previous works. Recent works [18, 31, 34, 59] also investigate the use of deep learning techniques such as convolutional neural network (CNN) with Word2Vec as word embedding technique.
The early work by Anvik et al. [6] vectorize the text of the summary and description by normal-ized TF-IDF and use Naive Bayes, SVM and C4.5 to identify an appropriate fixer. Evaluating on a fixed test dataset, they achieve a maximum precision of 64% and 59% on Mozilla and Eclipse bug reports. In a later work [7], they generalize beyond a single fixer to recommend potential developers that can fix the bug and other developers that can be interested in the process and the component of the bug. In this work they achieve 75% precision and 13% recall for Top1 recommendation on Eclipse. For Top2 and Top3 recommendation they achieve 60% and 51% precision and 20% and 24% recall respectively.
Lin et al. [32] perform an empirical study on bug assignment in industrial projects. They vector-ize the textual contents with TF-IDF and train a SVM classifier. They also explore the categorical fields of the bug reports and use decision tree that outperforms SVN. On bug reports of a proprietary software project, evaluating with 10 fold cross validation they achieve an accuracy of 77.64%.
Banitaan et al. [9] use a Naive Bayes classifier traditional TF-IDF and Chi Square for feature selection and Naive Bayes as the classifier. On the Netbeans dataset containing 71 developers, using 5 fold cross validation, they achieve are 66% precision and 63% recall. But on the Eclipse dataset containing 61 developers, they achieve a precision and recall of 49% and 48% respectively.
Canfora et al. [13] use probabilistic textual similarity for change request (CR) assignment. For every developer, they build a descriptor (i.e.,vector of terms) using short and long description of
the CRs that the developer has fixed. The probabilistic model compares the new CR descriptor to developer descriptors to recommend fixers. They achieve a Top1 recall of 59% and 32% respectively on KDE and Mozilla dataset
Ahsan et al. [2] did a comparative analysis of different information retrieval and machine learn-ing algorithms. They also investigate the use of LSI for reduction of dimensions of term vectors. They combine this with various classifiers and get the best results with SVM. The accuracy, preci-sion and recall they achieve on Mozilla bug reports are 44.4%, 37% and 35% respectively.
single recommender. To train the individual classifier, they use the textual contents and categorical attributes of the bug reports of industrial projects. They use the bug reports of industrial projects and the best accuracy they achieve using 10 fold cross validation is 85%. When they evaluate using time split validation they get 65% accuracy.
Florea et al. [19] develop a spark based fixer recommender system. Using NLP, they only preserve nouns from the texts and use TF-IDF for vectorization. They also use other attributes including product and component. SVM with liblinear outperforms other classifiers on their dataset. Evaluating on a small dataset of Eclipse bug reports with 76 developers, they achieve a precision and recall of 89% and 88%.
Lee et al. [31] use convolutional neural network (CNN) with Word2Vec on text. The highest accuracy they achieve is 85% on industrial projects and 46% on Eclipse. Chen et al. [15] extend this work on incident triaging and perform a comparative study among deep learning, supervised classifiers, KNN, topic modelling, tossing graph, and fuzzy based techniques. On bug reports of industrial projects, the highest accuracy they achieve using deep learning is 71%.
The main drawback of cross fold validation used in the previous works [26, 27, 32] is that it uses future bug reports to predict past bug reports. Also evaluating a supervised classifier’s performance on a small test dataset is not appropriate. Where as we evaluate our techniques using a more realistic time split based approach on a large dataset.
Also there is a big difference in the approach how we filter out inactive developers. Previous works [6,7,60] manually remove the developers that have fixed less number of bugs in their training data set. The biggest drawback of this approach is if a developer has just started fixing bugs recently, due to fixing less bugs he/she might be removed from the training dataset, but that developer can be a potential fixer in the future. We take a more realistic approach by removing developers that have become inactive in last few months and not by only looking at the number of bugs fixed by the developer in the dataset.
2.2
Bug Tossing
The reassignment of a bug that has been incorrectly triaged first time, i.e.,bug tossing, has been
studied by some researchers [16, 21, 24]. This technique constructs a graph model capturing the tossing probability between the teams.
Jeong et al. [24] introduce the idea of using markov model based bug tossing graphs to recom-mend fixers of a bug. They use Naive Bayes and Bayesian Networks with TF-IDF and integrate tossing graph information into the prediction of the classifiers. Evaluating on a fixed sized test data set, they achieve a Top2 and Top5 accuracy of 58% and 77% on Eclipse and corresponding accuracy of 55% and 70% Mozilla.
Bhattacharya et al. [12] extend this work by using categorical features including product and component of the bug reports. They use these features to train the classifier and also into the tossing graph. Using time split evaluation and incremental learning they achieve a Top1 and Top5 accuracy of 30% and 77% on Eclipse and corresponding accuracy of 32% and 77% Mozilla.
2.3
MSR Techniques
Software repositories, such as source code and version tracking systems, contain important histor-ical information of how a system was developed and maintained. Researchers [33, 48] mined this information to help in bug assignment. These techniques mainly focus on predicting a set of poten-tial source code locations for a bug report and then identifying which developers actively modified that part of code
Matter et al. [35] introduce an information retrieval and vocabulary based approach. They create a term author matrix where terms are collected from the changes files and authors indicate the de-velopers that contribute code to the version repository system. The word frequencies of the changes files are assigned to the contributor’s bag of words. For an incoming bug report, they recommend developers whose commit vocabulary is most similar to the vocabulary of the bug reports by com-puting cosine similarity. Evaluating on a fixed sized test data set of Eclipse, they achieve 34% Top1 precision and 71.0% Top10 recall.
create a corpus for every source code file. The corpus indexed by LSI is then used to compute the similarity with the bug descriptions to predict the files related to the bug. They recommend developers based on their activities with these files in the version repository. They achieve 80% and 82% accuracy on KOffice and Eclipse dataset containing 18 and 14 bug reports respectively.
Shokripour et al. [45] use NLP to mine the nouns in commit messages, comments in the version control system, identifiers of the source code, and previously fixed bug reports. They create a noun-file pair index and assign weights to the nouns based on their frequency of appearance in the information sources related to the files. File relevance is calculated by adding the weight of the noun terms that appear in the file and the bug report. Two top most relevant files are predicted. Developers are recommended based on their expertise with the predicted files. Evaluating on Eclipse JDT bug reports containing 9 developers, they achieve 48% Top1 accuracy and 89% of Top5 accuracy.
In another work, Shokripour et al. [47] use the phrase compositionsi.e.,a NLP technique from
the comments of the commits and the bug descriptions. Files that have the most similar phrase compositions with the bug report are predicted. They recommend the developers that are most active on the predicted files. They achieve 31% Top1 accuracy and 70% Top5 accuracy on Eclipse bug reports.
Linares et al. [33] use code authorship information, identifiers and comments of the source code file. Similarity of the corpus indexed by LSI is computed between the files and the bug report description with the author of top N most similar files being recommended. Evaluating on a small dataset of ArgoUML containing less than 150 bug reports, the best precision and recall, they achieve is 63% and 64% respectively.
The main challenges of these approaches are that accuracy of predicting the fixer depends on the accuracy of prediction of relevant files [30, 38, 53, 57]. That’s why the low Top1 accuracy is obtained. So, we tried to extract the packages from the stack traces because the bugs are more likely to happen in those packages. Developers that actively modify the packages are the potential developers. Unfortunately very few bug reports contain stack traces. So our approach also gives low accuracy.
2.4
Social Network Analysis
Developers often collaborate with each other in the bug resolution process. Social network analysis originated from sociology attracted some researchers [64,67] to model the bug assignment problems using a network of developers as nodes and their collaborations as edges. Although a bug is assigned to a single developer, but other developers also make comments or attach patches, screenshots to help in resolving the bug. So researchers were interested to recommend the developers that have the expertise or interested in that bug instead of predicting the assignee.
Xuanet al.[64] proposes developer’s prioritization using a socio-technical approach. They rank
developers by the priorities for a predicted list of developers by a classifier. Using time split evalu-ation and incremental learning, they report an accuracy of 31%, 48% and 53% for Top1, Top3 and Top5 recommendation respectively on Eclipse dataset. The corresponding accuracies on Mozilla dataset are 29%, 49% and 56% respectively.
Zhang et al. [72] combine social network analysis with machine learning. Developer’s con-tribution score determined by fixing, commenting, reporting bugs is added to the classifier score to recommend the developers. Using time split evaluation and incremental learning, they achieve a Top1, Top3 and Top5 accuracy of 43.98%, 74.38% and 86.01% on Eclipse and corresponding accuracies of 33.30%, 56.66% and 68.95% on Mozilla.
Hu et al. [22] propose BugFixer which computes the similarity with other bug reports and rec-ommends the developers by constructing a network with the associations among the developers, components, and bugs. Using time split evaluation and incremental learning, they achieve a Top1, Top3 and Top5 accuracy of 42%, 67.31% and 73.85% on Eclipse bug reports, although when they evaluate the technique on industrial projects, they get a Top1 accuracy around 29%.
Zhang et al. [68] use IR techniques to find the similar bugs. They propose a hybrid algorithm combining probability model and experience model. They analyze a developer’s fixing probability based on a social network technique and fixing experience computed by the number of bug reports fixed and assigned by the developer. They achieve an F score of 25% on Eclipse bug reports.
Wu et al [58] propose a new approach DREX. They apply KNN to find some most similar bug reports. Then they rank the developer’s expertise using social network metrics by considering their
activities in the resolution of similar bug reports. For a new bug report, the developers with high ranks are recommended. The best recall they achieve on Firefox bug reports is 65% for Top10 recommendation.
Wang et al. [55] develop a framework DevNet to analyze developer’s collaboration. For a new bug report, they predict a list of potential developers by machine learning classifier. For every developer in this predicted set, DevNet predicts another developer who has the highest probability of collaboration by constructing a developers network. From this combined set, top N developers are predicted. For Top2 and Top5 recommendation, they achieve an accuracy of 59% and 65% respectively on Eclipse bug reports.
Researchers have mostly used the social network based techniques to recommend a set of de-velopers that have expertise on the bug report instead of predicting just the bug fixer. The goal of our study is different because we focus on automation of bug report assignment.
2.5
Activity Models
In recent years, researchers [8, 49, 71], have focused on specialized techniques that model devel-oper’s expertise by their activities including fixing, commenting and reporting the bugs. Researchers also used these techniques to recommend a set of expert developers instead of predicting just the fixer.
Tamarawi et al. [49] develop a fuzzy set and cache based tool called Bugzie that maintains a fuzzy set of developers for every technical term. It predicts the developers by modelling the fix-ing correlation of developers with the technical terms based on their fixfix-ing activities in the past. From the developers cache, it recommends the developers who recently participated in bug resolu-tion. Using time split evaluation and incremental learning, they achieve an accuracy of 51.2% on FreeDesktop and 38.9% on Eclipse bug reports.
Wang et al. [54] introduce FixerCache which introduces a developer cache for every component of the product. Developers are prioritized by their activeness scores determined by their recent fixing activities. Given a new bug report, they recommend developers with highest activeness score from the developer cache of the component to which the new bug report belongs. They achieve
an accuracy of 54.32% and 53.78% respectively on Eclipse JDT and Platform bug reports between 2002 to 2009. We reproduce this work in our Eclipse dataset between 2011 and 2019 and achieve 43.40% accuracy.
In their paper they study the diversity. Their Top1 recommendation is low and they suggest the top or most active developers. They achieve a high diversity in Top10 recommendation by suggest-ing rare developers. It is unclear how useful recommendations beyond the Top1 suggestion are as our industrial partner states that inaccurate Top1 recommendations lead to developers completely ignoring triage suggestions.
Zhang et al. [69] propose an approach that combines topic models and the relationship between the bug reporter and the fixer. They recommend the developers based on the correlation score of a developer with a topic and an active reporter. They achieve an F-Score of 70% on a small test data set of Eclipse and Mozilla.
Naguib et al. [40] propose an approach leveraging topic modelling and the developer’s activities, including review, fixing and assigning bug reports. They recommend the developers based on the association scores towards the topics of the bug reports determined by these activities. The best accuracy that they achieve on a test data set of BIRT project containing less than 50 developers is approximately 30%.
Tianet al.[50] propose a technique based on learning to rank machine learning algorithm that
combines information from both developer’s previous activities and suspicious program locations associated with a bug report based on the similarity feature. They achieve 42% of Top1 accuracy and 93% of Top5 accuracy on Eclipse JDT dataset, however on ArgoUML project they report 30% of Top1 accuracy.
Yang et al. [65] propose a new method by introducing topic model and multiple feature includ-ing product, component, severity, priority. They extract the set of candidate developers who have contributed to the bug reports having same topic and the features and rank them by the scores de-termined using their number of activitiese.g.,commits, comments, bug assignment. Evaluating on
1000 Eclipse bug reports, they achieve an accuracy of 63%.
Xia et al. [60] extend the basic topic modelling algorithm LDA and propose multi feature LDA that includes product and components. They recommend the developers based on the affinity scores
of a developer towards a topic and the feature combination. Using time split evaluation, they achieve an accuracy of 68% on Netbeans bug reports. Evaluating on Eclipse bug reports they achieve 61% accuracy.
Xie et al. [62] develop a new approach called DRETOM based on Topic Model to recommend developers for bug reports. LDA is applied on the text contents of the bug reports to map each bug report to a single topic. The association between the developer and the bug is determined by a probabilistic model that combines the probability of a bug belonging to a topic and probability of a developer fixing bug on that topic. According to the probabilities DRETOM ranks the develop-ers. They achieve a recall of 42% and 82% respectively for Top5 recommendation on Mozilla and Eclipse bug reports.
Xia et al. [61] proposed a technique called DevRec. For every developer they determine the bug report based score by a KNN and developer based score by their affinity scores towards topic, terms, product and the component. They rank the developer combining these two scores. The best recall that they achieve on Eclipse bug reports are 79% ad 89% for Top5 and Top10 recommendation respectively.
T echnique Attrib utes Used Best Result Ev aluation ML based Others T extual Nominal Others Accurac y Precision Recall F Score vik et [6] SVM with TF-IDF -Summary , Description -64% (top1) 10% (top1) -On fix ed test data et al. SVN, Deci-sion T ree -Summary , Description
Module, Phase, Priority
-77.64% (top1) -10 fold cross v alidation [9] Nai v e Bayes with TF-IDF & Chi-Square -Summary , Description Reporter , Component -66.6% (top1) 63.8% (top1) -5 fold cross v alidation [13] -Pro- babilistic IR Summary -59% (top1) -On fix ed test data et [2] SVM with TF-IDF & LSI -Summary , Description -44.4% (top1) 37% (top1) 35% (top1) -On fix ed test data [26] Ensemble stack ed generalizer -Summary , Description Submitter , Site, Re-vision, Priority -85% (top1) 65% (top1) -10 fold cross, T ime split v alida-tion et [19] SVM with Liblinear , TF-IDF & chi-square -Summary , Description Product, Component -89% (top1) 88% (top1) -On small test data T able 2.1: Comparison of pre vious w orks: techniques, attrib utes, ev aluation methods, and results
A uthor T echnique Attrib utes Used Best Result Ev aluation ML based Others T extual Nominal Others Accurac y Precision Recall F Score Jeong et al. [24] -ML with Bug T ossing Graph Summary , Description -77.14% (top5) -On fix ed test data Bhatta- charya et al. [12] -ML with multi feature b ug tossing Summary , Description
Product, Compo- nent
-38.03% (top1) -T ime split v alidation Matter et al. [35] -Similarity of v ocab ulary by IR
-Source code, Com- mits 34% (top1) -On fix ed test data Kagdi et al. [28] -MSR for source codes predicted by IR Description
-Source code, Com- mits 94% (top1) -On small test set (18) Shokripour et al. [47] -MSR for files predicted by phrase similarity Summary , Description -31% (top1) -Shokripour et al. [45] -MSR for source codes predicted by NLP Summary , Description
-Source codes, Com- mits 48.23% (top1) -On fix ed test data Linares et al. [33] -Authors of source codes predicted by IR techniques Summary , Description -source codes -63% 64% -On fix ed test data T able 2.2: Comparison of pre vious w orks: techniques, attrib utes, ev aluation methods, and results
A uthor T echnique Attrib utes Used Best Result Ev aluation ML based Others T extual Nominal Others Accurac y Precision Recall F Score Zhang et al. [72] -ML & social netw ork analy-sis Summary ,
Descrip- tion, Com- ments Compo- nents -43.98% (top1) -T ime split v alidation Hu et al. [22] -Social netw ork of de v eloper , code com-ponent & b ug Summary , Descrip- tion
-Commits, Change sets
-42.36% (top1) -T ime split v alidation Zhang et al. [72] -IR & so-cial netw ork analysis Summary ,
Descrip- tion, Com- ments
-25% (top 1) T ime split v alidation T amra wi et al. [49] -De v eloper’ s expertise via fuzzy set Summary , Descrip- tion -51.2% (top1) -T ime split v alidation W ang et al. [54] -Caching de-v eloper’ s component lev el acti vities -Compo- nents -54.32% (top1) -T ime split ev aluation Zhang et al. [69] -T opic mod-elling & correlation with b ug reporter Summary , Descrip- tion Reporter -71% (top1) On fix ed test data T able 2.3: Comparison of pre vious w orks: techniques, attrib utes, ev aluation methods, and results
uthor T echnique Attrib utes Used Best Result Ev aluation ML based Others T extual Nominal Others Accurac y Precision Recall F Score et [40] -T opic Mod-elling & de v eloper’ s acti vity profile Summary , Description Compo- nent -30% (top 1) -On fix ed test data ang et [65] -Using topic modelling & de v eloper’ s expertise score Summary , Description
Product, Com- ponent, Priority
-63% (top1) -On fix ed test data et al. -Multi fea-ture topic modelling Summary , Description
Product, Compo- nent
-68.68% (top1) -T ime split v alidation et al. CNN with W ord2V ec -Summary , Description -85% (top 1) -Fix ed test data et [15] SVM, KNN, NB, CNN T opic Mod-elling, T ossing Graph, Fuzzy Set Summary , Description -71% (top 1) -Fix ed test data et
Logistic regression with
TF-IDF -Summary , Description Multiple e.g ., Product Machine dumps -78.09% (top 1) 79.00% (top1) -T ime split v alidation T able 2.4: Comparison of pre vious w orks: techniques, attrib utes, ev aluation methods, and results
Chapter 3
Triaging Ericsson Bug Reports
Bug triagers at Ericsson manually assign the bugs to the development teams which is tedious and time consuming. Developers at Ericsson are interested in automating the process, and require high accuracy because incorrect bug assignment will require re-triaging. Developers prefer to manually triage bugs than have many incorrectly triaged bugs that need to be reassigned. We conduct a case study at Ericsson on over 10K bug reports. This chapter is structured as follows. In Section 3.1, we explain the testing and triaging process of Ericsson. In Section 3.1, we describe our case study dataset and the methodology of our approach. In Section 3.2, we present the results. In Section 3.3, we describe the threats to validity. In Section 3.4, we provide Ericsson specific conclusions.
3.1
Case Study Data and Methodology
Ericsson develops and maintains large and critical software projects. Figure 3.1 shows where bug reports originate from: internal testing including integration, validation and performance testing, and customers. After code is committed, it runs through multiple levels of testing from low level unit tests run by developers to expensive simulations of real world scenarios on hardware. When a test fails, testers investigate whether it is an environmental problem or a product fault. If it is determined to be a product fault, a bug report is created and triaged. Ericsson customers are large telecom providers and in this work, there are bug reports from over 300 customers. At Ericsson, the triage process is done at the team level instead of individual developers.
Figure 3.1: Bug report process
We collect all the bug reports with status FIXED and reported between July 2016 to the end of June 2018. We keep the duplicate bug reports in our dataset as previous work [10] has shown that duplicate bug reports are useful. Our dataset contains 11,570 bug reports, fixed by 43 teams, across 9 products. There are 301 customers reporting the bugs. 51% of bug reports contain alarm logs and 5.5% of bug reports contain crash dumps. Figure 3.2 shows the number of bugs fixed by each development team. The data set is quite skewed with 81% of the reports being fixed by 8 teams.
The data attributes that we extract from the bug reports are summarized in Table 3.1. The at-tributes are of three types -Textual Attributese.g.,summary, description, and answerCategorical Attributese.g.,product, customer, site, submitter, priority, configuration, and generation of product Log Attributese.g.,alarms and crash dumps
Type Feature Description
Text Summary A short description of the issue
Text Description Detailed description of the issue. e.g.,Configuration of the hardware, steps to reproduce the issue etc. Text Answer Description of the final solution made to fix the issue Categorical Product Product that the issue was found on
Categorical Customer Customer that uses the product the issue was found on
Categorical Site Location the issue was reported from e.g., Ottawa-Canada, Kista-Sweden
Categorical Submitter Team that reported the issue
Categorical Priority Priority of the issue.e.g.,Major, Medium, Minor Categorical Configuration Higher level category of the product.e.g.,Baseband,
Radio Software etc.
Categorical Generation Generation of the product.e.g.,Gen1, Gen2 etc. Log Alarms Software and hardware errors or warnings that can
be potential threat for the system
Log Crash Errors Errors generated by a program or processor crash Table 3.1: Bug report features used in the models
3.1.1 Textual Attributes
We extract the textual data from the summary, description, and answer of the bug reports. The answer is written by the developer at the time of closing the bug report, so we use this field in training data set only, not in the validation data set.
Preprocessing: We apply the standard preprocessing steps on the textual contents including tok-enization, stop words removal, and stemming. Tokenization splits the text into multiple tokens. By applying stemming, the words are converted into their root forms. Stop words are the frequently used insignificant words which are removed. The terms which are very rare and appear in very few documents are also removed.
Feature Extraction: In most of the works focusing on prediction of bug report assignee using machine learning, conventional TF-IDF term weighting scheme has been used to vectorize the texts [6, 19, 26]. After preprocessing we apply normalized TF-IDF to the text contents.
Definition 1. T F −IDFti,bj =tftibj × 1 +log
1+B
1+b(ti)
!
B denotes the total number of bug reports, tftibj is the number of occurrences of term ti in bug reportbj andb(ti)is the number of bug reports in which termtihas occurred.
3.1.2 Categorical Attributes
Along with text attributes, categorical attributes of the bug reports play a very important role in bug triaging. Categorical features have been widely used in the context of bug report assignee recommendation [9, 19, 26, 32]. We use the following categorical features: 1. Product 2. Customer 3. Site 4. Priority 5. Submitter 6. Configuration 7. Generation of the product.
Feature Extraction: Using one hot encoding we convert the categorical features into a binary feature vector to train the classifier. In one hot encoding, a categorical attribute of every data sample containing a particular value is represented by a binary vector. The length of the binary vector is the number of all possible values of a categorical attribute. The binary vector of a data sample contains only one in the position of the value that the data sample holds for the particular categorical attribute and zeros in the position of the remained of the values of the categorical attribute.
3.1.3 Alarms
Alarms are software and hardware errors [25] and warnings that can be a potential threat for the system. Ericsson uses a log processing tool to extract the alarms occurring on the digital and radio
units. The alarms listed in the dump are used by the testers to identify the most pertinent part of the potential problems.
Processing:Using the internal log processing tool, we extract the alarms. We also extract the crash date if there is any program crash. The machine dumps may contain logs of several days if the nodes are not cleared. We look for alarms occurring on the day of crash. If there is no crash, we look for the alarms occurred on the last date in the log. For a specific problem, there can be multiple causes. We concatenate the text of the problem and cause together to make it a single line. Then we select unique lines of problem and cause, removing the duplicate ones. Figure 3.3 illustrates this process. Feature Extraction: Instead of applying TF-IDF at term level, we apply it at line level. As we select only the unique lines, line frequency in this case is either 0 or 1. That is why it is referred by Line-IDF [4].
Definition 2. LIN E−IDFl= 1 +log
1+A
1+Al
!
A denotes the total number of logs. Aldenotes the number of logs that contain the log line l.
Figure 3.3: Cleaning alarm logs
3.1.4 Crash Dumps
Within the machine dump, there is a postmortem log which is generated when there is a program or processor crash. These logs contain traces and errors with the timestamp and source code file name, the trace or error is generated from and the trace or error message. The file names and error
messages have the potential to be a good feature for bug triaging as the development teams may have some affinity towards a particular type of source code or error messages [1].
Processing: Using an internal Ericsson tool, we process the postmortem logs and extract the file names and the error messages of the crash errors. First, we clean the error messages by removing hexadecimal codes and all the non alphabetic characters and ensure that each error message is unique. Figure3.4 illustrates this process.
Feature Extraction: Error messages contain multiple terms. Instead of using the terms as the unit of analysis, we apply the weighting scheme Line-IDF [4] at the line level. However for the source code file, TF-IDF is applied at term level as unlike error message they contain a single term.
Figure 3.4: Cleaning crash dumps
3.1.5 Classification With Logistic Regression Models
We use L2-regularized Logistic Regression with Liblinear solver [17] for classification. Logistic regression outperforms NaiveBayes, SVM, and KNN (see Section 3.3). For the best performing model, we vary the cutoff confidence score and analyze its impact on the bug triaging accuracy. The classifier determines the probability for every class. Like a linear classifier, Logistic Regression Classifier multiplies the class specific weights (Wy) with the input features (X) and adds a bias
probability of the data sample belonging to each class. The class with the highest probability score is selected as the class decided by the classifier. We refer to the probability of the decided class by confidence.
Suppose there are k classes denoted by j = 1 to k. Sy is the linear score for the class Y and
P(Y|X)is the probability of the class Y.
Sy(X) =WytX+b P(Y|X) = exp(W t yX+b) Pk j=1exp(WjtX+b)
We tune the regularization parameter, C, of the logistic regression classifier. This parameter controls the overfitting. The default value of C for the logistic regression classifier of scikit-learn library is1.0. We run the model varyingC = 1.0toC = 10.0and find that after C = 5.0, the accuracy vary by less than0.30percentage points. As a result, we report the values atC=5.0.
3.1.6 Evaluation Setup
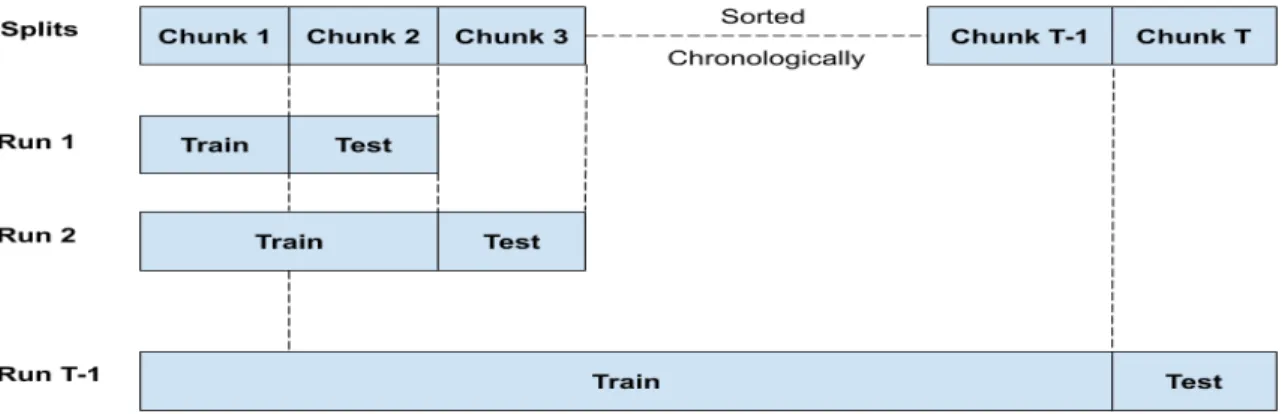
Figure 3.5: Incremental evaluation setup
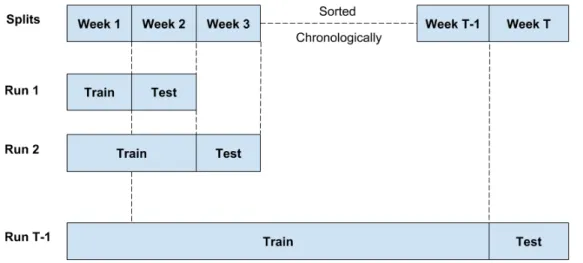
To evaluate how well each attribute in the data helps in triaging bugs, we use a time split evalu-ation with an incremental learning framework that is common in the research literature [12, 54, 60].
We collect the bug reports of two years and sort them in chronological order. We split the dataset on a weekly basisW. We train onW =1toW =T −1and test on weekT. Figure 3.5 illustrates our evaluation setup. We have experimented with alternative time frames,e.g.,months, and removing
older data. We find that the difference in accuracy is nominal with a decrease of .27 percentage points (see Section 3.3).
We create models to test each of our features independently as well as in the context of a model that combines multiple features. In total, we describe 8 models.
3.2
Ericsson Results
3.2.1 RQ1. ReplicationHow well do existing bug triaging approaches work on industrial and open source projects? The simplest bug triaging approach uses a classification model with the textual descriptions con-tained in the bug reports worked on by each team or developer [6, 19]. Inclusion of categorical attributes such as products, components is also an obvious method to triage bugs [9, 32]. For this research question, we implement existing traditional model to determine how well they work on Ericsson bug reports.
RQ1a. Textual & Categorical: How accurately do models containing textual and categorical features triage bugs?
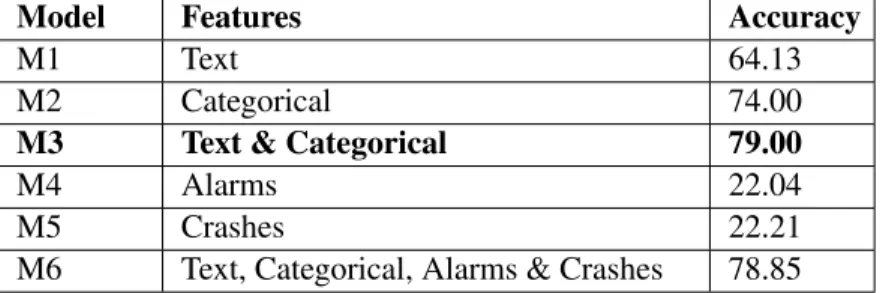
Model M1: Bug-Triaging model with only text:
This simple model uses only text attributes of bug reports such as the summary and description and answers. We apply standard NLP preprocessing and use TF-IDF as the term weighting scheme (see Section 3.1.1). In Table 3.3, the text only model has an accuracy of 64.13% respectively.
Model M2: Bug-Triaging Model with only categorical features:
We implement another simple model using categorical features including products, customers. In Table 3.3, we see the model with categorical features outperforms the text model with an accuracy of 74% respectively.
Model M3: Bug-Triaging Model with Text and Categorical:
Combining the categorical and text features, we observe an accuracy of 79%. In Table 3.3, we see that this model outperforms M2 with an increase in accuracy of 5 percentage points respectively.
Model 3, which has both textual and categorical attributes, performs triaging of bug reports with an accuracy of 79%. Categorical features have the strongest predictive power.
3.2.2 RQ2. Crash Traces
Does the information contained in alarm logs, crash dumps, and stack traces help in bug triag-ing?
Bug reports often contain crash dumps and other log information. We make a novel contribution by determining how well this data helps in bug triaging. We use the internal Ericsson tools to extract alarm and crash details from the logs. The extracted information is textual and is processed using Line-IDF as described in Section 3.1.4. This information is more difficult to extract than textual and categorical attributes of the bug reports.
Model M4: Bug-Triaging Model with only alarms:
This model is trained with the alarms contained in logs. The alarm contains both problem and cause, so we use Line-IDF to capture the entire alarm text. In Table 3.3, the alarm model achieves an accuracy of 22.04%. Across all bug reports, alarms are a poor feature for bug triaging.
Model M5: Bug-Triaging Model with only crash dumps:
The model is trained with the crash error messages and the source code file names extracted from the crash dumps. We use Line-IDF for the crash error messages. In Table 3.3, we see that this model achieves an accuracy of 22.21%. We observe that only 5.52% bug reports contain the crash dumps. The scarcity of bug reports with attached crash dumps and the low predictive power make crash dumps a poor feature for bug triaging.
Model M7 and M8: Bug reports that contain alarms:
Half of the bug reports, 51.17%, contain alarms. We train two models on the bug reports that contain alarm logs. First, we use the text and categorical features from our best model, M3, but train and testModel M7only on the bug reports that contain alarms logs. In Table 3.2, we see that this model achieves an accuracy of 72.80%.
Then we create Model M8that adds alarms to M7 to determine if these alarms improve the accuracy on bug reports that contain alarms. In Table 3.2, we see model M8 achieves accuracy of 72.28%. We see a slight reduction in accuracy with M8 and conclude that at Ericsson, the alarms do not provide information that improves the accuracy of bug triaging. Performing same experiments as model M7 and M8 with crashes have not been possible due to scarcity of bug reports containing crash dumps.
Model Features Accuracy
M7 Text & Categorical 72.80 M8 Text, Categorical & Alarms 72.28 Table 3.2: Models of bug reports containing alarm logs
3.2.3 RQ3. Combined Model
Does the model trained with text, categorical and log features improve accuracy of bug triaging? We create a combined model to determine how much additional predictive power this alarm and crash information add to existing models containing textual and categorical attributes.
Model M6: Bug-Triaging Model with Text, Categorical, Alarms, and Crash features:
This model includes all the attributes that we collect from the bug reports: text, categorical, alarms, and crash dumps. In Table 3.3, we see that this model achieves a accuracy of 78.85%. Surprisingly this additional information does not improve the accuracy of bug triaging. Although text and cat-egorical information are sufficient, for completeness, we create individual models for alarms and crash dumps to determine their independent ability to triage bugs.
Alarm logs and crash dumps are available for only 51.17% and 5.52% of all bug reports. Even when we train the models with the subset of bug reports that contain the alarms, there is no improvement in accuracy when compared with the model that contains only the textual and categorical features.
Model Features Accuracy
M1 Text 64.13
M2 Categorical 74.00
M3 Text & Categorical 79.00
M4 Alarms 22.04
M5 Crashes 22.21
M6 Text, Categorical, Alarms & Crashes 78.85
Table 3.3: Model features and accuracy
3.2.4 RQ4. High Confidence Predictions
What is the impact of high confidence prediction on the accuracy of triaging?
The distribution of bug reports that each team fixes is highly skewed, with a small number of teams fixing most of the bugs, see Figure 3.2. At Ericsson, developers suggested a novel approach by triaging only those bug reports for which the confidence in the prediction is high.
TopN Recommendation:
As the problem of bug triaging deals with a large number of developers or teams, researchers are often interested to evaluate the performance of the models with TopN recommendation [54, 60, 65]. In this section, we report the accuracy of our model in order to be able to make comparisons with the results of other works done in this context.
We use best performing model M3, to evaluate the model’s performance of recommending N teams. We select the TopN development teams predicted by model M3 and consider a hit in accuracy if the actual team that fixed the bug is in the list of TopN. In Table 3.4, we see that the model achieves 86.63% and 90.02% accuracy for recommendation of Top2 and Top3 development
teams respectively. The percentage point increase in accuracy for Top2 and 3 recommendation are 7.63% and 11.02% respectively from Top1 recommendation.
TopN Accuracy Top1 79.00 Top2 86.63 Top3 90.02
Table 3.4: Accuracy of TopN Recommendations
We have 43 development teams to assign the bug reports to and achieve Top1 accuracy of 79%, while other researchers tend to focus on the core developers with between 25 and 1,000 developers. The previous works that have a hundreds of developers and evaluate using time split validation like us, tend to have low Top1 accuracy, for example 68% with 405 developers [60], 54% with 238 developers [54] and 43% with 77 developers. Our accuracy is also comparable with existing works that have a similar number of developers and evaluated on a fixed test data for example 77% with 76 developers [19], 28.60% with 11 developers [22].
For Top1 to Top3 recommendation, the accuracy is 79.00%, 86.63%, and 90.02% respec-tively.
High Confidence Bug Triaging:
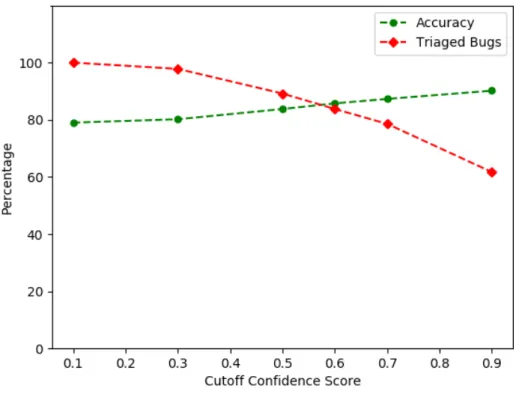
With TopN predictions, a developer still needs to manually assess the triage recommendation and assign it to a particular team or developer. Ericsson wants automated bug triaging and decided to automatically triage only those bug reports that the model had high confidence in the prediction (refer to 3.1.5). Since the data is skewed with some teams fixing many bugs, the confidence that the model has in each prediction varies. There is a trade-off between accuracy and the number of predictions. We set a cutoff for the confidence score and we remove the predictions with confidence lesser than the cutoff. In Figure 3.6, we plot the percentage of predictions and accuracy with varying cutoff confidence scores. The percentage of predictions and accuracy are calculated using the subset of bug reports predicted with confidence higher or equal to the cutoff. The lines of prediction and
Figure 3.6: The number of bugs triaged vs the prediction accuracy while varying the cutoff on confidence of the predictions
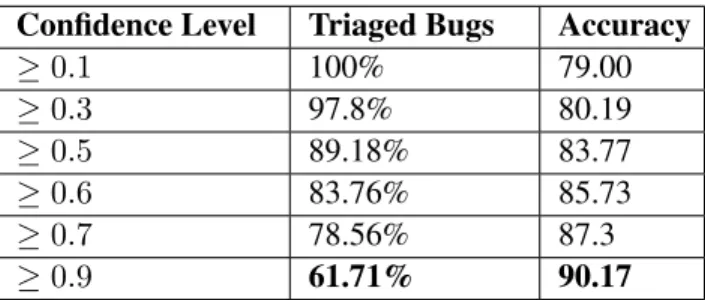
Table 3.5 and Figure 3.6 show the impact of only triaging bug reports predicted with a confi-dence between 10% to 90%. When we set the conficonfi-dence cutoff to 10%, we have an accuracy of 79.00% and triage 100% of the bug reports. When the cutoff confidence is 60%, We see that 83.76% of the reports are triaged with an accuracy of 85.73%. When we set the confidence cutoff to 90%, we have an accuracy of 90.17% but the model can only triage 61.71% of the bug reports.
Since a TopN prediction will result in manual effort, Ericsson’s preference is to automatically triage only those bug reports predicted with high confidence as that produces better accuracy.
We find that when the model is 90% confident in the result, we are able to triage bug reports with an accuracy of 90.17%. However, we only triage 61.71% of the total bug reports.
Confidence Level Triaged Bugs Accuracy ≥0.1 100% 79.00 ≥0.3 97.8% 80.19 ≥0.5 89.18% 83.77 ≥0.6 83.76% 85.73 ≥0.7 78.56% 87.3 ≥0.9 61.71% 90.17
Table 3.5: Triaging bugs with above a confidence level cutoff. With a higher cutoff, fewer bugs are triaged, but the accuracy of the prediction improves
3.3
Discussion of Threats to Validity
In this thesis, we examine bug reports of 9 large products at Ericsson. These results clearly do not generalize outside of Ericsson, however, our results are in line with previous works that examine a wide range of open source and other projects. We also examine the impact of the period used for training and the type of model.
3.3.1 Processing of Logs
Discussions with Ericsson developers and bug triagers motivated us to explore the logs and study their impact on bug triaging. We carefully study the alarm logs and crash error logs. As we only have the machine dumps attached to the bug reports, we face several challenges. If the nodes are not cleared, the machine dumps contains the logs of past few days. In that case selecting the log lines based on timestamp when the actual problem occurred is not possible as either the bug reporters convey the information over email or they add it in the description. There is no standard way to extract the erroneous log lines. Another problem we observe is that alarms sometime contain the problem and cause which are very vague by nature. Hence it does not give a specific detail about the problem. In case of eclipse bug reports, we have stack traces that we can directly use to figure out the probable packages where the error occurred. So we could mine the git commits in the packages to find out who are active developers in that package. But 8% of the Eclipse bug reports contain the stack traces. That’s why stack traces have not been useful to improve the results in our case study.
3.3.2 Training Time Period
We use weekly intervals to incrementally train and test the model. We train using all existing data prior to the current week of test data. Research noted that using old data during training can reduce accuracy [26, 60]. To address this threat, we run the best performing model M3 with the training dataset limited to two and six months respectively. At two months, we see an accuracy of 75.66%. The corresponding value for six months is 78.73%. Two months perform poorly while six months decreases the accuracy by less than 1 percentage point when compared to the entire data set. The time period used in training is easily tuned to a company’s needs.
Removing old bug reports from training data does not improve accuracy of bug triaging at Ericsson.
Model Features Time Period Accuracy
M3 Text & Categorical 2 months 75.66 M3 Text & Categorical 6 months 78.73 M3 Text & Categorical All preceding data 79.00
Table 3.6: Results with limited training data
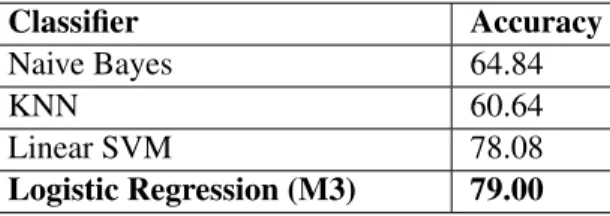
3.3.3 Alternative Classifiers
In this thesis, we find that a logistic regression is the simplest model and has the highest accuracy. We trained other classifiers: Naive Bayes, Linear SVM, and KNN. In Table 3.7, we report the accuracy for each classifier using the textual and categorical features of the bug reports. Naive Bayes and KNN perform poorly. While Linear SVM decreases the accuracy by only 1 percentage point than logistic regression, it requires substantially more time to train the models. We tuned the hyper-parameters of Linear SVM and KNN. For Linear SVM, we vary the regularization parameter
Cfrom 1.0 to 10.0 and get the best result atC =2.5. For KNN, we vary the number of neighbors
N up to 50. Future work could examine other models including neural networks and ensemble classifiers.
A logistic regression classifier outperforms more sophisticated classifiers including linear SVM. Classifier Accuracy Naive Bayes 64.84 KNN 60.64 Linear SVM 78.08 Logistic Regression (M3) 79.00
Table 3.7: Results for alternative classifiers
3.4
Ericsson Conclusions
Bugs are inevitable in any piece of software. Manually triaging bug reports and assigning them to the right developer or team is costly. Research into automating the bug triage process is extensive. In this thesis, we examine the use of automated triaging across 9 products at Ericsson. We make three contributions.
1. We reproduce the techniques commonly used by researchers in an industrial setting. Review-ing the literature, we note that many works use cross validation or relatively small data sets to evaluate their techniques (see Table 2.1, 2.2, 2.3, 2.4). Cross validation is unrealistic because future bug reports are used to assign developers to past bug reports. We use a methodologi-cally valid time split evaluation where we sequentially train and test on a large industrial data set. In our dataset, we find that older data does not reduce the accuracy, and that 6 months of data is sufficient to preform triage.
2. Our models contain the simple textual and categorical features of bug reports as well as alarms and crash dumps. The text and categorical features outperform the more complex error in-formation, with an accuracy of 79% respectively. However, in our dataset, only a small proportion of bug reports contain crash dumps and just over half contain alarms.
to 90% when we suggest the top three teams, but this still requires manual triage effort to decide among the top three. Instead, we only triage the bug reports when the model has high confidence in the prediction. Using this approach we are able to attain an accuracy of 90% on 62% of the bug reports. The manual effort is reduced by over half and high accuracy is achieved with the automatically triaged bug reports.
Chapter 4
Triaging Eclipse Bug Reports
A mantra of open source software (OSS) development is that transparency allows users and tran-sient developers to easily report bugs and sometimes fix them which improves the the quality of the software [5, 43]. As a result, OOS projects tend to have many bug reports and many bug fix-ers increasing the complexity of bug triaging. Much of the research work into triaging has been conducted on OSS data because it is publicly available. In this work, we replicate results on the Eclipse project using a recent dataset: from 2011 to 2019. We also apply the high confidence triage approach that we developed at Ericsson. This chapter is structured as follows. In Section 4.1 we describe our case study dataset and the methodology of our approach. In Section 4.2 we present the results. In Section 4.3 we describe the threats to validity. In Section 4.4 we provide Eclipse specific conclusions.
4.1
Data and Methodology
We collected the bug reports from January 2011 to March 2019. We investigate the bug reports of two Eclipse products: Eclipse JDT and Eclipse Platform. These two products have been widely used in prior research into bug triaging. There are six components for Eclipse JDT and 21 components for Eclipse platform. In this data set, there are 16,087 bug reports and 273 developers.
The data attributes we extract from the bug reports are summarized in Table 4.1. The attributes are of three types: Textual Attributes, e.g., summary and description, Categorical Attributes, i.e.,
product and component, andLog Attributese.g.,stack traces.
Type Feature Description
Text Summary A short description of the is-sue
Text Description Detailed description of the is-sue. e.g., May contain stack traces and steps to reproduce the issue etc.
Categorical Product Product that the issue was found on
Categorical Component Component of the project the bug report belongs to
Log Stack Traces Error stack traces posted by the user
Table 4.1: Bug report features used in the models
4.1.1 Feature Extraction and Models
The features in our models are textual, categorical, component level activity, commit activity, and stack trace calls.
Model M1: Logistic Regression With Textual Features
We implement L2-regularized Logistic Regression Classifier with a Liblinear solver [17] for clas-sification. The feature extraction process of the textual attributes is the same as the one used at Ericsson and is described in Section 3.1.1. We tune the regularization parameter of the classifier as described in Section 3.1.5. We also experiment with other classifiers i.e.,LinearSVM, KNN,
NaiveBayes, but find that the Logistic Regression outperforms others at least by 2 percentage points of accuracy. Previous works [7, 54] have shown that filtering out the developers that have resolved very few bugs in the dataset improves the accuracy of triaging. However, filtering can reduce the diversity of recommendations [54], so we consider a developer’s activity over time instead of their fix count. We consider developers to be active if they have fixed at least one bug in a set time period.
We vary the period at 3, 6, 9, and 12 months. We observe that the accuracy varies by less than 1 percentage point, so we report results for an activity of 6 months.
Model M2: FixerCache With Component Level Activeness Scores
In the Eclipse project, all bug reports are tagged with a particular component. As developers tend to fix bugs within their expertise, their affinity towards a component may affect the accuracy of bug triaging. Following Wanget al.[54], we assign a component level activeness score to all developers
based on the number of bug reports he or she has fixed for that component in a period.
Scorecomp(dev) =
F ixCountF ixP eriod(dev, comp)
exp((t2−t1)/30)
F ixCountF ixP eriod(dev, comp) is the number of bug reports in a particular component
re-solved by a developer inF ixP eriodtime.t1is the most recent day when the developer fixed a bug
in that component. t2is the day when the most recent bug in that component has been fixed. The
component level activeness score of a developer decreases with time if the developer does not fix bugs. Following Wanget al.[54] we set theF ixP eriodto 3, 6, 9 and 12 months.
We create the Model M2 that uses the component level activeness scores of each developer as a feature and predicts the TopN developers according to their scores.
Model M3 and M4: Textual and Component
We combine the textual features with the software component of the bug report and create logistic regressions, Model M3. The feature extraction process of texts and components is same as described in Section 3.1.1 and 3.1.2. Model M3 also considers active developers as described in Section 4.1.1. Model M4 is the same logistic regression classifier with same features as Model M3, but we build this model with all developers instead of just active developers.
Model M5: Stack trace Commit Score Model
In the Eclipse project, there is a separate git repository for every major component. Actively com-mitting code to a repository indicates developer expertise for the component. We assign each devel-oper an activeness score based on the number of commits made over a period of time.
Scorecommit(dev) =
CommitCountCP eriod(dev, repo)
exp((t2−t1)/30)
CommitCountCP eriod(dev, repo) is the number of commits done by the developer in the
repository of a particular component in CP eriod time. t1 is the most recent day when the
de-veloper pushed the last commit in that repository.t2is the day when the most recent commit in that
repository has been done. The activeness score of a developer decreases with time if the developer does not commit code to that repository anymore. We set theCP eriodto 3, 6, 9 and 12 months.
Stack Traces
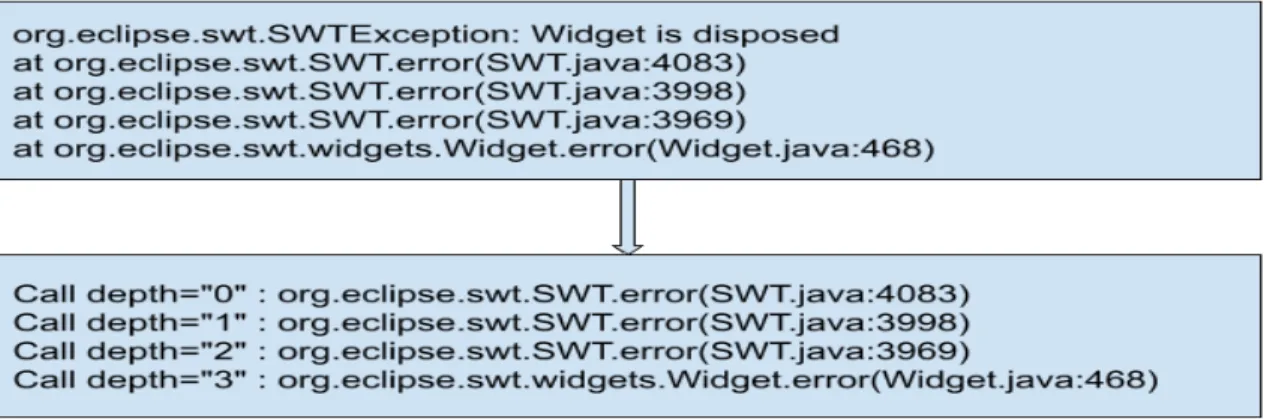
In our dataset 8% of the bug reports contain stack traces. We use the open source tool called infoZilla [11] that extracts the stack trace information along with the call depth in XML format. Using the Eclipse stack traces, Schroter et al. [44] found that 80% of the bugs are found within the top six trace lines. In this work, we follow this approach and extract the unique package names from the top six source code files appearing in the stack traces that are part of the Eclipse code-base, i.e., we do not consider external libraries. For example, in Figure 4.1, we see that the top
most line contains the source code file SWT.java which is a part of Eclipse codebase. We find that the path of this file in the repository is /eclipse.platform.swt/bundles/org.eclipse.swt/Eclipse SWT/common/org/eclipse/swt/SWT.java. The first level package that we extract is /eclipse.platform. swt/bundles. We mine the number of commits a developer made to the packages appearing in the stack trace over a period of time. We set this period to 3, 6, 9, and 12 months. We assign the commit based activeness score to the developers and make the recommendations in the same way as described in Section 4.1.1. If there is more than one package in the stack trace, we take the average of scores across all the packages.