The University of Bradford Institutional
Repository
http://bradscholars.brad.ac.uk
This work is made available online in accordance with publisher policies. Please refer to the repository record for this item and our Policy Document available from the repository home page for further information.
To see the final version of this work please visit the publisher’s website. Access to the published online version may require a subscription.
Link to publisher’s version: http://dx.doi.org/10.1097/CCM.0000000000002967
Citation: Faisal M, Scally A, Richardson D et al (2018) Development and external validation of an automated computer-aided risk score for predicting sepsis in emergency medical admissions using the patient’s first electronically recorded vital signs and blood test results. Critical Care Medicine. 46(4): 612-618.
Copyright statement: © 2018 by the Society of Critical Care Medicine and Wolters Kluwer Health, Inc. All Rights Reserved. Reproduced in accordance with the publisher's self-archiving policy.
1
Development and external validation of an automated computer
aided risk score for predicting sepsis in emergency medical
admissions using the patient’s first electronically recorded vital
signs and blood test results.
Authors
Muhammad Faisal, PhD
SeniorResearch Fellow in Medical Statistics
Faculty of Health Studies, University of Bradford, Bradford, UK Bradford Institute for Health Research
E-mail: [email protected]
Andy Scally, MSc
Medical Statistician
Faculty of Health Studies, University of Bradford, Bradford, UK Bradford Institute for Health Research
E-mail: [email protected]
Donald Richardson, FRCP Consultant Renal Physician
Department of Renal Medicine, York Teaching Hospital NHS Foundation Trust Hospital E-mail: [email protected]
Kevin Beatson, MSc
Development Manager
York Teaching Hospital NHS Foundation Trust E-mail: [email protected]
Robin Howes, MSc
Digital Research and Development Manager
Department of Strategy & Planning Northern Lincolnshire and Goole Hospitals E-mail: [email protected]
Kevin Speed, Dr
Consultant Haematologist
Northern Lincolnshire and Goole Hospitals E-mail: [email protected]
Mohammed A Mohammed, PhD
Professor of Healthcare Quality & Effectiveness
Faculty of Health Studies, University of Bradford, Bradford, UK Deputy Director of the Bradford Institute for Health Research
Academic Director to the Yorkshire & Humberside Academic Health Sciences Network E-mail: [email protected]
2
Abstract
Objective: To develop a logistic regression model to predict the risk of sepsis following emergency medical admission using the patient’s first, routinely collected, electronically recorded vital signs and blood test results; and to validate this novel computer aided risk of sepsis (CARS) model, using data from another hospital.
Design: Cross-sectional model development and external validation study reporting the c-statistic based on a validated optimised algorithm to identify sepsis and severe sepsis (including septic shock) from administrative hospital databases using ICD-10 codes.
Setting: Two acute hospitals (YH – development data; NH – external validation data).
Participants: Adult emergency medical admissions discharged over a 24-month period with vital signs and blood test results recorded on admission.
Interventions: None.
Main Results: The prevalence of sepsis and severe sepsis was lower in YH (18.5%=4861/26247, 5.3%=1387/26247) than NH (25.1%=7773/30996, 9.2%=2864/30996). The mortality for sepsis (YH:14.5%=704/4861; NH:11.6%=899/7773) was lower than the mortality for severe sepsis (YH: 29.0%=402/1387; NH:21.4%=612/2864). The c-statistic for CARS in YH (all sepsis 0.78; sepsis: 0.73; severe sepsis: 0.80) was similar in an external hospital setting (NH: all sepsis 0.79; sepsis:0.70; severe sepsis: 0.81).
Conclusions: We have developed a novel, externally validated CARS, with reasonably good performance for estimating the risk of sepsis for emergency medical admissions using the patient’s first, electronically recorded, vital signs and blood tests results. Since CARS places no additional data collection burden on clinicians and is readily automated it may now be carefully introduced and evaluated in hospitals with sufficient informatics infrastructure.
Key words: vital signs, sepsis, national early warning score, blood tests, emergency admission, external validation, risk prediction, computer aided risk score,
3
Introduction
Sepsis is a life-threatening condition which arises when the body’s response to an infection injures its own tissues and organs. (1). Internationally, sepsis is highlighted as a leading cause of avoidable mortality and morbidity incurring significant healthcare resource use (2–5). For example, in the USA, sepsis affects about 1 million patients a year accounting for 5.2% ($20 billion) of the total US hospital costs in 2011 (6). In the UK, sepsis affects about 260,000 patients annually with direct costs of £2 billion per year (7). Sepsis is known to be difficult to diagnose because the signs and symptoms of sepsis can be non-specific. Nonetheless, to reduce avoidable mortality and morbidity, patients with sepsis need to be recognised and treated as early as possible (8–10).
In this paper, we investigate the extent to which the vital signs and blood test results of acutely ill patients can be used to predict the risk of sepsis following emergency admission to hospital. Our aim is to develop an automated, Computer Aided Risk of Sepsis (CARS) model, using the patient’s first, electronically recorded, vital signs and blood tests results which are usually available within a few hours of emergency admission.
In National Health Service (NHS) hospitals in England, the patient’s vital signs are monitored and summarised into a National Early Warning Score(s) (NEWS). NEWS is derived from seven physiological variables or vital signs – respiration rate, oxygen saturations, any supplemental oxygen, temperature, systolic blood pressure, heart rate and level of consciousness (Alert, Voice, Pain, Unresponsive) – which are routinely collected by nursing staff as an integral part of the process of care. Studies have shown that electronically collected NEWSs (11) are highly reliable and accurate when compared with paper based methods (12–14).
Blood tests are an integral part of clinical medicine, and are routinely undertaken during a patient’s stay in hospital. Typically, routine blood tests consist of a core list of seven biochemical and haematological tests, (albumin, creatinine, potassium, sodium, urea, haemoglobin, white blood cell count) and, in the absence of contraindications and subject to patient consent, almost all patients admitted to hospital undergo these tests on admission. Furthermore, in the NHS, creatinine blood test results are now used to identify patients at risk of Acute Kidney Injury (AKI) (15) which is also an important cause of avoidable patient harm (16).
There exist several criteria to identify patients at risk of sepsis, such as the systemic inflammatory response syndrome (SIRS) (17), standardised early warning system (SEWS) score (18), the Sequential Organ Failure Assessment (SOFA) score (19), quick SOFA (qSOFA) (1), the predisposition, infection, response and organ dysfunction (PIRO) sepsis staging (20), Institute for Healthcare Improvement Sepsis tool (21), Surviving Sepsis Campaign guidelines 2016 (22) and the Survive Sepsis™ approach
4 (23). Whilst these approaches are primarily designed to be used at the bedside for patients in whom sepsis is suspected, our proposed approach is aimed at providing estimates of the risk of sepsis, which is automatically available for all emergency medical admissions who have routinely collected, electronically recorded, NEWS and blood test results. CARS, therefore, is not designed for use in hospitals with insufficient informatics infrastructure, nor is it targeting only those patients in whom sepsis is suspected. Rather, we are seeking to raise situational awareness of sepsis in respect of all emergency medical admissions as early as possible, without requiring any additional data items or prompts from clinicians.
Methods
Setting & data
Our cohorts of emergency medical admissions are from three acute hospitals which are approximately 100 kilometres apart in the Yorkshire & Humberside region of England– the Diana, Princess of Wales Hospital (n~400 beds) and Scunthorpe General Hospital (n~400 beds) managed by the Northern Lincolnshire and Goole NHS Foundation Trust (NLAG), and York Hospital (YH) (n~700 beds), managed by York Teaching Hospitals NHS Foundation Trust. For the purposes of this study, the two acute hospitals in NLAG are combined into a single dataset and collectively referred to as NLAG Hospitals (NH) because this reflects how the hospitals are managed. So, in essence, our study is based on data from two hospitals – NH and YH respectively, which have been exclusively using electronic NEWS scoring since at least 2013 as part of their in-house electronic patient record systems. We selected these hospitals because they had electronic NEWS which are collected as part of the patient’s process of care, and were agreeable to the study.
We considered all adult (age≥16 years) emergency medical admissions, discharged during a 24-month period (1 January 2014 to 31 December 2015), with blood test results and NEWS. For each emergency admission, we obtained a pseudonymised patient identifier, patient’s age (years), gender (male/female), discharge status (alive/dead), admission and discharge date and time, and electronic NEWS. The NEWS ranges from 0 (indicating the lowest severity of illness) to 19 (the maximum NEWS value possible is 20) (see Supplemental Digital Content for further details). The admission/discharge date and NEWS were date and time stamped and the index NEWS was defined as the first score recorded within ±24 hours of the admission time. The first blood test results were defined as the first full set of blood tests results recorded within 4 days of admission, although the majority of blood test results were available within hours of admission (see below).
We define sepsis (without organ failure) or severe sepsis (with at least one organ failure or septic shock) based on 84 selected ICD-10 codes identified by an optimised validated method reported by
5 Jolley et al in Canada (24) (which we adapted to our study by excluding six Canadian specific ICD-10 codes and three procedure codes). We used this optimised approach for identifying sepsis using ICD-10 codes because other methods are known to underestimate sepsis from administrative data (24, 25).
For model development purposes, we were unable to consider emergency admissions without blood tests results and NEWS recorded – which constituted 16.5% (6104/37100) of records in NH and 28.6% (10504/36751) of records in YH. We excluded records for the following reasons. (1) Records where the first NEWS was after 24 hours of admission and/or (2) where the first blood test was after 4 days of admission, because these “delayed” data were less likely to reflect the sickness profile of patients on admission. Nonetheless, the time from admission to first blood test results was usually several hours (h) earlier than the actual time of admission because blood tests can be ordered in the emergency department before formal admission (YH: median=-13.48h, lower quartile=-17.83h, upper quartile=-3.86h; NH: median=-2.93h, lower quartile=-4.13h, upper quartile=-1.33h). Likewise, for the time from admission to first electronically recorded NEWS (YH: median=-0.58h, lower quartile=-3.35h, upper quartile=-0.60h; NH: median=0.53h, lower quartile=-0.20h, upper quartile=1.25h).
Development of CARS
Our response variable is sepsis (yes/no) where sepsis includes sepsis (without organ failure) and severe sepsis (with at least one organ failure or septic shock). We began with exploratory analyses, including scatter plots and box plots that showed the relationship between covariates and sepsis in our hospitals. We developed a logistic regression model, known as CARS, to predict the risk of sepsis with the following covariates. Age (years), sex, NEWS (including its components), blood test results (albumin, creatinine, haemoglobin, potassium, sodium, urea, and white cell count), AKI score (0,1,2,3). We used the qladder function (STATA (26)), which displays the quantiles of transformed variable against the quantiles of a normal distribution according to the powers (𝑥3, 𝑥2, 𝑥1, 𝑥, √𝑥, log(𝑥) , 𝑥−1, 𝑥−2, 𝑥−3) for each continuous covariate, and chose the following
transformations:- (creatinine)-1/2, loge(potassium), loge(white cell count), loge(urea), loge (respiratory rate), loge(pulse rate), loge(systolic blood pressure), and loge(diastolic blood pressure). We searched
for all two-way interactions and incorporated statistically significant (p<0.0001) interactions using the stepAIC function in the MASS library (27) in R (28).
We developed the CARS model using data from YH (the development dataset) and externally validated it using data from another hospital (NH), reporting discrimination and calibration characteristics (29), after adjusting for differences in the baseline risk of sepsis (30). Discrimination relates to how well a model can separate (or discriminate) between cases with and without sepsis.
6 The concordance statistic (c-statistic) is a commonly used measure of discrimination. For a binary outcome (sepsis yes/no), the c-statistic is the area under the Receiver Operating Characteristics (ROC) curve. The ROC curve is a plot of the sensitivity, (true positive rate), versus 1-specificty, (false positive rate), for consecutive predicted risks. A c-statistic of 0.5 is no better than tossing a coin, whilst a perfect model has a c-statistic of 1. In general, values less than 0.7 are considered to show poor discrimination, values of 0.7 to 0.8 can be described as reasonable, and values above 0.8 suggest good discrimination (31). The 95% confidence interval for the c-statistic was derived using DeLong’s method as implemented in the pROC library (32) in R (28). Box plots showing the predicted risk of sepsis in those with and without sepsis is a simple way to visualise the discrimination. The difference in the mean predicted risk of sepsis in those with and without sepsis is a measure of the discrimination slope. The higher the slope the better the discrimination (33). Internal validation is assessed using discrimination (c-statistic) via bootstrapping methods implemented in the rms library (34) in R (28). Bootstrapping involves taking samples of between 100 to 200 in each run with replacement (35). Each sample can be considered as repeating the data collection with the same number of patients and under identical circumstances as the original. In each of the 500 bootstrap samples, a regression model was estimated and evaluated on the original sample to estimate statistical optimism (29, 34). Calibration relates to the agreement between observed and predicted risk of sepsis, which we assess using a scatter plot.
We report the performance of CARS for all sepsis, sepsis (without organ failure) and severe sepsis (with at least one organ failure or septic shock) in the development and external validation data sets. We also report the performance of CARS on emergency medical admissions which were excluded because of missing blood test results. We imputed missing blood test results with median blood test results based on age and sex only. We further investigated the sensitivity, specificity and positive predictive values using different model predicted thresholds for sepsis using the ROCR (36) package in R. All analyses were carried using R (28) and STATA (26).
Ethical Approval
We obtained ethical approval for the main research project of which this is a sub study from Yorkshire & The Humber - Leeds West Research Ethics Committee (reference number 15/YH/0348).
7
Results
Cohort description
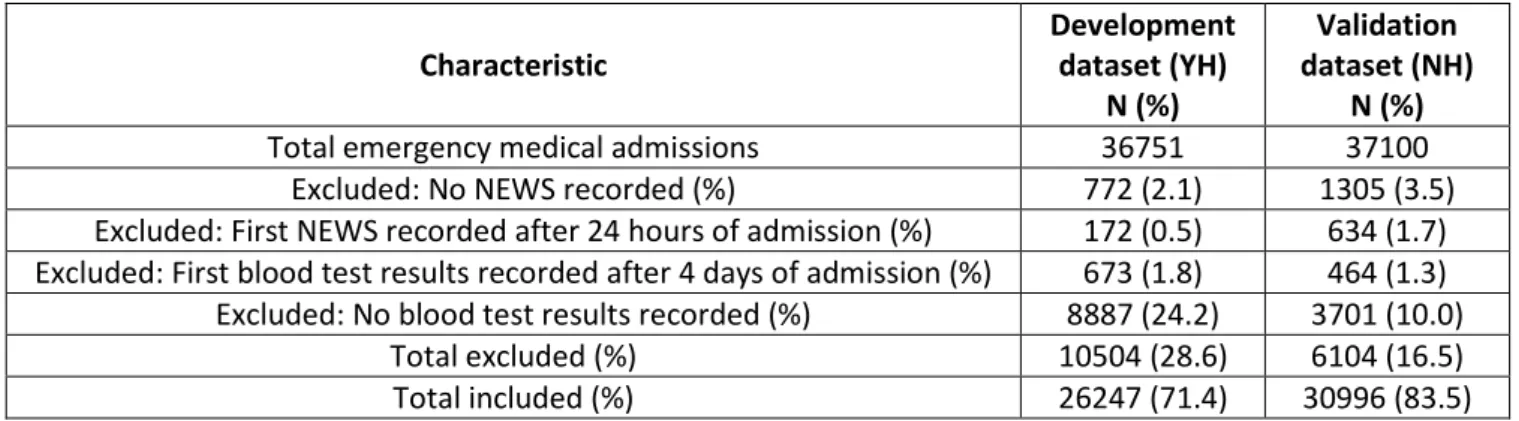
Table 1 shows the number (development dataset: n=36751 validation dataset: n=37100) of emergency medical admissions in each hospital over the 24-month period. Of these, 28.6% (10504/36751) in development dataset and 16.5% (6104/37100) validation dataset, did not have both NEWS and a full complement of blood test results and so were excluded. Further exclusions are shown in Table 1.
The age, sex, NEWS and blood test results profile are shown in Supplemental Table S1. Emergency admissions in the development dataset were slightly older, with slightly higher NEWS, higher AKI scores (AKI stage 3 is more common than stage 2 in development dataset), higher albumin blood test results, lower percentages of patients with septic shock and higher mortality than seen in the validation dataset. However, unlike the validation dataset, the development dataset is from a hospital with a renal unit. The prevalence of sepsis (Supplemental Table S1) was lower in the development dataset (all sepsis: 18.5% (4861/26247); sepsis: 13.2% (3474/26247); severe sepsis: 5.3% (1387/26247)) compared to the validation data set (all sepsis: 25.1% (7773/30996); sepsis: 15.8% (4909/30996); severe sepsis: 9.2% (2864/30996)). Hospital mortality rates (Supplemental Table S1) increased with sepsis status in the development dataset (no sepsis: 4.7% (999/21386); all sepsis 14.5% (704/4861); sepsis: 8.7% (302/3474); severe sepsis: 29.0% (402/1387)) and the validation dataset (no sepsis: 3.7% (867/23223); all sepsis 11.6% (899/7773); sepsis: 5.9% (287/4909); severe sepsis: 21.4% (612/2864)).
Figures S1 to S4 (see Supplemental Digital Content) show box plots and scatter plots for each continuous (untransformed) covariate that was included in the CARS model. The box plots (figures S1 & S2) show that in each hospital each covariate, to a lesser or greater extent, appears to change with sepsis status. The scatter plots in figures S3 & S4 show that there is a similar relationship between a given continuous covariate and the risk of sepsis in the development and validation datasets.
Statistical Modelling of CARS
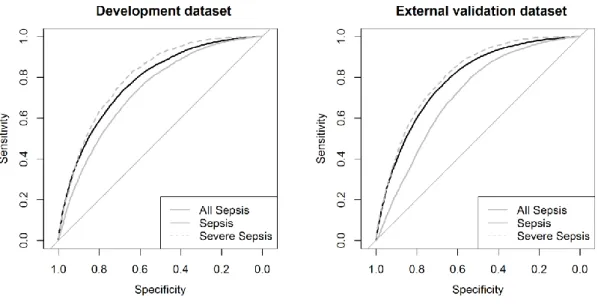
We developed CARS to predict the risk of sepsis which includes sepsis (without organ failure) and severe sepsis (with at least one organ failure or septic shock). The CARS equation, discrimination box plots, and external validation plots are shown in the Supplemental Digital Content. Table 2 shows the performance of CARS in the development and validation datasets and figure 1 shows the
8 accompanying ROC plots. The c-statistic for CARS (all sepsis: 0.78; sepsis: 0.73; severe sepsis: 0.80) was similar in an external hospital setting (all sepsis: 0.79; sepsis: 0.70; severe sepsis: 0.81).
We excluded 24.2% (YH) and 10.0% (NH) of emergency admissions from the development and external validation datasets respectively, because of missing blood tests results (see Supplemental Table S2). We examined the performance of CARS in these excluded cases by first imputing age- and sex-specific median blood test results and then applying the CARS model to these admissions only. The last column in Table 2 shows the subsequent c-statistics in these imputed cases only and figure S8 (Supplemental Digital Content), shows the corresponding ROC plots. The c-statistics for these imputed records were not markedly different in the development and validation datasets.
Table 3 shows the sensitivity, specificity and positive predictive value for a selected range of cut-off values of the predicted risk of sepsis, which tentatively suggests that a threshold risk of 0.20 provides reasonable sensitivity (development data set: 67.76%, external validation data set: 83.24%) and specificity (development data set: 68.00%, external validation data set: 53.06%). See Table 3 and figure S7 (Supplemental Digital Content).
Discussion
We have shown that it is feasible to use the first electronically recorded vital signs and blood test results of an emergency medical patient to predict the risk of sepsis following emergency admission. We developed our CARS model for sepsis in one hospital and externally validated in data from another hospital. We found that CARS has reasonably good performance for predicting sepsis and our findings tentatively suggest that a cut-off of 20% predicted risk of sepsis appears to strike a reasonable balance between sensitivity and specificity.
There are a number of reported risk prediction models for sepsis (see introduction) (37). Whilst some of the models use vital signs data and others use blood test results (38, 39), few have combined both in the manner used in CARS. Nonetheless it is important to note that CARS is not intended to replace existing scoring systems because most of the existing approaches are designed for bedside use in patients in whom sepsis is already suspected, whereas CARS is designed to provide an automated estimate of the risk of sepsis in emergency medical admissions as soon as their vital signs and blood test results become available – usually within a few hours of admission. This is an attractive feature of CARS given the importance of early recognition and treatment for sepsis (8–10).
There are a number of limitations in our study which merit further study. Although we identified sepsis based on a validated optimised algorithm using ICD-10 codes (24), the extent to which
9 differences between this approach to identifying sepsis and consensus clinical definitions of sepsis (1) undermine the evaluation of CARS remains unclear (38, 39). We found that up to about ¼ of emergency medical admissions had no recorded blood test results for whom we tested a simple median imputation strategy without knowing why such data was missing. We found that the performance of CARS did not materially deteriorate in these admissions. We do not suggest that our imputation method is an optimal imputation strategy. Rather we offer it as a simple, pragmatic, preliminary imputation strategy, which is akin to the AKI detection algorithm which also imputes the median creatinine value where required (40). We did not undertake an imputation exercise for patients with no recorded NEWS because they constituted a much smaller proportion of missing data (<5%) and NEWS is not recommended in patients requiring immediate resuscitation, direct admission to intensive care, and patients with end-stage renal failure or with acute intracranial conditions (41).
We have designed CARS to be used in hospitals with sufficient informatics infrastructure (eg electronic health records) (42, 43). We have shown that CARS has potential but we have yet to test its use in routine clinical practice. This is important because we need to demonstrate that CARS does more “good” than “harm” in practice. So, the next phase of this work is to field test CARS by carefully engineering it into routine clinical practice (42, 43) to see if it does support earlier detection and treatment of sepsis in emergency medical patients.
Conclusions
We have developed a novel, externally validated CARS, with reasonably good performance for estimating the risk of sepsis for emergency medical admissions using the patient’s first, electronically recorded, vital signs and blood tests results. Since CARS places no additional data collection burden on clinicians and is readily automated, it may now be carefully introduced and evaluated in hospitals with electronic health records.
Acknowledgements
The authors would like to express their gratitude to Sue Rushbrook and Gary Hardcastle at York Hospital for their support in obtaining the data.
Contributorship
DR & MAM had the original idea for this work. MF, AS & MAM undertook the statistical analyses. RH and KB extracted the necessary data frames. DR gave a clinical perspective. MAM and MF wrote the first draft of this paper and all authors subsequently assisted in redrafting and have approved the final version. MAM will act as guarantor.
10
Competing Interests
The authors declare no conflicts of interest.
Funding
This study is funded by the Health Foundation. The Health Foundation is an independent charity working to improve the quality of health care in the UK.
References
1. Singer M, Deutschman CS, Seymour CW, et al.: The Third International Consensus Definitions for Sepsis and Septic Shock (Sepsis-3). JAMA 2016; 315:801
2. The World Sepsis Declaration
http://www.world-sepsis-day.org/CONTENTPIC/2015_WSD_Declaration_English.pdf. Jena, Germany:
3. Parliamentary and Health Service Ombudsman. Time to Act. Severe sepsis: rapid diagnosis and treatment saves lives. 2013.
4. National Confidential Enquiry into Patient Outcome and Death. Just Say Sepsis! A review of the process of care received by patients with sepsis. 2015.
5. National Institute for Health and Care Excellence. NICE Guideline 51. Sepsis: recognition, assessment and early management. July 2016.
6. Torio CM, Andrews RM: National Inpatient Hospital Costs: The Most Expensive Conditions by Payer, 2011: Statistical Brief #160. 2013.
7. York Health Economics Consortium: The Cost of Sepsis Care in the UK.
http://allcatsrgrey.org.uk/wp/download/health_economics/YHEC-Sepsis-Report-17.02.17-FINAL.pdf. 2017.
8. Rivers EP, Coba V, Whitmill M: Early goal-directed therapy in severe sepsis and septic shock: a contemporary review of the literature. Curr Opin Anaesthesiol 2008; 21:128–140
9. Sepsis - NHS Choices http://www.nhs.uk/conditions/blood-poisoning/pages/introduction.aspx.
10. Slade E, Tamber PS, Vincent J-L: The Surviving Sepsis Campaign: raising awareness to reduce mortality. Crit Care 2003; 7:1
11. Smith GB, Prytherch DR, Schmidt P, et al.: Hospital-wide physiological surveillance-a new approach to the early identification and management of the sick patient. Resuscitation 2006; 71:19–28
12. Edwards M, McKay H, Van Leuvan C, et al.: Modified Early Warning Scores: inaccurate summation or inaccurate assignment of score? Crit Care 2010; 14:P257
13. Prytherch DR, Smith GB, Schmidt P, et al.: Calculating early warning scores--a classroom comparison of pen and paper and hand-held computer methods. Resuscitation 2006; 70:173– 8
11 14. Mohammed M, Hayton R, Clements G, et al.: Improving accuracy and efficiency of early
warning scores in acute care. Br J Nurs 18:18–24
15. NHS England: Acute Kidney Injury (AKI) Programme. http://www.thinkkidneys.nhs.uk, 2014. http://www.england.nhs.uk/ourwork/patientsafety/akiprogramme/.
16. NCEPOD: Acute Kidney Injury: Adding Insult to Injury. National Confidential Enquiry into Patient Outcome and Death, 2009.
17. Levy MM, Fink MP, Marshall JC, et al.: 2001 SCCM/ESICM/ACCP/ATS/SIS International Sepsis Definitions Conference. Intensive Care Med 2003; 29:530–538
18. Paterson R, MacLeod DC, Thetford D, et al.: Prediction of in-hospital mortality and length of stay using an early warning scoring system: clinical audit. Clin Med 6:281–4
19. Vincent JL, Moreno R, Takala J, et al.: The SOFA (Sepsis-related Organ Failure Assessment) score to describe organ dysfunction/failure. On behalf of the Working Group on Sepsis-Related Problems of the European Society of Intensive Care Medicine. Intensive Care Med
1996; 22:707–10
20. Rathour S, Kumar S, Hadda V, et al.: PIRO concept: staging of sepsis. J Postgrad Med 61:235– 42
21. Institute for Healthcare Improvement Sepsis Definitions.
http://www.ihi.org/IHI/%0ATopics/CriticalCare/Sepsis/Tools/SepsisDefinitions.htm. 22. Rhodes A, Evans LE, Alhazzani W, et al.: Surviving Sepsis Campaign: International Guidelines
for Management of Sepsis and Septic Shock: 2016. Intensive Care Med 2017; 43:304–377 23. Survive Sepsis UK. http://www.survivesepsis.org/.
24. Jolley RJ, Quan H, Jetté N, et al.: Validation and optimisation of an ICD-10-coded case definition for sepsis using administrative health data. BMJ Open 2015; 5:e009487
25. Jolley RJ, Sawka KJ, Yergens DW, et al.: Validity of administrative data in recording sepsis: a systematic review. Crit Care 2015; 19:139
26. StatCorp. Stata: Release 13. Statistical Software. College Station, TX: StataCorp LP; 2014. 27. Venables W, Ripley B: Modern Applied Statistics with S. Fourth Edi. New York: Springer; 2002. 28. R Development Core Team: R: A language and environment for statistical computing. R
Foundation for Statistical Computing http://www.r-project.org/. 2015;
29. Steyerberg EW: Clinical Prediction Models. A practical approach to development, validation and updating. Springer; 2008.
30. Faisal M, Howes R, Steyerberg EW, et al.: Using routine blood test results to predict the risk of death for emergency medical admissions to hospital: an external model validation study. QJM
2017; 110:27–31
31. Hanley JA, McNeil BJ: The meaning and use of the area under a receiver operating characteristic (ROC) curve. Radiology 1982; 143:29–36
12 32. Robin X, Turck N, Hainard A, et al.: pROC: an open-source package for R and S+ to analyze and
compare ROC curves. BMC Bioinformatics 2011; 12:77
33. Mohammed MA, Deeks JJ, Girling A, et al.: Evidence of methodological bias in hospital standardised mortality ratios: retrospective database study of English hospitals. BMJ 2009; 338
34. Harrell FE: rms: Regression Modeling Strategies http://cran.r-project.org/package=rms. 2015; 35. Harrell FE: Regression Modeling Strategies : With Applications to Linear Models, Logistic
Regression, and Survival Analysis. Springer New York; 2001.
36. Sing T, Sander O, Beerenwinkel N, et al.: ROCR: visualizing classifier performance in R.
Bioinformatics 2005; 21:3940–3941
37. Marwick CA, Guthrie B, Pringle JE, et al.: Identifying which septic patients have increased mortality risk using severity scores: a cohort study. BMC Anesthesiol 2014; 14:1–9 38. Corfield AR, Lees F, Zealley I, et al.: Utility of a single early warning score in patients with
sepsis in the emergency department. 2012;
39. Churpek MM, Snyder A, Han X, et al.: Quick Sepsis-related Organ Failure Assessment, Systemic Inflammatory Response Syndrome, and Early Warning Scores for Detecting Clinical Deterioration in Infected Patients outside the Intensive Care Unit. Am J Respir Crit Care Med
2017; 195:906–911
40. Algorithm for detecting Acute Kidney Injury (AKI) based on serum creatinine changes with time https://www.england.nhs.uk/wp-content/uploads/2014/06/psa-aki-alg.pdf. 2014; 41. Silcock DJ, Corfield AR, Gowens PA, et al.: Validation of the National Early Warning Score in
the prehospital setting. Resuscitation 2015; 89:31–35
42. Escobar GJ, Dellinger RP: Early detection, prevention, and mitigation of critical illness outside intensive care settings. J Hosp Med 2016; 11:S5–S10
43. Escobar GJ, Turk BJ, Ragins A, et al.: Piloting electronic medical record-based early detection of inpatient deterioration in community hospitals. J Hosp Med 2016; 11:S18–S24
13 Characteristic Development dataset (YH) N (%) Validation dataset (NH) N (%)
Total emergency medical admissions 36751 37100 Excluded: No NEWS recorded (%) 772 (2.1) 1305 (3.5) Excluded: First NEWS recorded after 24 hours of admission (%) 172 (0.5) 634 (1.7) Excluded: First blood test results recorded after 4 days of admission (%) 673 (1.8) 464 (1.3) Excluded: No blood test results recorded (%) 8887 (24.2) 3701 (10.0)
Total excluded (%) 10504 (28.6) 6104 (16.5) Total included (%) 26247 (71.4) 30996 (83.5)
Table 1 Number of emergency medical admissions included/excluded in development dataset and the external validation dataset (%)
Table 2 Performance of the CARS model in predicting the risk of sepsis in each category of sepsis in the development dataset and external validation dataset.
Dataset Sepsis type
Mean predicted risk: no sepsis Mean predicted risk: sepsis Discrimination AUC [95% CI] Median Imputed data only: AUC [95%CI] Development dataset N=26247 All Sepsis (n=4861, 18.52%) 0.155 0.317 0.162 0.779 [0.772 to 0.786] 0.800 [0.785 to 0.816] Sepsis (n=3474, 13.24%) 0.168 0.298 0.130 0.734 [0.726 to 0.743] 0.780 [0.762 to 0.797] Severe Sepsis (n=1387, 5.28%) 0.175 0.366 0.191 0.804 [0.794 to 0.814] 0.846 [0.818 to 0.874] Validation dataset N=30996 All Sepsis (n=7773, 25.08%) 0.204 0.390 0.186 0.788 [0.782 to 0.793] 0.778 [0.752 to 0.803] Sepsis (n=4909, 15.84%) 0.231 0.356 0.126 0.704 [0.711 to 0.718] 0.743 [0.714 to 0.772] Severe Sepsis (n=2864, 9.24%) 0.230 0.447 0.217 0.809 [0.802 to 0.816] 0.880 [0.844 to 0.917]
14
Sepsis type Cut-off Development dataset Validation dataset
%Prev. %Sens. %Spec. %PPV %Prev. %Sens. %Spec. %PPV
All Sepsis 0.05 18.52 97.74 20.63 21.87 25.08 99.06 11.29 27.21 0.10 90.15 44.24 26.87 95.84 31.24 31.81 0.20 67.76 73.15 36.45 83.24 59.85 40.97 0.40 30.12 93.68 52.01 44.83 87.68 54.93 Sepsis 0.05 13.24 97.12 19.42 15.53 15.84 98.57 10.06 17.10 0.10 88.08 41.83 18.77 94.11 27.94 19.73 0.20 63.70 70.03 24.49 79.08 54.34 24.58 0.40 26.66 91.71 32.90 37.10 82.66 28.70 Severe Sepsis 0.05 5.28 99.28 18.15 6.34 9.24 99.90 9.57 10.11 0.10 95.31 39.73 8.11 98.81 26.82 12.08 0.20 77.94 68.00 11.96 90.36 53.06 16.39 0.40 38.79 90.84 19.11 58.10 83.36 26.23
Table 3 Sensitivity analysis of CARS model to predict the risk of sepsis at various risk thresholds (0.05, 0.10, 0.20, and 0.40) in the development and external validation datasets.
Prev = Prevalence. Sens=Sensitivity. Spec=Specificity. PPV=Positive Predictive Value
Figure 1 Receiver Operating Characteristic curve for the CARS model for different types of sepsis in the development dataset and external validation dataset.