3
Universitat Politècnica de Catalunya
Optical Communications Group
Inter-Datacenter Connectivity in
Flexgrid-based Optical Networks
Adrián Asensio Garcia
A thesis presented in partial fulfillment of the
requirements for the degree of
Master of Science
Advisor:
Dr. Luis Velasco Esteban
Co-advisor:
Dr. Jaume Comellas Colomé
3
Agraïments
En primer lloc vull agrair la dedicació i la impecable direcció d'en Luis Velasco, així com l’inestimable suport d’en Jaume Comellas. Gràcies a la seva supervisió com a directors i tutors durant aquests mesos, aquest projecte s'ha pogut dur a terme. També voldria destacar el suport rebut per part de la resta de membres, tant professors com estudiants, del Grup de Comunicacions Òptiques de la UPC, així com de tots aquells companys que en una o altra mesura han contribuït a superar diferents obstacles durant aquest temps.
A la família i amics, especialment a la Leila i l’Eric, vull agrair-los el recolzament que m'han donat en tot moment.
3
Abstract
The huge energy consumption of datacenters (DC) requires an elastic resource management, e.g. by turning servers off when they are not used or turning them on to satisfy increments in the demand. Thanks to virtualization, jobs (e.g., web applications) can be encapsulated in virtual machines (VM) mixed with other workloads and consolidate them in the most proper server according to their performance goals. Local resource managers in DCs can migrate VMs from one server to another looking for reducing energy consumption while ensuring the committed quality of experience (QoE).
Additionally, cloud providers can create DC federations based on a geographically distributed infrastructure so they can manage appropriately green energy resources available in each DC, thus reducing energy expenditure. Scheduling algorithms can perform VM migration not only within a single DC but also transferring a huge amount of raw data from one DC to another to minimize operational costs while ensuring the QoE.
Since traffic between DCs is generated by VM migration, the connectivity required between two DCs highly varies along the day, presenting dramatic differences in an hourly time scale. Therefore, using a flexgrid-based optical network to interconnect DCs is an option to be considered since that technology provides fine and multiple granularity. In flexgrid optical networks the available optical spectrum is divided into frequency slices of fixed spectrum width. Optical connections can be allocated into a variable number of these slices, and its capacity can be dynamically managed by allocating or releasing slices provided that the spectrum allocated to an optical connection remain contiguous.
Network providers can facilitate the interconnection among federated DCs by allowing them to request connections’ set up on demand with the desired bitrate, while tearing down those connections when they are not needed. With this aim, in the last years, huge standardization work has been done defining control plane architectures and protocols to automate connection provisioning. The Internet Engineering Task Force (IETF) is defining the Application-Based Network Operations (ABNO) architecture, which is based on standard components such as the active stateful Path Computation Element (PCE).
This thesis is devoted to characterize, evaluate and analyze the problem providing optimal VM placement so as to minimize operational costs assuming that those costs are dominated by energy and communication costs. To this aim, analytical models to optimize energy consumption in DC federations are provided. Both cloud and core optical network control architectures are explored and new connectivity models for elastic operations are proposed. Mixed integer linear programming models as well as heuristic algorithms are developed and simulations are carried out. More specifically, the main objective has been attained by developing three goals covering different open issues.
First we propose the Elastic Operations in Federated Datacenters for Performance and Cost Optimization (ELFADO) problem for scheduling workload and orchestrating federated DCs. A distributed and a centralized approach are studied. Second we propose architectures based on ABNO, using cross-stratum orchestration and carrier SDN, as well as elastic connectivity models supported: the dynamic elastic model and a transfer mode model respectively.
Finally, we consider the centralized ELFADO and both the dynamic elastic and transfer mode connectivity models proposed and evaluate their performance.
3
Table of contents
List of Figures ... XI
List of Tables ... XIII
Chapter 1
Introduction ... 1
1.1 Motivation ... 1
1.2 Thesis objectives ... 2
1.3 Thesis outline ... 3
Chapter 2
Background and state of the art ... 5
2.1 Elastic optical networks ... 5
2.1.1 Flexgrid-based elastic optical networks ... 6
2.1.2 Control plane ... 6
2.2 Cloud computing ... 8
2.2.1 Virtualization ... 8
2.2.2 Datacenter architecture ... 8
2.2.3 Datacenter power model... 9
2.3 Cloud-ready transport network... 10
2.4 Energy expenditures minimization ... 11
2.5 Conclusions ... 12
Chapter 3
Cloud computing and networking ... 13
3.1 Orchestrating federated datacenters ... 13
3.1.1 Minimizing energy expenditures ... 14
3.2 The ELFADO problem ... 17
3.2.1 Problem statement ... 17
3.2.2 Mathematical formulations... 17
3.2.3 Heuristic algorithms ... 21
3.3.1 Scenario ... 24
3.3.2 Illustrative results ... 26
3.4 Conclusions ... 29
Chapter 4
Inter-datacenter networks ... 31
4.1 Dynamic connection requests ... 31
4.1.1 Performance evaluation ... 34
4.2 Transfer mode requests ... 39
4.2.1 Performance evaluation ... 42
4.3 Conclusions ... 44
Chapter 5
Performance evaluation using elastic
connectivity ... 47
5.1 Federation orchestrator and elastic connectivity ... 47
5.2 Performance evaluation ... 50
5.3 Conclusions ... 53
Chapter 6
Closing discussion ... 55
6.1 Main contributions ... 55
6.2 Publications ... 56
6.2.1 Journals and magazines ... 56
6.2.2 Conferences and workshops ... 57
6.3 Future work ... 57
List of Acronyms ... 59
3
List of Figures
Fig. 2-1. Control and data plane scheme. ... 7
Fig. 2-2. Application-based network operations architecture. ... 7
Fig. 2-3. Example of fat-tree datacenter architecture (M=4). ... 9
Fig. 2-4. Architecture to support cloud-ready transport networks. ... 11
Fig. 3-1. Distributed federated datacenters orchestration. ... 14
Fig. 3-2. Centralized federated datacenters orchestration. ... 15
Fig. 3-3. Unit cost of brown energy and normalized availability of green energy against the time of day. ... 16
Fig. 3-4. Scenario: federated datacenters, locations and inter-datacenter network. ... 25
Fig. 3-5. Availability of green energy vs. time in all datacenters (left). Percentage of VMs in each datacenter when the distributed (center) and the centralized (right) approaches are applied. ... 26
Fig. 3-6. Energy (left) and communication (center) cost per hour against time. Latency vs. time (right). ... 27
Fig. 3-7. Cost per day vs. performance threshold (a) and against cost per bit (b). .. 28
Fig. 4-1. Cross-stratum orchestration architecture. ... 32
Fig. 4-2. Dynamic and dynamic elastic connectivity models. ... 34
Fig. 4-3. Bitrate vs. time-to-transfer (a) and time-to-transfer vs. day-hours (b) for static connectivity. ... 36
Fig. 4-4. Used bitrate vs. time for static connectivity... 36
Fig. 4-5. Used bitrate vs. time in low U2DC traffic scenario. ... 37
Fig. 4-6. Used bitrate vs. time in high U2DC traffic scenario. ... 38
Fig. 4-8. Control architectures supporting dynamic connections (a) and transfer
mode (b) requests. ... 40
Fig. 4-9. Network-driven transfer mode requests. ... 41
Fig. 4-10. Worldwide topology. ... 42
Fig. 4-11. Required bitrate vs. time. ... 43
Fig. 4-12. Used bitrate for the dynamic elastic (a) and network-driven (b) models. 43 Fig. 5-1. Architecture for dynamic elastic connection requests. ... 48
Fig. 5-2. Architecture for transfer mode requests. ... 48
Fig. 5-3. Daily energy cost (left) and communication cost (right). ... 51
Fig. 5-4. Percentage of VMs not moved as first scheduled (left), number of connection requests (center), and latency experienced by users (right). ... 51
3
List of Tables
Table 3-1. Size of the ELFADO problem. ... 21
Table 3-2. Heuristic for the distributed ELFADO. ... 22
Table 3-3. Heuristic for the centralized ELFADO. ... 23
Table 3-4. Value of energy parameters. ... 25
Table 3-5. Characteristics of Huawei CloudEngine switches... 25
Table 3-6. Comparison of daily costs and performance. ... 27
Table 4-1. Connectivity models comparison. ... 39
Table 4-2. Elastic operations per period.. ... 39
Table 4-3. Time-to-transfer. ... 44
Table 4-4. Elastic operations. ... 44
3
Chapter 1
Introduction
1.1
Motivation
Cloud computing has transformed the information technology (IT) industry, shaping the way IT hardware is designed and purchased [Ar10]. Datacenters (DCs) contain hardware and software to provide services over the Internet. Because DCs consume huge amounts of energy [US07], energy expenditure becomes a prominent part of the total operational expenditures for their operators. Aiming at reducing energy expenditures, DC operators can use, or even generate themselves, green
energy coming from solar or wind sources; green energy would replace either partially or totally energy coming from brown, polluting, sources. Notwithstanding, one of the principal drawbacks is that green energy is not always available, depending on the hour of the day, weather and season, among others. In contrast, brown energy can be drawn from the grid at any time, although its cost might vary along the day.
Large Internet companies, such as Google, have their own IT infrastructures consisting in a number of large DCs placed in geographically dispersed locations to guarantee the appropriate quality of experience (QoE) to users; DCs are interconnected through a wide area network [XZh13]. Using infrastructure, workloads can be moved among DCs to take advantage of reduced energy cost during off-peak energy periods in some locations while using green energy when it is available in some other locations. Physical machines, i.e. servers, are turned off when they are not used, thus minimizing their energy expenditure. Nonetheless, smaller independently operated infrastructures cannot perform such elastic operations; notwithstanding, they can cooperate by creating DC federations [Go10.1] to increase their revenue from using IT resources that would otherwise be underutilized, and to expand their geographic coverage without building new DCs.
Within a single DC, virtual machines (VM) migration for consolidation and load balancing purposes are commonly automated using scheduled-based algorithms running in the local resource manager. These algorithms target at optimizing some utility function, ensuring quality of experience and service availability [Mi12], [Go10.2]; its outcome is the set of VMs to be activated, stopped or migrated in the local DC. When a DC federation is created, scheduling algorithms need to consider not only local workload and resources but also those in the rest of federated DCs and compute VM migration towards remote DCs, as well as within the local DC. It is worth highlighting that, in a recent global cloud index study [CISCO], Cisco forecasts DC traffic to quadruple over the next years, reaching 554 EB per month by 2016. Two main components of traffic leaving DCs can be distinguished: traffic among DCs (DC2DC) and traffic between DCs and end users (U2DC). The former includes VM migration to manage the cloud elastically, whilst the latter is associated to applications, such as web, e-mail, etc.
Since elastic operations for VM migration require huge bitrate to be available among DCs for some time periods, the inter-DC network can be based on the optical technology and must provide automated interfaces to set up and tear down optical connections with the required bitrate. Thus, network providers can facilitate federated DCs interconnection by allowing them to request connections’ set up on demand with the desired bitrate, while tearing down those connections when they are not needed. In the last years, huge standardization work has been done defining control plane architectures and protocols to automate connection provisioning. The Internet Engineering Task Force (IETF) is defining the application-based network operations (ABNO) architecture [Ki13], which is based on standard components such as the active stateful path computation element (PCE) [Cr13].
1.2
Thesis objectives
The main objective of this thesis is the creation of analytical models to optimize energy consumption in DC federations considering not only the inherent energy costs in DCs but also the communication costs when performing VM migration among the corresponding federated DCs. To this aim, both cloud and core optical network control architectures are explored, new connectivity models for elastic operations are proposed and compared with current fixed, static or dynamic, connectivity models. Mixed integer linear programming models as well as heuristic algorithms are developed. In addition simulations are carried out and results analyzed.
Chapter 1 - Introduction 3
1.3
Thesis outline
The rest of this thesis is organized as follows. Chapter 2 introduces basic concepts and terminology that are relevant to the work presented in this thesis. The state of the art is reviewed and conclusions close the chapter.
Chapter 3 is based on our work in [Ve14.2]. We tackle the Elastic Operations in Federated Datacenters for Performance and Cost Optimization (ELFADO) problem. Two approaches for solving it are described: distributed and centralized. Then, the problem is formally stated and mathematical models and heuristic algorithms to solve it for both approaches are presented. Illustrative results are provided. Conclusions close the chapter.
Chapter 4 is based on our works presented in [Ve13] and [Ve14.1]. We describe the current static inter-DC connectivity and propose architectures considering cross-stratum orchestration and ABNO controller in charge of the interconnection network. Two connectivity models (dynamic and dynamic elastic) in a cloud-ready transport network so as to provide bandwidth on demand are then detailed. Illustrative results are provided to compare static, dynamic and dynamic elastic connectivity models. Then, we propose carrier software defined network (SDN) and a network-driven transfer mode for cloud operations. Illustrative results are shown. At the end of the chapter, conlusions are provided.
Chapter 5, based on our study presented in [As14], extends the scenario described in Chapter 3 adding the elastic connectivity models proposed in Chapter 4. It describes the proposed architecture for the federated DC interfacing a carrier SDN controller, which, in turn, interfaces an ABNO controller in charge of the interconnection network. Illustrative results are provided to compare elastic connectivity models.
Finally, Chapter 6 concludes the thesis, summarizes author’s publications and points out future research work.
3
Chapter 2
Background and state of the art
This chapter introduces basic concepts and terminology that are relevant to the work presented in this thesis. We start introducing elastic optical networks (EON), the flexgrid technology and current control plane architectures. Then we review concepts related to cloud computing such as virtualization, general DC architecture and its power model.
Additionally, to provide a view on the state of the art, we review current approaches for a cloud-ready transport network for inter-DC connections and energy expenditure minimization in DCs. Conclusions that justify this thesis close the chapter.
2.1
Elastic optical networks
On the contrary to wavelength division multiplexing (WDM) fixed grid networks, in which the width of optical channels is fixed and equal, in EON the channel allocated to a lightpath may be expanded or reduced when the required bitrate of a demand increases or decreases.
In this context, adaptive spectrum allocation with known a priori 24-hour traffic patterns has been addressed in [Ve12], [Kl13], [Sh11] and spectrum adaptation under dynamic traffic demands studied in [Ch11], [Ch13]. Concurrently, different policies for elastic spectrum allocation were proposed, including symmetric [Ve12], [Kl13], [Sh11] and asymmetric [Ve12], [Kl13], [Ch13] spectrum expansion or reduction around a reference frequency as well as entire spectrum re-allocation policy [Ve12], [Kl13].
2.1.1
Flexgrid-based elastic optical networks
The advent of the flexible spectrum grid (flexgrid) technology [Ge12], [Ji09] brings new opportunities to next-generation transport networks since it allows elastic, adaptive, highly-scalable, and on demand bandwidth provisioning in optical networks. Additionally, key technologies that are paving the way to devise novel EON architectures are: 1) the availability of flexgrid ready bandwidth-variable wavelength selective switches (BV-WSS) to build bandwidth-variable optical cross-connects (BV-OXC), 2) the development of advanced modulation formats and techniques, both single-carrier (such as k-PSK, k-QAM) and multi-carrier (such as O-OFDM), to increase efficiency and being capable of extending the reach of optical signals avoiding expensive electronic regeneration (3R); 3) multi-flow transponders (also known as sliceable bandwidth-variable transponders, SBVTs) that are able to deal with several flows in parallel, thus adding even more flexibility and reducing costs [Ji12]. For more details on EON architectures and proof-of-concept EON experiments we refer to [Ji09], [Ge11] and [Cu12].
2.1.2
Control plane
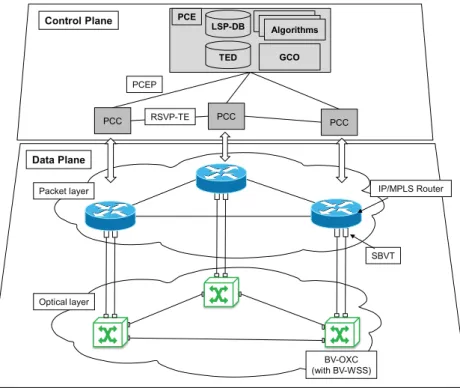
Core network control plane architectures based on a PCE are commonly used to control data planes based on optical networks. A set of path computation clients (PCC) send requests to the PCE, on top of the control plane. The PCE implements the corresponding label switched path database (LSP-DB), traffic-engineering database (TED) and routing algorithms. It is woth mentioning a particular case of PCE: the active stateful PCE [Cr13]. That PCE includes algorithms to compute the route and spectrum allocation (RSA) of incoming connection requests or to perform elastic operations on currently established connections.
Additionally, a global concurrent optimization (GCO) module [Le09] providing functionalities for obtaining better network-wide solutions by computing paths for a set of queries grouped together may be implemented in the control plane.
Fig. 2-1 illustrates a generic control plane based on PCE controlling an IP/MPLS network and an EON. For illustrative purposes, control plane relevant protocol messages are represented: the path computation element protocol (PCEP) [Va09] and the resource reservation protocol – traffic engineering (RSVP-TE) [Aw01].
Chapter 2 - Background and state of the art 7 BV-OXC (with BV-WSS) SBVT Optical layer IP/MPLS Router GCO Data Plane Packet layer LSP-DB PCC PCC PCC PCE Algorithms AlgorithmsAlgorithms PCEP RSVP-TE Control Plane TED
Fig. 2-1. Control and data plane scheme.
Among control plane technologies, the IETF is currently standardizing a centralized architecture named application-based network operations, ABNO, [Ki13]. ABNO is defined as an entity in charge of controlling the network in response to requests from, among others, the application layer. The ABNO architecture consists of a number of functional elements, such as an ABNO controller receiving requests; a policy agent, which enforces the set of policies received from a network management system; an active stateful PCE to perform path computation; a provisioning manager in charge of implementing connections in the network elements; and an operations, administration, and management (OAM) handler that receives notifications. Fig. 2-2 illustrates the ABNO architecture and the elements described above.
Flexgrid-based network Active Stateful PCE ABNO Controller Policy Agent TED LSP-DB Prov. Mngr OAM Handler
2.2
Cloud computing
In the Internet of services, IT infrastructure providers play a critical role in making the services accessible to end customers. IT infrastructure providers host platforms and services in their DCs. The cloud initiative has been accompanied by the introduction of new computing paradigms, such as infrastructure as a service (IaaS) and software as a service (SaaS), which have dramatically reduced the time and costs required to develop and deploy a service [Ar10]. These paradigms are playing a role of paramount importance in the way companies invest their money regarding IT resources: they are moving from a model where large amounts of capital expenditure (CAPEX) are needed to build their own IT infrastructure and additional cost to maintain it (operational expenditures, OPEX) to a pure OPEX model where IT resources are requested of cloud providers in a pay-as-you-go model.
2.2.1
Virtualization
Dimensioning DCs is a challenging task since workload mixes and intensities are extremely dynamic; dimensioning DCs for peak load can be extremely inefficient, whereas reducing its capacity might result in poor quality of service (QoS), causing service level agreement (SLA) breaches. In addition, the huge energy consumption of DCs requires elastic resource management; for example, turning off physical machines (PM) when they are not used or turning them on to satisfy increments in demand.
Thanks to virtualization, mixed workloads (e.g., web applications and high-performance computing jobs) can easily be consolidated and high-performance isolated, their consumptions tailored, and placed in the most proper physical machine according to its performance goals. By encapsulating jobs in VMs, a cloud resource manager can migrate jobs from one PM to another looking to reduce energy consumption or some other OPEX objective, while ensuring the committed QoE with the user [Mi12], [Go10.2].
2.2.2
Datacenter architecture
When designing energy-efficient DCs, their internal architecture must be kept in mind. A certain number of switches are needed to provide connectivity between servers in the DC and to interface the DC with the Internet. Consequently, according to the DC architecture being adopted, a corresponding power is consumed, which basically depends on the number and type of switches used. Several intra-DC architectures have been studied in the literature (see [YZh13] for a detailed survey). Among them, the so-called flattened butterfly architecture has been identified as the most power-efficient DC architecture, since its power
Chapter 2 - Background and state of the art 9
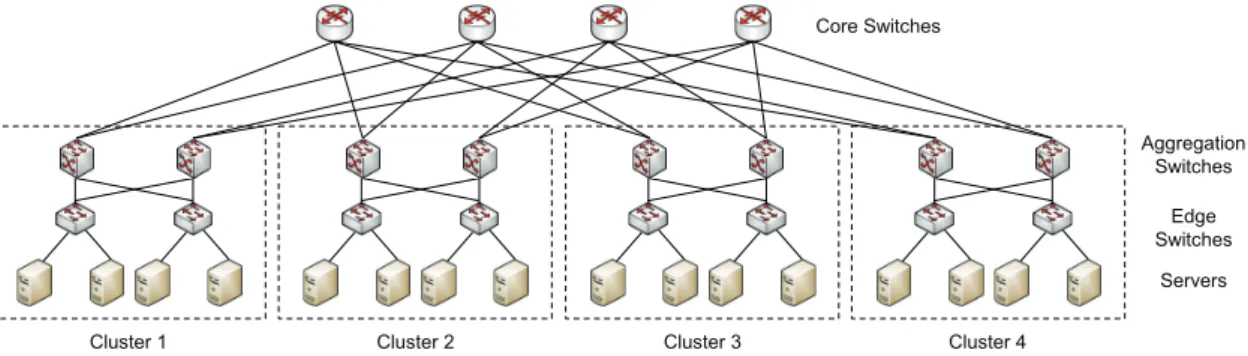
consumption is proportional to the number of currently used servers. However, the most widely-deployed architecture for DC is the so-called fat-tree topology [Fa08], which is based on a hierarchical structure where large higher-order switches represent the interface of the DC towards the network infrastructure, and are connected to the servers via a series of lower-order switches, providing the intra-DC connectivity. Fig. 2-3 illustrates an example of a fat-tree topology consisting of three switching layers; from top to bottom: Core, Aggregation and Edge.
Edge Switches Aggregation Switches Core Switches Servers Cluster 1 Cluster 2 Cluster 3 Cluster 4
Fig. 2-3. Example of fat-tree datacenter architecture (M=4).
As it is depicted in Fig. 2-3, the lower layers –aggregation and edge– together with the servers are organized in a number of clusters, M. In each of these clusters, switches have M interfaces operating at the same bitrate. Each cluster has M/2 edge switches and M/2 aggregation switches, all with M ports; it constitutes a
bipartite graph by connecting each edge to every aggregation switch. In each edge switch, M/2 ports are connected directly to servers and the other M/2 ports are connected to M/2 ports of the aggregation switches. Thus, each cluster has M2/4
servers and there are M3/4 servers in total in the DC. There are (M/2)2M-port core
switches, each having one port connected to each cluster, whilst each cluster is connected to every core switch.
2.2.3
Datacenter power model
Considering a single DC, two main contributions to its power consumption can be distinguished: i) the power consumed by IT devices, PIT, which comprises both the
servers located in the DC as well as the switches employed to interconnect those servers; ii) the power consumption of the non-IT equipment, Pnon-IT, such as cooling,
power supplies and power distribution systems. Thus, total power consumption of a DC can be computed as PDC = PIT + Pnon-IT. PIT can be easily estimated by counting
the number of servers and switches of a DC. However, it is difficult to evaluate the power consumption of non-IT devices since it depends on several details and factors which cannot be easily estimated. For instance, the power consumption of the cooling system strongly depends on the geographical location of the DC and on the building hosting that DC.
An indirect way to estimate a numerical value for Pnon-IT is to consider the power
usage effectiveness (PUE) metric [GreenGrid]. PUE can be used as a measure of the energy efficiency of a DC and quantifies the amount of power consumed by non-IT equipment in that DC: PUE = PDC / PIT. Therefore, if PIT and PUE can be
estimated for a given DC, the total power consumed in a DC can be computed as
PDC=PUE*PIT.
Regarding PIT, we can distinguish between the power consumed by the servers and
by network equipment. The power consumed by a server, Pserver(k), depends mainly
on the CPU load (k) utilization, expressed as the ratio between the current load and the maximum capacity of the server. According to [Fa07], the power consumption of a server can be estimated as Pserver(k) = Pserver-idle + (Pserver-max - P server-idle)*k, where Pserver-idle and Pserver-max represent the power consumed by the server
when it is idle and when it operates at its maximum capacity, respectively. The power consumed by network equipment depends on the specific architecture of the DC.
Considering the fat-tree topology described before and assuming that clusters are active when one or more servers are loaded, otherwise the complete cluster is turned-off, the power consumption of cluster i, Picluster, can be estimated as,
(
)
+ + ⋅ ⋅ =∑
= 4 1 2 ) ( 2 M s i s server edge agg i i cluster a M P P P k P , (2.1)where ai indicates whether the cluster is active or not and Pagg and Pedge denote the
power consumption of aggregation and edge switches. According to (2.1), then the power consumption of the IT devices in the DC can eventually be computed as follows, where Pcore denote the power consumption of core switches,
∑
= + ⋅ = M i i cluster core IT M P P P 1 2 4 . (2.2)2.3
Cloud-ready transport network
Transport networks are currently configured with big static fat pipes based on capacity overprovisioning. The rationality behind that is guaranteeing traffic demand and QoS. The capacity of each inter-DC optical connection is dimensioned in advance based on some volume of foreseen data to transfer. Once in operation, scheduling algorithms inside cloud management run periodically trying to optimize some cost function, such as energy costs, and organize VM migration and database (DB) synchronization as a function of the bitrate available.
To avoid transference overlapping (i.e. some migration or DB synchronization not performed in the current period), which may eventually lead to performance degradation, some overdimensioning is needed. Obviously, this static connectivity
Chapter 2 - Background and state of the art 11
configuration adds high costs since large connectivity capacity remains unused in periods where volume to transfer is low. Thus, demands of cloud services require new mechanisms to provide reconfiguration and adaptability of the transport network to reduce the amount of overprovisioned bandwidth; the efficient integration of cloud-based services among distributed DCs, including the interconnecting network, then becomes a challenge.
The cloud-ready transport network was introduced in [Co12] to handle this dynamic cloud and network interaction, allowing on demand connectivity provisioning. The considered reference architecture to support cloud-ready transport networks is shown in Fig. 2-4. A cloud-ready transport network is used to interconnect DCs placed in different locations and to provide bandwidth on demand. To support these huge adaptive connections, flexgrid is the best positioned technology, since it can create optical connections using the required spectral bandwidth based on users’ requirements. Furthermore, by deploying flexgrid networks in the core, network providers can improve spectrum utilization, thus achieving a cost-effective solution to support their services.
Metro IP/MPLS Core Metro
Flexgrid core network Datacenter
Flexgrid core network
Cost efficient high speed transmission up to 1Tb/s. Optical cross-connect (OXC) Interconnection node 1Tb/s variable transponder SDN
(ABNO architecture) Cloud management(IaaS)
IP Network
Separated provisioning and maintenance in different segments (IP & Aggregation).
End-to-end MPLS solution to reduce OPEX
Users
Residential and business
Network-aware control
Joint network & datacenter control and planning to optimize network and IT costs
Fig. 2-4. Architecture to support cloud-ready transport networks.
2.4
Energy expenditures minimization
Since minimizing energy expenditures is really important for DC operators, many papers can be found in the literature partially addressing that problem [Go12], [LLi09], [ZLi11] and [Pi11]. In [Go12], the authors propose scheduling workload in a DC coinciding with the availability of green energy, consolidating all the jobs on
time slots with solar energy available, increasing green energy consumption up to 31%. Authors in [LLi09] present a DC architecture to reduce power consumption, while guarantee QoE. They consider online-monitoring and VM placement optimization achieving energy savings up to 27%. Other works, e.g. [ZLi11], refer to the problem of load balance DC workloads geographically, following green energy availability, to reduce the amount of brown energy consumed focusing mainly on wind energy and the capability to store energy. Other works focus on the importance of counting as “energy expenditure” every element in the DC, not only computing machinery. The author in [Pi11] remarks the idea that all IT equipment counts when consuming energy, also the fluctuation of green energy production and energy transportation are important factors.
As elastic operations for VM migration require huge bitrate to be available among DCs for some time periods, the inter-DC network can be based on the optical technology and must provide automated interfaces to set-up and tear down optical connections with the required bitrate. Some works consider optical networks to interconnect DCs. For instance, the authors in [Bu13] present routing algorithms considering both routing and scheduling and compare energy savings with respect to a scenario where routing and scheduling problems are solved separately. In addition, some works using flexgrid networks to interconnect DCs are currently appearing in the literature. Authors in [JZh13] propose an application controller that interfaces an OpenFlow controller for the flexgrid network, similarly to the approach followed by Google [XZh13]. Notwithstanding, some network operators are supporting ABNO in the IETF, so there is a lack of consensus on the architecture.
2.5
Conclusions
In the view of the above state of the art, to the best of our knowledge, no work compares the way to compute scheduling considering both energy and communications costs in a single framework. In addition, we focus on solar energy, which is more predictable, and take more advantage of our network capabilities to migrate workload. Besides, in this work we assume IETF’s architecture, supported by major European network operators within the IDEALIST project [Ve14.3], [Ve14.4]. All the above is considered in the Elastic Operations in Federated Datacenters for Performance and Cost Optimization, ELFADO, problem.
3
Chapter 3
Cloud computing and networking
The huge energy consumption of DCs providing cloud services over the Internet has motivated different studies regarding cost savings in DCs. Since energy expenditure is a predominant part of the total operational expenditures for DC operators, energy aware policies for minimizing DCs' energy consumption try to minimize energy costs while guaranteeing a certain QoE. Federated DCs can take advantage of its geographically distributed infrastructure by managing appropriately the green energy resources available in each DC at a given time, in combination with workload consolidation and VM migration policies. In this scenario, inter-DC networks play an important role and communication costs must be considered when minimizing operational expenditures. In this chapter we tackle the Elastic Operations in Federated Datacenters for Performance and Cost Optimization, ELFADO, problem for scheduling workload and orchestrating federated DCs. Two approaches, distributed and centralized, are studied and mixed integer linear programming (MILP) formulations and heuristics are provided. Using those heuristics, cost savings are analyzed with respect to a fixed workload placement. Simulation experiments have been carried out considering realistic scenarios.
3.1
Orchestrating federated datacenters
In this section the main objective of elastic operations, i.e. minimizing operational costs by taking advantage from available green energy and cheap brown energy, and a distributed and a centralized approaches for orchestrating federated DCs are described.
3.1.1
Minimizing energy expenditures
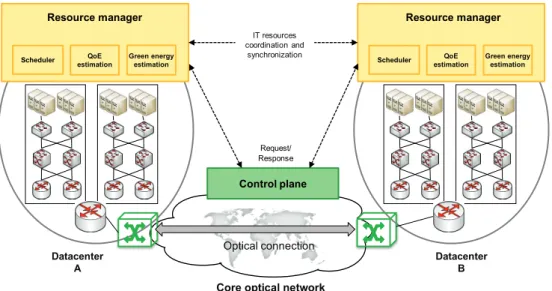
A first optimization to reduce energy expenditures is to perform consolidation, placing VMs so as to load servers as much as possible and switching off those servers that become unused. To further reduce energy consumption, consolidation can be performed by taking into account clusters structure, and switching on/off clusters as single units. Those servers in switched on clusters without assigned load remain active and ready to accommodate spikes in demand. In addition, as stated in the introduction, DC federations can perform elastic operations, migrating VMs among DCs aiming at minimizing operational costs by taking advantage from available green energy in some DCs and off-peak cheap brown energy in other while ensuring the desired QoE level, e.g latency experienced by the users of a service is used as a QoE mesure. We face then, the ELFADO problem, which orchestrates federated DCs providing optimal VM placement so as to minimize operational costs. We assume that operational costs are dominated by energy and communication costs, so we focus on specifically minimizing those costs. Two approaches can be devised to orchestrate federated DCs: i) distributed (Fig. 3-1), where scheduling algorithms running inside DC resource managers compute periodically the optimal placement for the VMs currently placed in the local DC; ii)
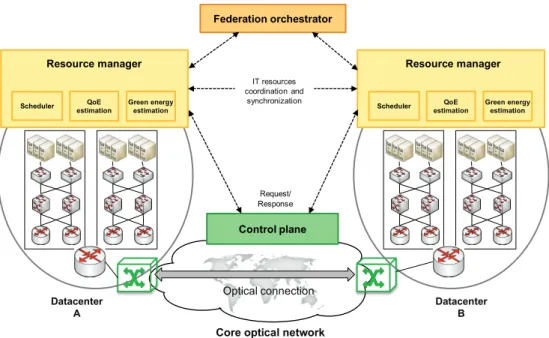
centralized (Fig. 3-2), where a federation orchestrator computes periodically the global optimal placement for all the VMs in the federated DCs and communicates said computation to each DC resource manager. In both approaches, local resource managers interface the rest of DCs to coordinate VM migration and the control plane controlling the interconnection network to request optical datacenter-to-datacenter connections’ set up and tear down.
Core optical network
Scheduler Resource manager QoE estimation Optical connection Datacenter A Request/ Response Green energy estimation Resource manager Datacenter B Control plane IT resources coordination and
synchronization Scheduler QoE
estimation Green energy estimation
Chapter 3 – Cloud Computing and Networking 15
Core optical network
Scheduler Resource manager QoE estimation Optical connection Datacenter A Federation orchestrator Request/ Response Green energy estimation Resource manager Datacenter B Control plane IT resources coordination and
synchronization Scheduler QoE
estimation Green energy estimation
Fig. 3-2. Centralized federated datacenters orchestration.
To solve the ELFADO problem some data must be available, such as an estimation of QoE perceived by the users, the amount of green energy available in each DC, the cost of brown energy, among others. QoE can be estimated by a specialized module inside each resource manager [Verizon]. The cost of brown energy comes from the contract each DC has with the local power supply company, which varies with the time of day. Finally, the amount of green energy that will be likely available in the next period can be predicted using historical data and weather forecast [Sh10]. Each local resource manager can flood all that data to the rest of resource managers in remote DCs.
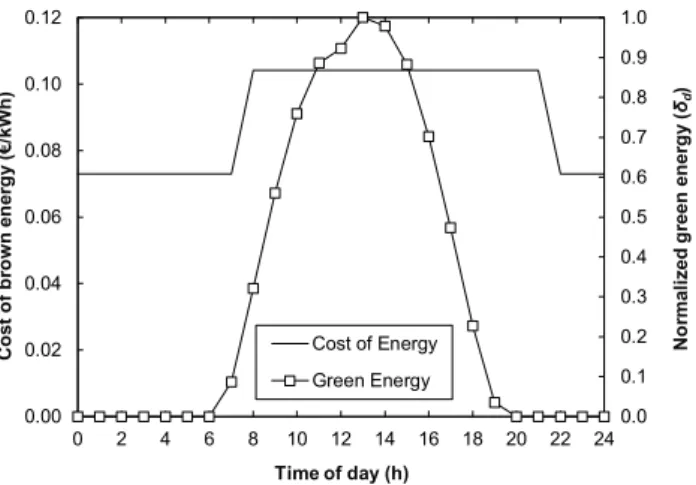
For illustrative purposes, Fig. 3-3 plots unit brown energy cost, cd, and normalized
availability of green energy, δd, for DC d as a function of the time of day. Brown
energy cost varies with the time showing on-peak and off-peak periods, where energy during on-peak is approximately 40% more expensive than during off-peak periods. Regarding green energy availability, large variations during the day can be expected. In the view of Fig. 3-3 it is clear that some advantage can be taken from orchestrating the federated DCs, moving VMs to place them in the most advantageous DC.
Let us assume that DCs are dimensioned to cover some proportion βd of the total
energy consumption for the maximum dimensioning. Then, green coverage in DC
d, αd, can be estimated as, αd(t) = βd * δd(t), and the amount of green energy
available can be estimated as gd(t) = αd(t) * Energy_MaxDimensioning, where
Energy_MaxDimensioning represents the amount of energy consumed for the maximum dimensioning.
C os t of br own e ne rgy (€ /k W h) No rmal iz ed g reen en erg y ( δd ) Time of day (h) 0.0 0.1 0.2 0.3 0.4 0.5 0.6 0.7 0.8 0.9 1.0 0.00 0.02 0.04 0.06 0.08 0.10 0.12 0 2 4 6 8 10 12 14 16 18 20 22 24 Cost of Energy Green Energy
Fig. 3-3. Unit cost of brown energy and normalized availability of green energy against the time of day.
In the distributed approach, local DCs do not know the amount of VMs that will be placed in each DC in the next period, since that decision is to be taken by each DC resource manager in the current period. Therefore, the amount of VMs that can take advantage from green energy availability in each DC in the next period cannot be computed. To overcome that problem, estimation on the unitary energy cost in each DC should be made. We use eq. (3.1),
(
d)
dd c
c∧= 1−α ⋅ , (3.1)
i.e. the cost of the energy in each DC is estimated by decrementing the cost of brown energy with the expected green coverage value. As an example, the estimated cost of the energy is 0.0729 €/kWh at 2am and 0 €/kWh at 1pm (assuming βd=1).
In general, however, green energy covers only partially, even in the generation
peak, total energy consumption, thus βd<1. Therefore, if several DCs take the
decision of migrating local VMs to one remote DC in the hope of reducing costs, it may happen that some brown energy need to be drawn from the grid if not enough green energy is available, which may result in higher energy cost in addition to some communication cost.
In contrast, the amount of VMs to be placed in each DC in the next period is known in the centralized approach since the placing decision is taken in the centralized federation orchestrator. Therefore, one can expect that better VM placements can be done in the centralized approach, which might result into further cost savings.
Chapter 3 – Cloud Computing and Networking 17
3.2
The ELFADO problem
In this section, the ELFADO problem is formally stated and the corresponding MILP models and heuristic algorithms for solving efficiently both distributed and centralized approaches are presented.
3.2.1
Problem statement
The ELFADO problem can be formally stated as follows:
Given:
• a set of federated datacenters D.
• the set of optical connections E that can be established between two datacenters,
• a set of VMs V(d) in each datacenter d,
• a set of client locations L, where nl is the number of users in location l to be
served in the next period,
• PUEd, brown energy cost cd, and green coverage level αd in datacenter d for
the next period,
• the data volume kv and the number of cores coresv of each VM v,
• energy consumption of each server as a function of the load k, wserver(k) =
Pserver(k)*1h,
• the performance pld perceived in location l when served from a virtual
machine placed in datacenter d,
• a threshold thv for the performance required at any time for accessing the
service in virtual machine v.
Output: the datacenter where each VM will be placed the next time period.
Objective: minimize energy and communications cost for the next time period
ensuring the performance objective for each service.
3.2.2
Mathematical formulations
As previously stated, the ELFADO problem can be solved assuming either a distributed or a centralized approach. The following sets and parameters have been defined for both approaches:
Sets:
D set of federated datacenters, index d.
E set of optical connections that can be established, index e. E(d1) set of optical connections between d1 and any other datacenter.
V set of virtual machines, index v.
V(d1) set of virtual machines in datacenter d1.
L set of client locations, index l.
Users and performance:
pld performance perceived in location l when accessing datacenter d.
nl number of users in location l.
thv the threshold performance to be guaranteed for v.
Datacenter architecture and VMs:
M maximum number of clusters per datacenter.
nserver number of cores per server.
kv size in bytes of VM v.
nv number of cores needed by VM v.
Energy:
αd green energy cover in datacenter d.
gd amount of green energy available in datacenter d.
PUEd PUE for datacenter d.
cd brown energy cost per kWh in datacenter d.
wv energy consumption of VM v. It can be computed assuming that the
server where it is placed is fully loaded, so wv = wserver_max/nv.
Connections:
ke maximum amount of bytes to transfer without exceeding the maximum
capacity assigned in connection e. ke includes the needed overhead from
TCP/IP downwards to the optical domain.
Chapter 3 – Cloud Computing and Networking 19
Additionally, the decision variables are:
xvd binary, 1 if virtual machine v is placed in datacenter d, 0 otherwise.
yd real positive, energy consumption in datacenter d.
ze integer positive, bytes to transfer through optical connection e.
The MILP formulation for the ELFADO problem assuming the distributed approach is as follows. It is worth highlighting that this problem is solved by each of the DCs separately; in the model, d1 identifies the local DC.
(
)
∑
(
)
∑
∈ ∈ ⋅ ⋅ + ⋅ ⋅ − D d d d d eEd e e z c y c ELFADO d Distribute ) (1 8 1 minimize α (3.2) subject to: ) ( 1 1 d V v th x p n n v L l d D l ld vd L l l ∈ ∀ ≤ ⋅ ⋅ ⋅∑ ∑
∑
∈ ∈ ∈ (3.3) ) ( 1 v V d1 x D d vd ∈ ∀ =∑
∈ (3.4) D d x w PUE y d V v v vd d d = ⋅∑
⋅ ∀ ∈ ∈ ( 1) (3.5){ }
1 2 ) ( ) , ( \ 1 2 2 1 k x d D d z d V v v vd d d e =∑
⋅ ∀ ∈ ∈ = (3.6) ) (d1 E e k ze≤ e ∀ ∈ (3.7)The objective function in equation (3.2) minimizes the total cost for the VMs in a given DC d1, which consists on the estimated energy costs plus the communication
costs for the VMs that are moved to remote DCs.
Constraint (3.3) guarantees that each VM is assigned to a DC if the on-average performance perceived by the users is above the given threshold. Constraint (3.4) ensures that each VM is assigned to one DC. Constraint (3.5) computes the energy consumption in each DC as a result of moving VM from the local DC. Constraint (3.6) computes the amount of data to be transferred from the local to each remote DC. Finally, constraint (3.7) assures that the capacity of each optical connection from the local DC is not exceeded.
The MILP formulation for the centralized one is presented next. Although the model is similar to the distributed approach, this problem computes a global solution for all the DCs and as a result, the total amount of VMs that will be placed in the next period in each DC can be computed. Therefore, the centralized ELFADO computes the cost of the energy in each DC given the amount of green energy available.
Two additional decision variables are defined:
γd positive integer with the number of servers operating with some load in
datacenter d.
ρd positive integer with the number of clusters switched on in datacenter d.
(
)
∑
∑
∈ ∈ ⋅ ⋅ + ⋅ D d d d e E e e z c y c ELFADO d Centralize minimize 8 (3.8) subject to: V v th x p n n v L l d D l ld vd L l l ∈ ∀ ≤ ⋅ ⋅ ⋅∑ ∑
∑
∈ ∈ ∈ 1 (3.9) V v x D d vd ∈ ∀ =∑
∈ 1 (3.10) D d x n nserver v V v vd d ≥ ⋅∑
⋅ ∀ ∈ ∈ 1 γ (3.11) D d M d d ≥ ⋅γ ∀ ∈ ρ 42 (3.12)(
)
D
d
g
M
w
w
w
w
M
w
M
PUE
y
d d d idle server d server d edge agg core d d−
∀
∈
⋅
−
⋅
+
⋅
+
⋅
+
⋅
+
⋅
⋅
≥
− −γ
ρ
γ
ρ
4
2
4
2 max 2 (3.13) ( ) 2 1 2 1 2 ) , ( , , 1 2 1 k x d d D d d z d V v v vd d d e =∑
⋅ ∀ ∈ ≠ ∈ = (3.14) E e k ze ≤ e ∀ ∈ (3.15)The objective function (3.8) minimizes the total cost for all DCs in the federation, which consists on the energy costs plus the communication costs for the VMs that are moved between DCs.
Constraint (3.9) guarantees that each VM is assigned to a DC if the on-average performance perceived by the users is above the given threshold. Constraint (3.10) ensures that each VM is assigned to one DC. Constraint (3.11) computes, for each DC, the amount of servers where some VM is to be placed, whereas constraint (3.12) computes the number of clusters that will be switched on. Constraint (3.13) computes the brown energy consumption in each DC as the difference between the effective energy consumption, computed as eq. (2.1)-(2.2), and the amount of green energy available in the next period in each DC. Note that w(·)=P(·)*1h. Constraint
Chapter 3 – Cloud Computing and Networking 21
remote DC. Finally, constraint (3.15) assures that the capacity of each optical connection is not exceeded.
The ELFADO problem is NP-hard since it is based upon the on the well-known capacitated plant location problem which has been proved to be NP-hard [Di02]. 0Regarding problem sizes, the number of variables and constraints for each approach are detailed in Table 3-1. Additionally, an estimation of problems’ size is calculated for the scenario presented in Section 4.
Table 3-1. Size of the ELFADO problem.
Constraints Variables Distributed O(|V|+|D|) (104) O(|V|·|D|) (105) Centralized O(|V|+|D|2) (105) O(|V|·|D|) (105)
Although the size of both MILP models is limited, they must be solved in real time (in the order of few seconds). In the experiments described later in this chapter, we used a commercial solver such as CPLEX [CPLEX] to solve each approach. The distributed approach took tens of minutes on average to be solved; more than 1 hour in the worst case, whereas the centralized approach took more than one hour on average. As a consequence, in the next section we propose heuristic algorithms that provide much better trade-off between optimality and complexity to produce solutions in practical computation times, short enough to be used for schedule real federated DCs.
3.2.3
Heuristic algorithms
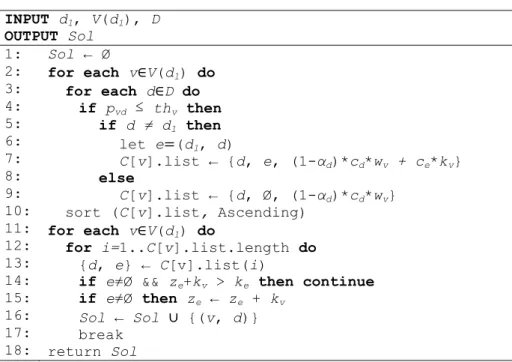
The heuristic algorithm for the distributed approach (Table 3-2) schedules the set of VMs in the local DC. For each VM, all feasible, in terms of performance (pvd),
placements are found and the cost for that placement is computed (lines 2-9). If the placement is in the local DC, only energy costs are considered, whereas if it is in a remote DC communication costs are also included. Note that energy costs are estimated using the green energy cover to decrement the cost of the energy in the considered DC. The list of feasible placements is ordered as a function of the cost (line 10). Each VM is placed afterwards in the cheapest DC provided that the amount of data to be transferred through the optical connection does not exceed the maximum available, in case of a remote placement (lines 11-17). The final solution is eventually returned (line 18).
Table 3-2. Heuristic for the distributed ELFADO. INPUT d1, V(d1), D OUTPUT Sol 1: 2: 3: 4: 5: 6: 7: 8: 9: 10: 11: 12: 13: 14: 15: 16: 17: 18: Sol ← Ø for each v∈V(d1) do for each d∈D do if pvd ≤ thv then if d ≠ d1 then let e=(d1, d) C[v].list ← {d, e, (1-αd)*cd*wv + ce*kv} else C[v].list ← {d, Ø, (1-αd)*cd*wv}
sort (C[v].list, Ascending)
for each v∈V(d1) do
for i=1..C[v].list.length do
{d, e} ← C[v].list(i)
if e≠Ø && ze+kv > ke then continue
if e≠Ø then ze ← ze + kv
Sol ← Sol ∪ {(v, d)} break
return Sol
The heuristic algorithm for the centralized approach (Table 3-3) schedules the set of VMs in all the federated DCs. The proposed heuristic focuses on taking advantage from all the available green energy, only considering the cost of brown energy and communications when no more green energy is available. The perceived performance of each VM in its current placement is computed; those infeasible placements (the perceived performance is under the threshold) are added to set U
whereas those which are feasible to the set F (lines 2-7). Next, the remaining green energy in each DC is computed, considering the available green energy and the energy consumption of those feasible placements (line 8). The set R stores those DCs with remaining green energy available.
The remaining green energy in the DCs (if any) is used to place infeasible placements in set U; the cheapest feasible placement if found for each VM in U
provided that the energy consumption of that VM can take advantage from remaining green energy (lines 12-15). If a feasible placement is finally found, the remaining green energy for the selected DC is updated (line 16) and if no green energy remains available, that DC is eventually removed from set R. The same process of maximizing available green energy is performed for the feasible placements in set F (lines 19-25).
Every remaining not yet considered, feasible or unfeasible, placement is stored in the set F to be jointly considered (line 26) and an algorithm similar to the one for the distributed approach is then followed (lines 27-42). The only difference is that the cost of new placements is computed considering that all the energy will come from brown sources (lines 32 and 34). Finally, the solution for all the DCs is returned.
Chapter 3 – Cloud Computing and Networking 23
Table 3-3. Heuristic for the centralized ELFADO. INPUT V, D OUTPUT Sol 1: 2: 3: 4: 5: 6: 7: 8: 9: 10: 11: 12: 13: 14: 15: 16: 17: 18: Initialize Sol ← Ø; U ← Ø; F ← Ø; R ← Ø for each d∈D do Ud ← Ø; Fd ← Ø for each v∈V(d) do if pvd > thv then Ud ← Ud ∪ {(v, d)} else Fd ← Fd ∪ {(v, d)} rd ← gd computeEnergy (Fd) U ← U ∪ Ud; F ← F ∪ Fd if rd < 0 then R ← {(d, rd)} if R≠Ø then for each (v, d1)∈U do
find (d2, rd2)∈R feasible for v such that rd > wv with min
comm cost Sol ← Sol ∪ {(v, d2)} rd2 ← rd2 – PUEd2*wv if rd2 <=0 then R ← R \ {(d2, rd2)} 19: 20: 21: 22: 23: 24: 25: 26: if R≠Ø then for each (v, d1)∈F do
find (d2, rd2)∈R feasible for v such that rd > wv with min
comm cost Sol ← Sol ∪ {(v, d2)} rd2 ← rd2 – PUEd2*wv if rd2 <=0 then R ← R \ {(d2, rd2)} F ← F ∪ U 27: 28: 29: 30: 31: 32: 33: 34: 35: 36: 37: 38: 39: 40: 41: 42: 43: for each {v, d1}∈F do for each d2∈D do if pvd2 ≤ thv then if d2 ≠ d1 then let e=(d1, d2) C[v].list ← (d2, e, cd2*wv + ce*kv ) else C[v].list ← (d2, e, cd2*wv)
sort (C[v].list, Ascending)
for each (v, d1)∈F do
for i=1..C[v].list.length do
(d2, e) ← C[v].list(i)
if e≠Ø && ze+kv > ke then continue
if e≠Ø then ze ← ze + kv
Sol ← Sol ∪ {(v, d2)}
break return Sol
The performance of each of the proposed heuristic algorithms was compared against the corresponding MILP model. In all the experiments performed, the heuristics were able to provide a much better trade-off between optimality and
computation time; in all the tests the optimal solution was found within running times of hundreds of milliseconds, in contrast to tens of minutes (for the distributed) and even hours (for the centralized) needed to find the optimal solution with the MILP models. Thus, we use the heuristics to solve the instances in the scenario presented in the next section.
3.3
Performance evaluation
In this section, we present the scenario considered in our experiments and we show the results from solving the ELFADO problem considering a realistic instance; we evaluate the impact in the cost when distributed and centralized approaches are used for scheduling VM placement compared to a fixed placement, where no scheduling is done.
3.3.1
Scenario
For evaluation purposes, we implemented the proposed heuristic algorithms for the distributed and centralized ELFADO approaches on a scheduler in the OpenNebula cloud management middleware [OpNeb]. For comparison, a fixed
approach, where the total workload is evenly distributed among the federated DCs, was also implemented.
We consider the global 11-location topology depicted in Fig. 3-4. Each location collects user traffic towards the set of federated DCs, which consists of five DCs strategically located in Taiwan, India, Spain, and Illinois and California in the USA. A global telecom operator provides optical connectivity among DCs, which is based upon the flexgrid technology. The number of users in each location was computed considering Wikipedia's audience by regions [MetaWiki] and it was scaled and distributed among the different locations in each region. Latency between location pairs was computed according to [Verizon].
Table 3-4 briefly presents the value considered for some representative energy parameters. Daily PUE values were computed according to [Go12] using data obtained from [USEIA]. Green energy coverage was obtained from [USEIA], [USEERE] and [Ki04] and brown energy cost for each DC was estimated from their respective local electric company rates (e.g. [EUEP] and [USBLS]). Servers in DCs are assumed to be HP ProLiant DL580 G3 [HP], equipped with four processors, 2 cores per processor, with Pserver-idle = 520W and Pserver-max = 833W.
Chapter 3 – Cloud Computing and Networking 25 Peru Brazil California Ireland Florida Illinois Spain Australia India Taiwan Saudi Arabia Users location
Datacenter + users location
Fig. 3-4. Scenario: federated datacenters, locations and inter-datacenter network. In line with [Fa08], DCs are dimensioned assuming a fat-tree topology with a maximum of M=48 clusters with two levels of switches and M2/4=576 servers each.
The number of VMs was set to 35,000, with individual image size of 5 GB; we assume that each VM runs in one single core. An integer number of clusters is always switched on, so as to support the load assigned to the DC; those servers without assigned load remain active and ready to accommodate spikes in demand. Green cover was set to ensure, at the highest green energy generation time, a proportion of energy βd when all VMs run in DC d.
We consider a different type of switch, and thus a different power consumption value, for each layer of the intra-DC architecture. We selected the Huawei [HUAWEI] CloudEngine switches series; Table 3-5 specifies the model, switching capacity and power consumption for each considered switch.
Table 3-4. Value of energy parameters.
Datacenter cd (on/off peak)
(€/kWh) βd PUE (max/ avg)
Taiwan 0.0700 / 0.0490 0.5 1.671 / 1.632
India 0.0774 / 0.0542 0.9 1.694 / 1.694
Spain 0.1042 / 0.0729 0.9 1.670 / 1.457
Illinois 0.0735 / 0.0515 0.2 1.512 / 1.368
California 0.0988 / 0.0692 0.5 1.385 / 1.303
Table 3-5. Characteristics of Huawei CloudEngine switches.
Layer Model Switching capacity consumption Power
Core 12812 48 Tb/s Pcore = 16,200 W
Aggregation 6800 1.28 Tb/s Pagg = 270 W
Finally, we consider that each DC is connected to the flexgrid inter-DC network through a router equipped with 100 Gb/s bandwidth variable transponders. Therefore, the actual capacity of optical connections is limited to that value. To compute the real throughput, we consider headers for the different protocols, i.e. TCP, IP, and GbE. The maximum amount of bytes to transfer, ke, was computed to
guarantee that VM migration is performed in less than 40 minutes.
3.3.2
Illustrative results
Results obtained in the different simulations carried out are presented and analyzed in the following paragraphs.
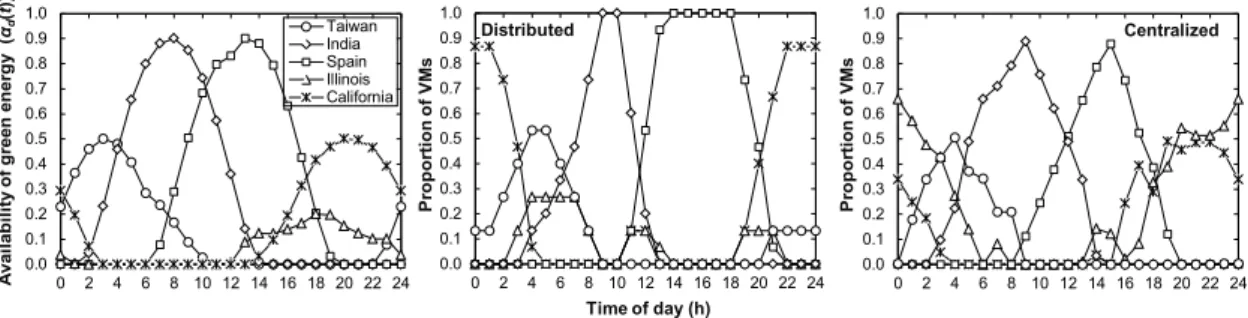
Fig. 3-5 (left) shows the availability of green energy as a function of the time (GMT) at each DC, αd(t), for a typical spring day, whereas the two rightmost graphs in Fig.
3-5 illustrate the behavior of the distributed (center) and centralized (right) ELFADO approaches. The distributed approach places VMs in DCs where the cost of energy (plus communication costs) is expected to be minimal in the next period; equation (3.1) is used for said energy cost estimation. However, in view of Fig. 3-5 (center), it is clear that equation (3.1) does not provide a clear picture, since all VMs are placed in India and Spain during the day periods where more green energy is available in those locations, thus exceeding green energy availability and paying a higher cost. In contrast, DC in Illinois seems to be very little utilized. Interestingly, the centralized approach reduces the percentage of VMs in those DCs with higher green coverage, to place only the amount of VMs (translated into powered-on clusters and servers) that the available green energy can support and placing the rest considering brown energy (and communication) costs. In fact, the DC in Illinois is more used in the centralized approach as a consequence of its cheaper brown energy cost compared to that of California.
Time of day (h) Pr opor tion of V M s Pr opor tion of V M s A vai lab ili ty of g reen en erg y ( αd ( t )) 0.0 0.1 0.2 0.3 0.4 0.5 0.6 0.7 0.8 0.9 1.0 0 2 4 6 8 10 12 14 16 18 20 22 24 Taiwan India Spain Illinois California 0.0 0.1 0.2 0.3 0.4 0.5 0.6 0.7 0.8 0.9 1.0 0 2 4 6 8 10 12 14 16 18 20 22 24 Distributed 0.0 0.1 0.2 0.3 0.4 0.5 0.6 0.7 0.8 0.9 1.0 0 2 4 6 8 10 12 14 16 18 20 22 24 Centralized
Fig. 3-5. Availability of green energy vs. time in all datacenters (left). Percentage of VMs in each datacenter when the distributed (center) and the centralized (right)
Chapter 3 – Cloud Computing and Networking 27
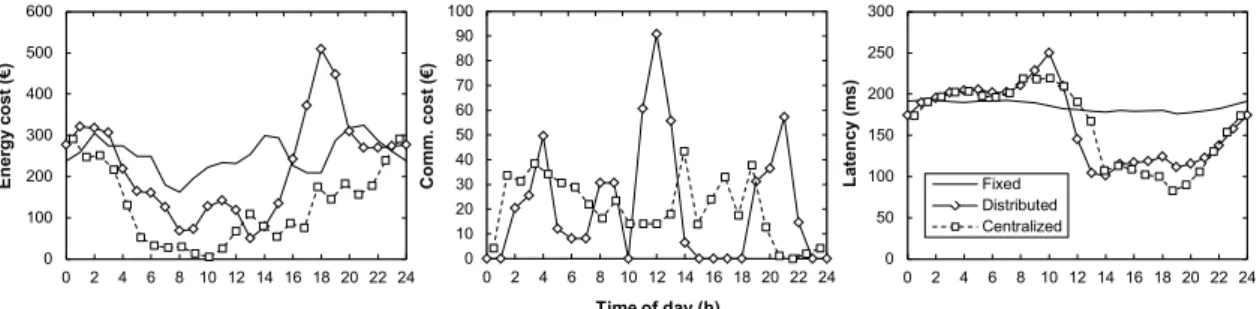
Fig. 3-6 presents costs and performance as a function of the time for all three approaches; cost per transmitted bit was set to 1e-9 €/Gb*km. Energy costs per hour plots in Fig. 3-6 (left) show a remarkable reduction in energy costs when some ELFADO approach is implemented, with respect to the fixed approach. Daily comparison presented in Table 3-6 shows savings of 11% for the distributed and over 52% for the centralized approach. Hourly plot for the distributed approach clearly highlights how by placing VMs in DCs where the estimated energy is cheaper, results in a high amount of brown energy being drawn from the grid at a more expensive price. In contrast, the centralized approach leverages green energy arriving to virtually zero energy cost in some periods.
Regarding communication costs (Fig. 3-6 (center)), the distributed approach shows a more intensive use, presenting three peaks, exactly when the DC in Illinois is used to compensate energy costs between green energy availability peaks in the rest of DCs. However, although the centralized approach is less communications intensive, the total daily communications costs are only under 6% cheaper compared to the distributed approach, as shown in Table 3-6.
Aggregated daily costs are detailed in Table 3-6 for all three approaches. As shown, the distributed approach saves only 2% of total cost when compared to the fixed approach. Although, that percentage represents more than 100€ per day, it is just a small portion of the savings obtained by the centralized approach, which are as high as just over 44% (more than 2.6 k€ per day).
En erg y co st (€ ) Time of day (h) Co mm. co st (€ ) Lat en cy ( ms) 0 100 200 300 400 500 600 0 2 4 6 8 10 12 14 16 18 20 22 24 0 10 20 30 40 50 60 70 80 90 100 0 2 4 6 8 10 12 14 16 18 20 22 24 0 50 100 150 200 250 300 0 2 4 6 8 10 12 14 16 18 20 22 24 Fixed Distributed Centralized
Fig. 3-6. Energy (left) and communication (center) cost per hour against time. Latency vs. time (right).
Table 3-6. Comparison of daily costs and performance.
Approach Energy cost Comm. cost Total cost Average latency
Fixed 6,048 € - 6,048 € 185.2 ms Distributed 5,374 € (11.1%) 537 € 5,912 € (2.3%) 164.2 ms (11.3%) Centralized 2,867 € (52.6%) 508 € (5.8%) 3,376 € (44.2%) 161.5 ms (12.8%)
Regarding performance (latency), both the distributed and the centralized approach provide figures more than 10% lower than that of the fixed approach as shown in Table 3-6. Hourly plots presented in Fig. 3-6 (right) show that latency is slightly higher during some morning periods under both, the distributed and the centralized ELFADO, with respect to that of the fixed; however, in after noon periods, both approaches reduce latency extraordinary since VMs are placed closer to users.
The results presented in Fig. 3-6 were obtained by fixing the value of thv to
1.3*average(latency_fixed) (specified in Table 3-6), so as to allow obtaining worse hourly performance values in the hope of obtaining better daily ones. Fig. 3-7a gives insight of the sensitivity of costs to the value of that threshold. Fixed costs are also plotted as a reference. Costs in the centralized approach show that even for very restrictive thresholds, noticeable cost savings can be obtained. In addition, when the threshold is set to the average latency in the fixed approach or above, obtained costs are almost constant. In contrast, the distributed approach proves to be more sensible to that threshold, reaching a minimum in terms of costs when the threshold value is 30% over the average latency in the fixed approach.
0 1,000 2,000 3,000 4,000 5,000 6,000 7,000 8,000 0.8 0.9 1 1.1 1.2 1.3 1.4 1.5 Fixed Distributed Centralized 0 100 200 300 400 500 600 0.8 0.9 1 1.1 1.2 1.3 1.4 1.5 0 1,000 2,000 3,000 4,000 5,000 6,000 7,000 8,000 9,000 0.8 0.9 1 1.1 1.2 1.3 1.4 1.5 En erg y co st (€ ) Performance multiplier Co mm. co st (€ ) To tal co st (€ ) 0 1,000 2,000 3,000 4,000 5,000 6,000 7,000 8,000 1 2 3 4 5 6 0 500 1,000 1,500 2,000 2,500 1 2 3 4 5 6
Cost per bit multiplier
0 1,000 2,000 3,000 4,000 5,000 6,000 7,000 8,000 1 2 3 4 5 6 a) b) En erg y co st (€ ) Co mm. co st (€ ) To tal co st (€ )
Chapter 3 – Cloud Computing and Networking 29
Finally, Fig. 3-7b illustrates the influence of the cost per bit to transfer VMs from one DC to another. As before, fixed costs are plotted for reference. Energy costs in the distributed approach increase sharply when the cost per bit doubles, almost preventing from moving VMs, as clearly shown Fig. 3-7b (middle). Nonetheless, energy costs are almost stable in the centralized approach. Recall that the proposed heuristic focuses on green energy availability as the first indicator for placing VMs. In fact, communication cost increase linearly with the increment in the cost per bit. However, it is not until the cost per bit increases more than 6 times when the centralized approach cost equals that of the fixed approach.
3.4
Conclusions
The enormous energy consumption of DCs translates into high operational expenditures for DC operators. Although the use of green energy allows reducing the energy bill, its availability is limited depending on the hour of the day, weather