1
Advanced perfusion quantification methods
for dynamic PET and MRI data modelling
Automatica, Bioengineering and Operation Research (ABRO)
PhD program
Cycle XXXI
Department of Computer, Control and Management Engineering
‘Antonio Ruberti’
Candidate
Marianna Inglese
01201218
Supervisor
Prof. Febo Cincotti
3 “Allora dovresti dire quello a cui credi”, riprese la Lepre Marzolina.
“È quello che faccio”, rispose subito Alice; “almeno credo a quello che dico, che poi è la stessa cosa.” “Non è affatto la stessa cosa!” disse il Cappellaio. “Scusa, è come se tu dicessi che vedo quello che mangio è la stessa cosa di mangio quello che vedo!”
5
Summary
The functionality of tissues is guaranteed by the capillaries, which supply the microvascular network providing a considerable surface area for exchanges between blood and tissues. Microcirculation is affected by any pathological condition and any change in the blood supply can be used as a biomarker for the diagnosis of lesions and the optimization of the treatment. Nowadays, a number of techniques for the study of perfusion in vivo and in vitro are available. Among the several imaging modalities developed for the study of microcirculation, the analysis of the tissue kinetics of intravenously injected contrast agents or tracers is the most widely used technique. Tissue kinetics can be studied using different modalities: the positive enhancement of the signal in the computed tomography and in the ultrasound dynamic contrast enhancement imaging; T1-weighted MRI or the negative enhancement of T2* weighted MRI signal for the dynamic susceptibility contrast imaging or, finally, the uptake of radiolabelled tracers in dynamic PET imaging. Here we will focus on the perfusion quantification of dynamic PET and MRI data. The kinetics of the contrast agent (or the tracer) can be analysed visually, to define qualitative criteria but, traditionally, quantitative physiological parameters are extracted with the implementation of mathematical models. Serial measurements of the concentration of the tracer (or of the contrast agent) in the tissue of interest, together with the knowledge of an arterial input function, are necessary for the calculation of blood flow or perfusion rates from the wash-in and/or wash-out kinetic rate constants. The results depend on the acquisition conditions (type of imaging device, imaging mode, frequency and total duration of the acquisition), the type of contrast agent or tracer used, the data pre-processing (motion correction, attenuation correction, correction of the signal into concentration) and the data analysis method.
As for the MRI, dynamic contrast-enhanced magnetic resonance imaging (DCE-MRI) is a non-invasive imaging technique that can be used to measure properties of tissue microvasculature. It is sensitive to differences in blood volume and vascular permeability that can be associated with tumour angiogenesis. DCE-MRI has been investigated for a range of clinical oncologic applications (breast, prostate, cervix, liver, lung, and rectum) including cancer detection, diagnosis, staging, and assessment of treatment response. Tumour microvascular measurements by DCE-MRI have been found to correlate with prognostic factors (such as tumour grade, microvessel density, and vascular endothelial growth factor expression) and with recurrence and survival outcomes. Furthermore, DCE-MRI changes measured during treatment have been shown to correlate with outcome, suggesting a role as a predictive marker. The accuracy of DCE-MRI relies on the ability to model the pharmacokinetics of an injected contrast agent using the signal intensity changes on sequential magnetic resonance images. DCE-MRI data are usually quantified with the application of the pharmacokinetic two-compartment Tofts model (also known as the standard model), which represents the system with the plasma and tissue (extravascular extracellular space) compartments and with the contrast reagent exchange rates between them. This model assumes a negligible contribution from the vascular space and considers the system in, what-is-known as, the fast exchange limit, assuming infinitely fast transcytolemmal water exchange kinetics. In general, the number, as well as any assumption about the compartments, depends on the properties of the contrast agent used (mainly gadolinium) together with the tissue physiology or pathology studied. For this reason, the choice of the model is crucial in the analysis of DCE-MRI data.
6 The value of PET in clinical oncology has been demonstrated with studies in a variety of cancers including colorectal carcinomas, lung tumours, head and neck tumours, primary and metastatic brain tumours, breast carcinoma, lymphoma, melanoma, bone cancers, and other soft-tissue cancers. PET studies of tumours can be performed for several reasons including the quantification of tumour perfusion, the evaluation of tumour metabolism, the tracing of radiolabelled cytostatic agents. In particular, the kinetic analysis of PET imaging has showed, in the past few years, an increasing value in tumour diagnosis, as well as in tumour therapy, through providing additional indicative parameters. Many authors have showed the benefit of kinetic analysis of anticancer drugs after labelling with radionuclide in measuring the specific therapeutic effect bringing to light the feasibility of applying the kinetic analysis to the dynamic acquisition. Quantification methods can involve visual analysis together with compartmental modelling and can be applied to a wide range of different tracers. The increased glycolysis in the most malignancies makes 18F-FDG-PET the most common
diagnostic method used in tumour imaging. But, PET metabolic alteration in the target tissue can depend by many other factors. For example, most types of cancer are characterized by increased choline transport and by the overexpression of choline kinase in highly proliferating cells in response to enhanced demand of phosphatidylcholine (prostate, breast, lung, ovarian and colon cancers). This effect can be diagnosed with choline-based tracers as the 18
F-fluoromethylcholine (18F-FCH), or the even more stable 18F-D4-Choline. Cellular
proliferation is also imaged with 18F-fluorothymidine (FLT), which is trapped within the
cytosol after being mono phosphorylated by thymidine kinase-1 (TK1), a principal enzyme in the salvage pathway of DNA synthesis. 18F-FLT has been found to be useful for
non-invasive assessment of the proliferation rate of several types of cancer and showed high reproducibility and accuracy in breast and lung cancer tumours.
The aim of this thesis is the perfusion quantification of dynamic PET and MRI data of patients with lung, brain, liver, prostate and breast lesions with the application of advanced models. This study covers a wide range of imaging methods and applications, presenting a novel combination of MRI-based perfusion measures with PET kinetic modelling parameters in oncology. It assesses the applicability and stability of perfusion quantification methods, which are not currently used in the routine clinical practice.
The main achievements of this work include: 1) the assessment of the stability of perfusion quantification of D4-Choline and 18F-FLT dynamic PET data in lung and liver lesions,
respectively (first applications in the literature); 2) the development of a model selection in the analysis of DCE-MRI data of primary brain tumours (first application of the extended shutter speed model); 3) the multiparametric analysis of PET and MRI derived perfusion measurements of primary brain tumour and breast cancer together with the integration of immuohistochemical markers in the prediction of breast cancer subtype (analysis of data acquired on the hybrid PET/MRI scanner).
The thesis is structured as follows:
- Chapter 1 is an introductive chapter on cancer biology. Basic concepts, including the causes of cancer, cancer hallmarks, available cancer treatments, are described in this first chapter. Furthermore, there are basic concepts of brain, breast, prostate and lung cancers (which are the lesions that have been analysed in this work).
7 - Chapter 2 is about Positron Emission Tomography. After a brief introduction on the basics of PET imaging, together with data acquisition and reconstruction methods, the chapter focuses on PET in the clinical settings. In particular, it shows the quantification techniques of static and dynamic PET data and my results of the application of graphical methods, spectral analysis and compartmental models on dynamic 18F-FDG, 18F-FLT and 18
F-D4-Choline PET data of patients with breast, lung cancer and hepatocellular carcinoma. - Chapter 3 is about Magnetic Resonance Imaging. After a brief introduction on the basics of MRI, the chapter focuses on the quantification of perfusion weighted MRI data. In particular, it shows the pharmacokinetic models for the quantification of dynamic contrast enhanced MRI data and my results of the application of the Tofts, the extended Tofts, the shutter speed and the extended shutter speed models on a dataset of patients with brain glioma.
- Chapter 4 introduces the multiparametric imaging techniques, in particular the combined PET/CT and the hybrid PET/MRI systems. The last part of the chapter shows the applications of perfusion quantification techniques on a multiparametric study of breast tumour patients, who simultaneously underwent DCE-MRI and 18F-FDG PET on a hybrid PET/MRI scanner.
Then the results of a predictive study on the same dataset of breast tumour patients integrated with immunohistochemical markers. Furthermore, the results of a multiparametric study on DCE-MRI and 18F-FCM brain data acquired both on a PET/CT scanner and on an MR
scanner, separately. Finally, it will show the application of kinetic analysis in a radiomic study of patients with prostate cancer.
9
Contents
Summary ... 5
Abbreviations ... 13
List of figures ... 17
List of tables ... 23
Ringraziamenti... 25
Chapter 1
Cancer biology – Basic concepts ... 27
Carcinogenesis ... 27
-
Cellular oncogenes ... 28
-
Tumour suppressor genes ... 29
Causes of cancer ... 30
Cancer hallmarks ... 31
Cancer treatment ... 33
1. Brain cancer ... 34
Clinical classification ... 34
Risk factors ... 34
2. Breast cancer ... 35
Clinical classification ... 35
Risk factors ... 35
3. Lung cancer ... 36
Clinical classification ... 36
Risk factors ... 37
4. Prostate cancer ... 37
Risk factors ... 37
References ... 39
Chapter 2
The basics of PET ... 41
Detector materials ... 44
Detector configurations ... 47
Data acquisition ... 48
Reconstruction algorithms ... 48
Data correction ... 49
Count rate correction ... 49
Attenuation correction ... 49
PET in the clinical setting ... 50
Quantification techniques ... 50
Applications ... 61
10
1.
Introduction ... 61
2.
Materials and methods ... 61
3.
Results ... 63
4.
Discussion ... 69
II.
Kinetic analysis of dynamic 18F-FLT PET data in the detection of ductal
carcinoma in situ ... 71
1.
Introduction ... 71
2.
Materials and methods ... 72
3.
Results ... 73
4.
Discussion ... 77
III.
[
18F]Fluorothymidine Positron Emission Tomography is a sensitive method for
imaging hepatocellular carcinoma patients undergoing transaterial chemoembolization
79
1.
Introduction ... 79
2.
Materials and Methods ... 80
3.
Results ... 83
4.
Discussion ... 85
References ... 87
Chapter 3
The basics of MRI... 96
MRI Sequences ... 100
Artefacts in MRI ... 103
Perfusion imaging ... 105
DCE-MRI ... 105
DCE-MRI data analysis ... 106
Applications ... 109
I. Comparison of the Tofts and the Shutter Speed Models for DCE-MRI in patients
with Brain Glioma... 109
1.
Introduction ... 110
2.
Materials and Methods ... 111
3.
Results ... 117
4.
Discussion ... 119
5.
Conclusion ... 121
Chapter 4
Multiparametric imaging ... 128
Applications ... 131
I. A multi-parametric PET/MRI study of breast cancer: evaluation of DCE-MRI
pharmacokinetic models and correlation with diffusion and functional parameters 132
1.
Introduction ... 132
2.
Materials and methods ... 133
3.
Image post-processing: background ... 135
4.
Image Analysis ... 136
11
6.
Results ... 138
7.
Discussion ... 140
8.
Conclusions ... 142
II.
Relationship between functional imaging and immunohistochemical markers
and prediction of breast cancer subtype: a PET/MRI study ... 143
1.
Introduction ... 143
2.
Material and Methods ... 143
3.
Results ... 147
4.
Discussion ... 151
III.
Association between pharmacokinetic parameters from DCE-MRI and
metabolic parameters from dynamic 18F-fluoromethylcholine PET in human brain
glioma. ... 154
1.
Introduction ... 154
2.
Materials and Methods ... 155
3.
Results ... 160
4.
Discussion ... 162
5.
Conclusions ... 163
IV.
Clinical translation of [
18F]ICMT-11 for measuring chemotherapy-induced
caspase 3/7 activation in breast and lung cancer ... 164
1.
Introduction ... 164
2.
Materials and methods ... 165
3.
Results ... 168
4.
Discussion ... 178
5.
Conclusion ... 181
V.
Multiparametric MRI in prostate cancer: a radiomic study on different diffusion
and perfusion models ... 182
1.
Materials and Methods ... 182
2.
Results ... 182
References ... 187
13
Abbreviations
[18F]FDG 2-deoxy-2-[18F] fluoro-D-glucose [18F]ICMT-11 [18 F](S)-1-((1-(2-fluoroethyl)-1H-[1,2,3]-triazol4-yl)methyl)-5-(2(2,4-difluorophenoxymethyl)-pyrrolidine-1-sulfonyl) 18F-FCH 18F-fluoromethylcholine 18F-FLT 3-deoxy-3’-[18F] fluorothymidine 3G third-generationAASLD American Association for the Study of Liver Diseases
AC Alternating Current
ACD Annihilation Coincidence Detection ADC Apparent Diffusion Coefficient AIC Akaike Information Criteria AIF Arterial Input Function
APD Avalanche Photodiode
ASL Arterial Spin Labelling ATP Adenosine Triphosphate AUC Area Under the Curve
BALDERO Blood Agent Level Dependent and Extravasation Relaxation Overview BBB Blood Brain Barrier
BC Breast Cancer
BGO Bismuth Germanate
BOLD Blood Oxygenation Level–Dependent BPH Benign Prostatic Hyperplasia
BRC Biomedical Research Centre
BSA Body Surface Area
Ca Arterial Blood
ChKα Choline Chinase
CM Compartmental Modelling
CR Complete Response
14
CT Computed Tomography
Ct Concentration in Tissue
CV Coefficient of Variation CWM Contralateral White Matter DCE Dynamic Contrast Enhanced DCIS Ductal Carcinoma in Situ DKI Diffusion Kurtosis Imaging DOI Depth Of Interaction
DSC Dynamic Susceptibility Contrast DWI Diffusion-Weighted Imaging ECM Extracellular Matrix
EES Extravascular Extracellular Space ESSM Extended Shutter Speed Model ETL Echo Train Length
ETM Extended Tofts Model FID Free Induction Decay
FLAIR Fluid-Attenuated Inversion-Recovery
FMC Fluoromethylcholine
FORE Fourier Rebinning
FOV Field of View
FRT Fractional Retention FXL Fast Exchange Limit FXR Fast Exchange Regime
Gd Gadolinium
Gd-DTPA Gadolinium-Diethylene Triaminepentacetate
GF Growth Factors
GFR Growth Factors Receptor GRE Gradient Recalled Echo
GSO(Ce) Cerium-doped Gadolinium Oxyorthosilicate (or simply GSO)
H Haematocrit
15
IBC Inflammatory Breast Cancer
ID Invasive Ductal
IHC Immunohistochemistry
IRF Impulse Response Function
IV Intra-Venous
LBM Lean Body Mass
LC Lumped Constant
LOR Line of Response
LSO(Ce) Cerium-doped Lutetium Oxyorthosilicate (or simply LSO)
mRECIST modified Response Evaluation Criteria in Solid Tumours MRI Magnetic Resonance Imaging
NaI(Tl) Thallium-doped Sodium Iodide NCT Neo-adjuvant Chemotherapy
NEM No-Exchange Model
NF Normalization Factor
NIHR National Institute for Health Research NLLS Non-Linear Least Squares
OSEM Ordered-Subset Expectation-Maximization Algorithm
PADS Positron Emission Tomography Based Apoptosis-Dominant Signature
PD Progressive Disease
PET Positron Emission Tomography PFS Progression Free Survival PMT Photomultiplier Tube
PNDS Positron Emission Tomography based Necrosis-Dominant Signature
POB Plasma Over Blood
PR Partial Response
PS Performance Status
PSA Prostate-Ppecific Antigen
PVIS Positron Emission Tomography based Voxel Intensity Sorting
PZ Peripheral Zone
16
RF Radiofrequency
ROI Receiver Operating Characteristic ROI Region of Interest
RSS Residual Sum of Squares
RTS Real-Time Sorter
SA Spectral Analysis
SARM Selective Androgen Receptor Modulator SCLC Small-Cell Lung Cancer
SD Stable Disease
SE Spin Echo
SERM Selective Estrogen Receptor Modulator
SI Signal Intensity
SPECT Single Photon Emission Computed Tomography
SSM Shutter Speed Model
STIR Short Time Inversion Recovery SUV Standardised Uptake Value TAC Time Activity Curve
TACE Transarterial Chemoemobilisation TBR Tumour-to-Background Ratio
TE Echo Time
TI Inversion Time
TIC Time Intensity Curve
TK1 Thymidine Kinase-1
TM Tofts Model
TMA Tissue Microarray
TNBC Triple Negative Breast Cancers
TOF Time of Flight
TR Repetition Time
VD Distribution Volume
VOI Volume of Interest
17
List of figures
Figure 1: The hallmarks of cancer. ... 32
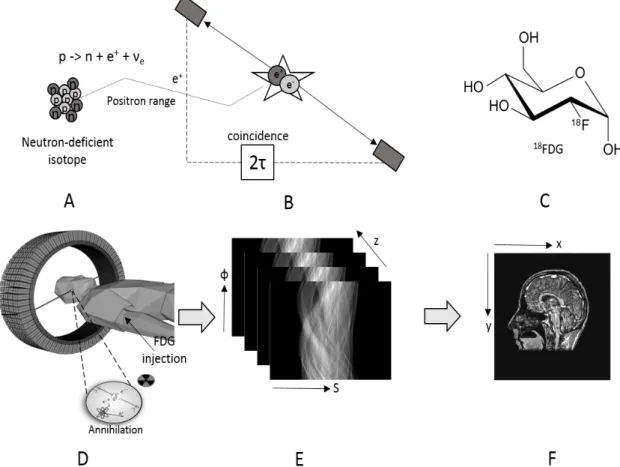
Figure 2: The principle of PET imaging shown schematically, including: (a) the decay of a neutron-deficient, positron-emitting isotope, (b) the detection in coincidence of the annihilation photons within a time window of 2τ ns, (c) the glucose analogue deoxyglucose labelled with the positron-emitter 18F to form the radiopharmaceutical FDG, (d) the injection of the labelled pharmaceutical and the detection of a pair of annihilation photons in coincidence by a multi-ring PET camera, (e) the collection of the positron annihilation events into sonograms where each element of the sonogram contains the number of annihilations in a specific projection direction and (f) a coronal section of the final, reconstructed whole-body image mapping the utilisation of glucose throughout the patient. ... 41
Figure 3: The various events associated with ACD of positron-emitting radionuclides, illustrated for two opposed banks of coincidence detectors and assuming only one opposed pair of detectors are in coincidence. (A) A true coincidence (“true”) is counted only when each of the two 511-keV annihilation gamma-rays for a single positron-negatron annihilation are not scattered and are detected within the timing window τ of the two coincidence detectors. (B) A random or accidental coincidence (“random”) is an inappropriately detected and positioned coincidence (the dashed line) that arises from two separate annihilations, with one gamma-ray from each of the two annihilations detected within the timing window τ of the coincidence-detector pair. (C) A scattered coincidence (“scatter”) is a mispositioned coincidence (the dashed line) resulting from a single annihilation, with one of the gamma-rays undergoing a small-angle Compton scatter but retaining sufficient energy to fall within the 511-keV energy window. (D) A spurious coincidence is an inappropriately detected and positioned coincidence (the dashed line) which arises from an annihilation and a cascade gamma-ray, scattered or unscattered but having sufficient energy to fall within the 511-keV energy window. Spurious coincidences occur only for radionuclides which emit both positron and prompt cascade gamma-ray(s). ... 42
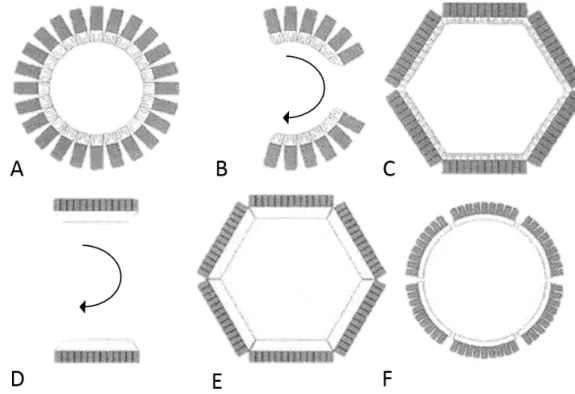
Figure 4: PET scanner detector configurations. (A) Multiple full rings of detector blocks comprised of discrete, small-area detector elements. (B) Multiple partial rings of detector blocks comprised of small-area detector elements. (C) Hexagonal array of detectors banks comprised of small-area detector elements. (D) Opposed large-area detectors such as Anger cameras. (E) Hexagonal array of large-area detectors. (F) Circular arrangement of six large-area, curved detectors. Inset: Multi-coincidence fan beam detection used in detector rings and arrays of small-area detectors. Such fan beam transverse sampling data are generally treated as parallel-beam data. ... 47
Figure 5: One tissue compartment model. It describes the bidirectional flux of tracer between the blood (Ca) and the tissue (Ct). The net tracer flux into tissue equals the flux entering the tissue (K1Ca) minus the flux leaving the tissue (k2Ct). ... 51
Figure 6: Model for measurement of cerebral glucose use with [18F]FDG in a homogeneous tissue. Cp* and Cp represents the concentration of [18F]FDG and glucose in the arterial plasma, respectively; Ce* and Ce are the concentration of [18F]FDG and glucose in exchangeable pool in the tissue; Cm* and Cm are the concentrations of metabolites of [18F]FDG-6-P and glucose in the tissue, respectively. ... 53
Figure 7: Three compartment – four rate constant model. ... 55
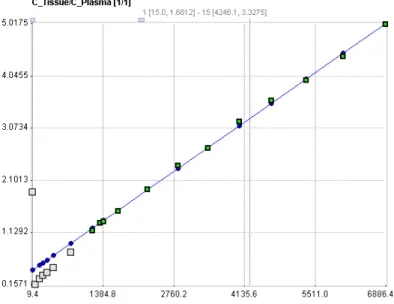
Figure 8: Patlak plot for an irreversible radiotracer. ... 56
18
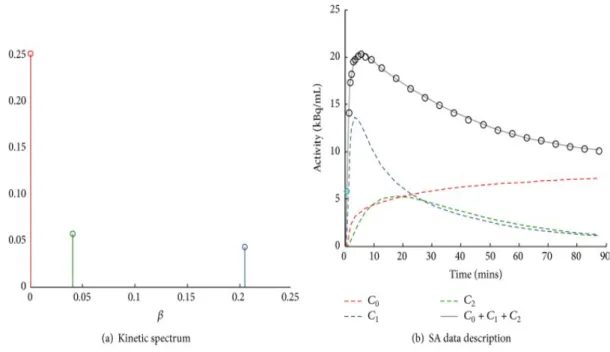
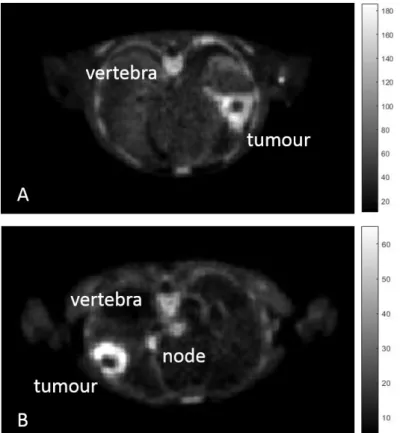
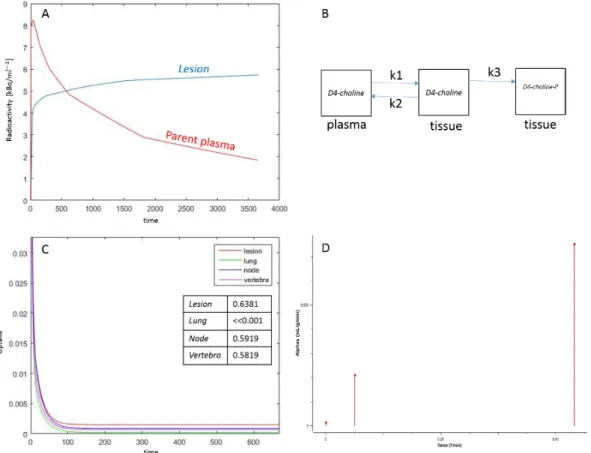
Figure 10:Example of spectral analysis quantification. (a) Representative kinetic spectrum: out of the three spectral components reported, one corresponds to the tracer trapping (red) while the remaining ones refer to two equilibrating components at different frequencies (green and blue). (b) In this example the measured tracer activity (open circles) is described by the sum of the time-activity curves of each individual component of the spectrum (red, green, and blue dashed lines) resulting in the SA data model prediction (grey line). It is important to note that different positions of the components in the spectrum correspond to different shapes of time-activity curves, with the wash-out being slower for low-frequency spectral components and faster for the high-frequency ones [34]. ... 58 Figure 11: Quantification in Positron Emission Tomography. The figure shows a schematic summary of the major PET quantification methods organized by considering for each approach the information returned as function of the application requirements. Clinical and research PET imaging studies are separately reported. Within the diagram a diagonal distribution of the methodologies is clearly evident, indicating that more information is obtainable only at the cost of more modelling assumptions [34]. ... 59 Figure 12: Axial section of summed (last six phases) PET imaging data of patient n.6 (A) and patient n.3 (B) showing high uptake of D4-Choline in tumour, node and vertebra. ... 63 Figure 13: Patient n. 2. A, tumour time activity curve with a parent plasma input function (i.e. activity due to d4-choline); B, compartmental model used to describe the exchange of D4-choline from the plasma into the tissue; C, the unit impulse response function of tumour compared with normal lung, node and vertebra (a zoomed part) (in the tab the values of the FRTs); D, spectrum of kinetic components obtained using spectral analysis. ... 64 Figure 14: Fractional uptake boxplots show the highest retention component in tumour (and in the node). Less retention has been seen in the reference lung and in the vertebra. ... 65 Figure 15 Patient n. 9. Parametric maps for !"_SA [mL/#$3/min], !1_SA [mL/#$3/min],
!"_Patlak [mL/#$3/min] and () [mL/#$3]. ... 66 Figure 16: Boxplots of mean, kurtosis and skewness values (in columns) evaluated for each patient and for each modelling approach (in rows). Arrows point at the statistical differences resulted from the Wilcoxon test. ... 67 Figure 17: Patient 10. Tumour, reference lung tissue, node and vertebra Kernel distribution. On the y axes, the square root of the number of elements of the selected parameter. ... 68 Figure 18: Distribution analysis of patient n. 9. Tumour, reference lung tissue and vertebra Kernel distribution. On the y axes, the square root of the number of elements of the selected parameter. ... 68 Figure 19: DCIS patient n.3. In the first row, analysis results of the dynamic FLT PET data. From left: phase n. of the PET dynamic scan, SA K1, SA on a zoomed section of the breast. In the second row, results from the quantification of dynamic FDG PET data. ... 73 Figure 20: DCIS patient n.1: SA results. The first column shows the spectra derived from the ROI level SA applied on both FLT (first row) and FDG (second row) dynamic PET data. Both tracers presented an a0 value indicating the irreversible trapping of the tracer in the tissue during the time of experiment. The IRFs are shown in the second column with their correspondent FRT value evaluated as the ratio of the IRF at 60 minutes ad at baseline. The last column shows the tissue uptake curves of the two different tracers. ... 74 Figure 21: ROC of spectral Ki and K1. ... 75 Figure 22: ROC on bootstrapped spectral Ki and K1. ... 75
19
Figure 23: mean and 95% CI of spectral Ki/K1 map in breast tumour (red), normal breast (green). The blue dots represent the six DCIS patients: for two of them, the Ki/K1 ratio fell in the tumour
range. ... 76
Figure 24: Patient n. 4. The panel shows the voxelwise SA results for three representative slices (in the three rows) of the DCIS of this patient. In the second column there is a zoomed section of the original PET data (first column). Third, fourth and fifth column are representative of K1, Ki and Ki/K1 maps. ... 76
Figure 25: A) Change in K1 in responders and non-responders; B) Baseline Ki in responders and non-responders; C) Baseline vB in responders and non-responders. ... 85
Figure 26: A) Without a magnetic field the magnetic moments of the nuclei are distributed at random and thus the net magnetization factor is zero. (B) When there is a strong external magnetic field the spinning nuclei align parallel or antiparallel to the external field (B0) with a few more parallel than antiparallel. This results in a net magnetization vector (Mz) parallel to the external magnetic field. ... 96
Figure 27: When the spins are exited with an RF pulse of exactly the Larmor frequency, the net magnetization flips 90° and the spins are ‘‘whipped’’ to precess in phase. The rotating net magnetization vector induces an AC in a receiver coil. ... 97
Figure 28: The received signal detected by the receiver coil, the FID, decreases over time when the net magnetization vector returns to its original orientation. ... 98
Figure 29: Longitudinal relaxation is characterized by theT1 relaxation time, which is the time to recover 63% of the original net magnetization vector. Transverse relaxation is characterized by the T2 time, which is the time it takes to decay the signal to 37% of the original signal. ... 98
Figure 30: Graph shows T2 and T2* relaxation curves. T2* is shorter than T2. ... 99
Figure 31: Pulse sequence technique. ... 100
Figure 32: Time diagram of a conventional spin echo sequence ... 101
Figure 33: Time diagram of a fast spin echo sequence. ... 101
Figure 34: Time diagram of an inversion recovery sequence. ... 102
Figure 35: Time diagram of a gradient echo sequence. ... 103
Figure 36: The fitting procedure for Ktrans. A bounded and unbounded fitting were calculated together with the Akaike Information Criteria (AIC) map (AICb and AICu for the bounded and unbounded procedure, respectively). The final value of Ktrans, for each voxel of the map, was the one obtained from the function with the lowest AIC (kb when AICb < AICu and ku vice versa). The same procedure was carried out for each parameter. ... 113
Figure 37: Measurement of the AIF. The VOI was placed in the carotid artery for the extraction of the arterial input function (AIF) as shown in the axial T1 VIBE image in (A). The time intensity curve for the concentration of contrast reagent in the plasma in the VOI indicated in red in (A) is shown in (B). ... 116
Figure 38: AIC model selection flowchart. The figure shows the hierarchical approach used to determine which model provided the best fit when using the Akaike Information Criteria (AIC). ... 117 Figure 39: Normalized signal intensity curves in a voxel of an enhancing lesion fitted with the no-exchange model (red), TM (blue), ETM (green), SSM (yellow) and ESSM (pink). The quality
20
of fitting was evaluated with the Akaike Information Criteria. AIC value: -103 for the NEM, -445 for TM, -454 for ETM, -531 for SSM and -291 for ESSM. ... 118 Figure 40: Statistical model comparison for two lesions. Each colour is representative of the model which best fitted the input data. An example of one slice of an enhancing (A, WHO grade IV) and non-enhancing (B, WHO grade II) lesion is shown. ... 118 Figure 41: The stability of each pharmacokinetic parameter extracted from the fitting of the model of choice was evaluated, for each lesion, in terms of coefficient of variation in a simulation environment. A and D show two Ktrans maps. The reliability of DCE-MRI data was evaluated by setting a threshold of 20% for the CV. This is overlaid on the Ktrans maps in A and D, shown in red, such that only values of Ktrans under this threshold are displayed on the blue/green colour map. Two tissue activity curves (TACs) relative to two reliable (CV = 12% and CV = 4%) voxels are plotted in B and E. C and F show the TACs relative to two unreliable voxels (CV = 128% and CV = 97%). ... 119 Figure 42: A) Contrast enhanced breast MR image of patient n. 1. The ROI is placed in the aorta for the evaluation of the arterial input function. B) Mean plasma contrast reagent concentration time course from the ROI placed in the aorta. ... 137 Figure 43: A) Contrast enhanced axial breast MR image of patient n. 14. Two voxels have been selected for showing the results of the Tofts and shutter speed model fitting procedure. In particular, the red star is related to the lesion where the blue one belongs to the reference area. B, C) Fitting curves (in red) resulted from the application of the Tofts and shutter speed model to tumour tissue data (red dots) and reference tissue input data (blue dots). ... 137 Figure 44: Patient n. 2; 45 years old, IDC. Representative axial images of a) post contrast MRI T1-weighted image (8th phase); b) MRI subtraction of the baseline scan from the 8th phase; c) attenuation corrected PET image; d) ADC map; e - g) Pharmacokinetic maps evaluated with the Tofts model: Ktrans, Kep and ve; h) iAUC; i - n) Pharmacokinetic maps evaluated with the shutter speed model: Ktrans, Kep, ve and τi. ... 138 Figure 45: Scatterplots showing some relationship between different imaging techniques, with their correspondent trend-lines. A) SUV from PET imaging and ADC from DW-MRI; B) SUV and kep evaluated with the Tofts model; C) ADC and the Ktrans evaluated with the Tofts model; D) SUV and τi derived from the application of the shutter-speed model to DCE-MRI data. ... 140 Figure 46: Inclusion and exclusion criteria for eligible patients. ... 144 Figure 47: Examples of multiparametric analysis in women with breast ductal carcinoma. Multiparametric imaging evaluation of metabolic (PET), morphological (T1w + C), and functional (ADC, Ktrans, ve , kep) parameters in a luminal A BC (a), a luminal B BC (b) and a nonluminal BC (c). With increases in perfusion parameters, FDG uptake increases at the tumour site, enhancement increases in the morphological acquisitions, and diffusivity decreases in the ADC map. ... 146 Figure 48: ROC curve analysis showing the ability of each imaging parameter to discriminate among BC subtypes: a) luminal A vs. luminal B, b) luminal A vs. nonluminal, c) luminal B vs. nonluminal. The tables on the right show the AUCs, p values, and cut-off values of the imaging parameters taking into account the ROC curve analyses (*p < 0.05). ... 150 Figure 49: Measurement of the AIF. The VOI was placed in the carotid artery for the extraction of the arterial input function (AIF) as shown in the axial T1 VIBE image in (A). The time intensity curve for the concentration of contrast reagent in the plasma in the VOI indicated in red in (A) is shown in (B). ... 159
21
Figure 50: Patient n. 3 (WHO grade III). A) 18F-FMC PET; B) Spectral analysis K1 and C) Ki; D) Post gadolinium T1 MR image; E) TM-Ktrans and F) TM- ve; G) SSM-Ktrans, H) SSM-ve and I) τi... 160 Figure 51: Chemical structure of [18F]ICMT-11 and) study design in breast and lung cancer cohorts. a Schematic diagram of chemical structure of [18F]ICMT-11. b Study design in breast cancer patients receiving neoadjuvant chemotherapy. Patients underwent a baseline and follow-up scan with a repeat second breast biopsy under USS guidance, within 24 h of the second PET/CT scan. The cohort of lung cancer patients recruited to study all received first-line chemotherapy (combination chemotherapy with a platinum-based compound — Cisplatin). [18F]ICMT-11 PET/CT and MRI (DWand DCE) were performed at three time-points (baseline, follow-up at 24–48 h, and within 6–8 days post-chemotherapy. FEC= 5- fluorouracil, epirubicin and cyclophosphamide, USS = ultrasound, MRI magnetic resonance imaging, DW= diffusion-weighted, DCE= dynamic contrast-enhanced. ... 166 Figure 52: [18F]ICMT-11 uptake in primary breast tumours. a Axial CT and fused [18F]ICMT-11 PET/CT images of primary breast tumours in two patients, 1 and 2,at baseline (pre-) and post-chemotherapy. Low-level uptake is noted. b Pre- and postchemotherapySUV60ave andSUV60max values of breast tumours imaged at an early time point(24–48 h) or c late time point(2–14 days). Small changes were seen pre- and post-chemotherapy. d First-order statistics were extracted using in house software under Matlab 15a [The MathWorks(R)], and a subset of features were selected to detect changes in early and late imaged breast tumours ... 171 Figure 53: Voxel–wise tumour [18F]ICMT-11 intensity histogram analysis and blood cytokeratin-18 in all breast cancer patients. a PET-based voxel intensity sorting (PVIS) histogram analysis in patients 1, 2, and 3. All patients are late-imaged, (2–14 days) except patient 5* (early imaged 24– 48 h). The intensities of all voxels within the tumour volume of interest (VOI) have been expressed as histogram plots of normalised voxel intensities pre-and post-chemotherapy. These patients demonstrated a predominant PVIS apoptotic signature with right shifts of all voxel intensities within the tumour VOI post-chemotherapy. b PVIS histogram analysis inpatients 5 and 6, showing a predominant PVIS necrotic signature with shift in voxel intensities to the left. Patient 14, showing no dominant signature on PVIS histogram analysis. These results have been analysed statistically and are represented through box-plot diagrams (minimum, maximum, median, 10th and 90th percentile statistical parameters). The differences in AUC shifts noted in each patient are shown in c, demonstrating tumours with a predominant dominant PVIS apoptotic signature (black) or dominant PVIS necrotic signature (white), and d associated outcomes in all fifteen breast patients post 3 and 6 cycles of NCT. Patients are shown as having SD (stable disease), PR (partial response) or CR (complete response). * denotes patients who received trastuzumab alongside their 4th–6th cycle of chemotherapy. Light grey shading (patients1–4, who showed a predominant PVIS apoptotic signature). Mid grey shading (patients 5–13, who showed a predominant PVIS necrotic signature). Dark grey shading (patients 14 and 15, who showed neither a predominant apoptotic nor necrotic shift). e Corresponding CK-18 analysis(M65 and M30) pre-and post-chemotherapy in patients 1, 2, and 3.Graphs highlight the variation in levels, with only patient 3 demonstrating an increase in post-chemotherapy levels ofM65 andM30. f CK-18 (M65and M30) analysis in patients 5 and 6, showing no clear increase post-chemotherapy, and patient 14, who despite showing no dominant signature on PVIS histogram analysis, was found to have an increase in M65and M30 levels post-chemotherapy. ... 172 Figure 54: Cleaved caspase-3 expression in breast patients. a Expression of cleaved caspase-3 detected by immunohistochemistry in breast tissue taken by USS-guided biopsy post-chemotherapy in patients with a predominant PVIS apoptotic signature. b Similar cleaved caspase-3expression in patients with a predominant PVIS necrotic signature no change on PVIS. Arrows (black) demonstrate cleaved caspase-3staining on tissue biopsy post-chemotherapy. c Graph indicates the percentage (%) cleaved caspase-3 expression in breast tissue in all patients
22
taken at baseline (blue bars) and post-chemotherapy (yellow bars). * denotes early imaged (24– 48 h) breast patients. ... 174 Figure 55: Detection of tumour cell death in lung cancer by DW-MRI. (A and B) DW-MRI images for patient 16 and 17 at baseline, 24h and 7d post-chemotherapy. Corresponding apparent diffusion coefficient (ADC) maps in jet colour scale (µm2/s) are shown. (C and D) ADC tumour histograms in patient 16 and 17 depicting the distribution of the voxels as per their intensities at baseline, 24h and 7d post-chemotherapy with histogram analysis using in-house software developed in Matlab 15a (The MathWorks(R)), to calculate mean, skewness, kurtosis, 25th, 50th and 75th percentiles. Voxels with zero ADC values were excluded from the analysis. ... 175 Figure 56: Detection of tumour cell death in lung cancer by [18F]ICMT-11PET/CT. Patient 16 (a) and Patient 17 (c) axial CT and fused [18F]ICMT-11 PET/CT images of primary lung cancer at cancer at baseline, 24 h and7 days post-chemotherapy. PVIS histogram analysis at 24 h and 7 days post-chemotherapy in patient 16 (b) and 17 (d), with clinical outcomes (e and f)... 179 Figure 57: Prediction performances of logistic regression models for diffusion features. ... 183 Figure 58: Prediction performances of logistic regression models for perfusion features. ... 183 Figure 59: Prediction performances of logistic regression models for intermodel approach. .. 184 Figure 60: AUC, Sensitivity, Specificity and Accuracy values for intermodel approach. ... 186 Figure 61: Discriminating power of prediction model of order 7 between BPH and other groups. ... 186
23
List of tables
Table 1: Selected oncogenes and associated cancers ... 28 Table 2: Examples of tumour suppressor genes... 30 Table 3: Individual attenuation contributions and total attenuation coefficients (mass and linear) for various materials and energy levels. Water constitutes the majority of the body material and most tissue attenuation is near to that of water. BGO and LSO are commonly used scintillator material used in PET detectors. The values smaller than 10-3 are neglected. ... 44 Table 4: Physical properties of scintillator materials commonly used for PET. ... 45 Table 5: Patient population and histology. SqCC, squamous cell carcinoma; Adenoca, adenocarcinoma. ... 62 Table 6: Reliability evaluated as the percentage of biologically plausible voxel values. Ki_SA is the parametric map of the irreversible trapping component of the tissue [mL/cm3/min], K1_SA is the global influx rate constant [mL/ cm3/min], Ki _Patlak is the irreversible uptake rate constant [mL/cm3/min] and VT [mL/ cm3] is the Logan distribution volume of the tracer in the tissue. .. 69 Table 7: Spectral analysis results on 18F-FLT and 18F-FDG dynamic PET data of patients with DCIS. Values are expressed in terms of mean and standard deviation (µ ± σ)... 73 Table 8: Spectral Ki and K1 mean values evaluated in breast tumour, healthy tissue and DCIS. 74 Table 9: Spectral Ki and K1 and Ki/K1 ratio values evaluated in breast tumour, healthy tissue and DCIS... 75 Table 10: Eighteen patients were enrolled (16 men and 2 women). A tracer production failure meant one patient was unable to have baseline scanning and one patient withdrew consent following the first PET scan, therefore 16 patients were evaluable for treatment outcome (Table 1). Median age was 68 years (range 42 – 79years). All patients received TACE for intermediate stage disease. Three patients had had previous TACE and were undergoing retreatment. The remaining patients were treatment naïve. One patient did not have radiologic evidence of background cirrhosis. Three patients had diffuse disease on conventional imaging... 80 Table 11: Results of the compartmental analysis done on dynamic [18F]FLT data. The analysis was run on a ROI level and results show the parameters extracted from the single TAC (no standard deviation). ... 84 Table 12: Relaxation times T1 and T2 and proton density in different tissues at different magnetic field strength. ... 98 Table 14: Population clinical parameters. ... 134 Table 15: Mean and standard deviation of pharmacokinetic estimates, ADC and SUV in tumour and reference tissue. A significant statistical difference is marked in bold: * p < 0.05, ** p < 0.01 ... 139 Table 16: Results of the Spearman correlation test applied on the distribution of each parameter. Only the correlations for which p resulted < 0.05 have been reported. ... 139 Table 17: Clinical features of tumour lesions in the 50 selected patients ... 147 Table 18: Molecular subtypes and relative lesion sizes ... 147 Table 19: Estimation parameters summary of variables significantly associated with molecular subtypes. ... 151
24
Table 20: Multivariate analyses. ... 151 Table 21: Estimates of the mean and standard deviation for derived parameters in tumour tissue. The table shows the volume transfer constant Ktrans, the intravasation rate constant kep, the EES volume fraction ve, the intracellular water molecule lifetime τi obtained with the application of the Tofts model (TM) and shutter speed model (SSM). It also shows the net influx rate K1 and in irreversible uptake rate of the tracer Ki evaluated with spectral analysis (SA). Results are expressed in terms of mean and standard deviation (µ ± σ). ... 161 Table 22: Results of the non parametric Spearman correlation test applied between DCE MRI pharmacokinetic results and spectral analysis perfusion parameters. ... 161 Table 23: Results of the Pearson correlation test applied between DCE MRI pharmacokinetic results and TBR ... 161 Table 24: Patient characteristics. ... 170 Table 25: ADC histogram analysis results of lung cancer patients 16 and 17. ... 175 Table 26: Results of the application of the shutter speed model on DCE-MRI data. ... 177
25
Ringraziamenti
Il dottorato è stato un percorso incredibile e non so quante volte, nell'arco di questi tre
anni, abbia ripetuto a me stessa che è stata tutta una follia. Lo penso ancora oggi che
metto la parola fine a questa ulteriore esperienza di crescita professionale e personale.
Come spesso accade nel momento in cui si arriva al traguardo, pensare a ciò che verrà
dopo è inevitabile e, in questo particolare caso, anche tanto incognito quanto eccitante.
Ci sono molte persone che sento di ringraziare, senza le quali probabilmente starei
facendo marmellate a certificazione geografica controllata. Per prima, la mia piccola
grande famiglia composta non solo dai miei genitori, ormai abituati ai miei borsoni, ai
biglietti, ai miei silenzi, ai miei momenti (rari) di soddisfazione personale. Senza di loro,
immagino, avrei avuto la stessa testa dura che mi ha permesso di perseguire tutto questo,
ma con loro, d'altra parte, ho avuto la costante certezza di non essere da sola e di avere
un porto sicuro al quale tornare in periodi di tempesta. Grazie.
La mia famiglia sono i miei amici, sempre presenti con una telefonata, un messaggio, un
“pacco da giù”. Sempre pronti ad accogliermi a braccia aperte (anche agli orari più
improbabili) con un po’ di pane e formaggio e una valanga di affetto, che non è mai
abbastanza. Grazie.
La mia famiglia sono i miei colleghi e anche i miei professori, che mi hanno
accompagnato in questo difficile percorso credendo nelle mie capacità e nella mia
caparbietà. Grazie alla fetta napoletana e a quella inglese, che insieme hanno fatto quella
che sono oggi: ancora una studentessa, certo, ma un pochino più consapevole.
In particolare, ringrazio il prof. Cincotti, che mi ha fatto credere che tutto questo potesse
essere possibile, ringrazio il prof. Aboagye, che mi ha dato i mezzi per riuscirci ma che,
soprattutto, mi ha trasmesso la gioia, la passione, la fede che in questo lavoro bisogna
avere, e il NapLab, che mi ha iniziato a tutto questo. Grazie.
Ringrazio la Prof. Bertoldo e il Dott. Veronese, che con cura hanno contribuito alla
versione finale di questa tesi offrendomi suggerimenti e spunti di approfondimento.
Grazie.
Ed infine, in maniera davvero poco autocelebrativa, ringrazio me stessa, per la
soddisfazione che ho deciso di regalarmi ancora una volta e perché' ho creduto di
potercela fare, non sempre, lo ammetto, ma quel tanto che oggi mi fa essere qui a
ringraziare chi ci ha creduto quanto e con me.
27
CHAPTER
1
Cancer biology – Basic concepts
Cancer is the second most common cause of death in the ‘developed’ world; only cardiovascular disease mortality exceeds that of malignancy [1]. Cancer is the disease of uncontrolled growth and proliferation and it can be considered a multi-step process which requires the accumulation of many genetic changes over time. These genetic alterations involve activation of proto-oncogenes to proto-oncogenes, deregulation of tumour suppressor genes and DNA repair genes and ‘immortalisation’ [2].
Usually, the cell cycle is regulated by proteins that interact with each other in a specific sequence of events. They check that each stage of the cycle is competed correctly ensuring that incompletely replicated DNA is not passed onto daughter cells. This regulation is influenced by transcription receptors in the nucleus, which trigger the start of DNA synthesis. P53 is called the “guardian of the genome” and is able to induce apoptosis if the genomic damage is too great to be repaired. It also induces the expression of cell cycle inhibitors to prevent cell proliferation of a cell until the damage is repaired [2]. Normal mammalian somatic cells proliferate a limited number of times before undergoing senescence. Senescent cells may remain metabolically active even though they have permanently ceased proliferation. Immortalisation is an essential step in the malignant transformation of normal cells and can be attributed, in part, to the presence of telomerase, the enzyme responsible for maintaining telomeres at the ends of chromosomes. By extending telomeric DNA, telomerase is able to counter the progressive telomere shortening that would otherwise lead to cell death. Unlike normal cells that lack detectable levels of telomerase activity, approximately 90% of human tumours consist of cells that contain an active telomerase enzyme [2]. Tissue homeostasis is regulated by growth factors (GFs), which transmit signals from one cell to another. They are sensitive to specific growth factors receptors (GFR), which can activate target molecules promoting proliferation. Normal cell proliferation include:
• the binding of a GF to its specific receptor on the cell membrane
• transient and limited activation of the GFR, which, activates several signal-transducing proteins (e.g. Ras) on the inner leaflet of the plasma membrane
• transmission of the signal by signal transduction molecules, either to cytosolic targets or to the nucleus where they activate transcription of specific genes
• entry of the cell into the cell cycle, ultimately resulting in cell division.
This pathway is often derailed in cancer and allows wayward cells to generate their own internal signals that stimulate proliferation and become independent of their environments. In fact, cancer cells are able to induce their own growth stimulatory signals when mutations in the GFR gene occur, which facilitates activation in the absence of GFs or when overproduction of GFs results in an autocrine signalling loop [2]. An alternative strategy by which cancer cells can become GF independent involves constitutive activation of internal signalling components.
Carcinogenesis
The genes that have been implicated in carcinogenesis are grouped in oncogenes and tumour suppressor genes.
28
-
Cellular oncogenes
Genes that promote autonomous cell growth in cancer cells are called oncogenes, and their normal cellular counterparts are called proto-oncogenes. Proto-oncogenes are physiologic regulators of cell proliferation and differentiation while oncogenes are characterised by the ability to promote cell growth in the absence of normal mitogenic signals. Their products, oncoproteins, resemble the normal products of proto-oncogenes with the exception that oncoproteins are devoid of important regulatory elements. Their production in the transformed cells becomes constitutive, that is, not dependent on growth factors or other external signals. Proto-oncogenes can be converted to oncogenes by several mechanisms including point mutation and gene amplification resulting in:
• Overproduction of growth factors
• Flooding of the cell with replication signals
• Uncontrolled stimulation in the intermediary pathways
• Cell growth by elevated levels of transcription factors
The RAS oncogene is the most frequently mutated oncogene in human cancer. It encodes a GTP-binding protein Ras that functions as an on-off ‘switch’ for a number of key signalling pathways controlling cellular proliferation [2]. Other oncogenes frequently mutated in cancer are listed in Table 1.
Table 1: Selected oncogenes and associated cancers
Category/Protein Function
Proto-oncogene
Mode of Activation Associated Cancer
Growth Factors
-PDGF (β chain)
-Fibroblast growth factors
-Transforming growth factor α SIS HST-1 INT-2 TGFα Overexpression Overexpression Amplification Overexpression Astrocytoma, osteosarcoma Stomach cancer
Bladder and breast cancer Melanoma
Astrocytomas
Hepatocellular carcinomas
Growth factor Receptors
-EGF-receptor family
-PDGF receptor -Receptor for stem cell (steel) factor ERB-B1 ERB-B2 PDGF-R KIT Overexpression Amplification Overexpression Point Mutation
SCC of the lung, gliomas Breast and ovarian cancers Gliomas Gastrointestinal stromal tumours Proteins involved in Signal Transduction -GTP-binding
29
-Non-receptor tyrosine kinase
-RAS signal transduction -WNT signal transduction H-RAS N-RAS ABL BRAF Β-catenin Point mutation Point mutation Translocation Point mutation Point mutation/ Overexpression
Colon, lung, pancreatic tumours
Bladder and kidney tumours Melanoma, leukaemia, lymphoma CML, ALL Melanomas Hepatoblastomas and HCC Nuclear Regulatory Proteins Transcriptional activators C-MYC N-MYC L-MYC Translocation Amplification Amplification Burkitt lymphoma
Neuroblastoma, small cell carcinoma of lung SCC of the lung Cell-cycle Regulators Cyclins Cyclin-dependent kinase CYCLIN D CYCLIN E CDK4 Translocation Amplification Overexpression Amplification or Point mutation
Mantle cell lymphoma Brest and oesophageal cancers
Breast cancer
Glioblastoma, melanoma sarcoma
-
Tumour suppressor genes
Tumour suppressor genes (Table 2) encode proteins that are:
• receptors for secreted hormones that function to inhibit cell proliferation• negative regulators of cell cycle entry or progression
• negative regulators of growth signalling pathways (e.g. APC or PTEN)
• checkpoint-control proteins that arrest the cell cycle if DNA is damaged or chromosomes are abnormal
• proteins that promote apoptosis DNA repair enzymes.
The transformation of a normal cell to a cancer cell is accompanied by the loss of function of one or more tumour suppressor genes and both gene copies must be defective in order to promote tumour development [2].
30
Table 2: Examples of tumour suppressor genes
Gene Protein function Inherited disease Spontaneous Tumours
APC Negative regulator of the signalling pathway
Adenomatous polyposis coli (APC)
Most colon cancers BRCA1
BRCA2
Components of DNA repair systems
Familial breast and ovarian cancer
Spontaneous breast cancers
CDH1 E-cadherin, a cell adhesion molecule
Hereditary diffuse gastric cancer
Many epithelial cancers CDKN2A INK4a, inhibitor of
cyclin-dependent kinase Cdk4
Some familial melanomas
Some esophageal and pancreatic cancers MEN1 Transcription factor and
protein kinase Multiple endocrine neoplasia Many metastatic cancers NF1 Neurofibromin, Ras-GTPase activation Neurofibromatosis type 1
Some tumours of neural crest origin
PTEN Negative regulator of PI3K
growth signalling pathway Cowden disease
30%-50% of spontaneous cancers RB Repression of transcription factor E2F Retinoblastoma. osteosarcoma Retinoblastoma, sarcomas, several cancers
SMAD4 Signal transducer in TGF-signalling
Juveline polyposis Colon and pancreatic cancers
TP53 Transcription factor;
guardian of the genome Li-Fraumeni syndrome Most frequently mutated in human cancers
TSC1 TSC2
Inhibitor of mTOR Tuberous sclerosis Rare
VHL Ubiquitin ligase Von Hippel-Lindau
disease
Many renal cell carcinomas
WT1 Transcription factor Wilms tumour Some leukaemias
Causes of cancer
Cancer development is based on the accumulation of somatic mutations over lifetime. Environmental carcinogens include chemical mutagens, which modify DNA through a range of mechanisms (alkylation or deamination of DNA bases, intercalation between base pairs and formation of DNA adducts); radiation, which induces DNA double strand breaks and tumour viruses, which can be subdivided in oncogenic viruses, viral oncogenes and slowly transforming viruses. Usually, viruses tend to use one of the following mechanisms to stimulate proliferation of their host cells:
• insertion of a strong promoter in the vicinity of a host cell proto-oncogene • expression of proteins that neutralise host cell tumour suppressor proteins • expression of proteins that prevent or delay apoptosis
31
Characteristics of viral carcinogenesis include:
• Tumour viruses often establish persistent infections in the human host • Host factors are important determinants of virus-induced carcinogenesis
• Viruses are rarely complete carcinogens; they require additional factors to fully activate carcinogenesis.
The complex micro-evolutionary process of carcinogenesis requires the accumulation of a range of genetic mutations. As a consequence, cells acquire new characteristics such as enhanced survival and invasiveness. Three are the main processes involved in carcinogenesis: malignant transformation, invasion and metastasis. An example of the early steps of carcinogenesis can be done studying colorectal cancer: genetic characterisation of a large number of early, intermediate and late adenomas and frank carcinomas led to the establishment of a ‘preferred’ sequence of genetic alterations during the adenoma-adenocarcinoma pathway of colorectal cancer. These include the activation of the K-ras oncogene from its cellular proto-oncogene and the loss for three tumour suppressor genes, where loss of APC (adenomatous polyposis coli) is an early event, whereas loss of p53 is normally a late event.
The spread of cancer cells to distant sites is called metastasis and is the most lethal form of disease. Metastatic cells are less adhesive than normal cells and are able to degrade and penetrate tissue barriers of surrounding connective tissue and the basement membrane of blood vessels. They can invade normal tissues at various sites in the body forming secondary colonies. Usually, the invasion – metastasis cascade involves:
1. Acquisition of local invasiveness
2. Invasion of the cell into blood/ lymph vessels (intravasation) 3. Transport through the blood/lymph vessels to distant tissue sites 4. Escape of the cancer cells from circulation (extravasation) 5. Ability to adapt to the local tissue environment and to proliferate
Cancer can be caused by other different alterations apart from tumour suppressor genes, proto-oncogenes and DNA repair genes. These include alterations of genetic mechanisms like:
• Loss of heterozygosity • Microsatellite instability • DNA hyper or hypomethylation
Furthermore, there are a wide range of rare familial syndromes that predispose affected family members to cancer development (usually based on mutations of tumour suppressor genes).
Cancer hallmarks
The hallmarks of cancer comprise six biological capabilities acquired during the multistep development of human tumours. The hallmarks constitute an organizing principle for rationalizing the complexities of neoplastic disease. They include sustaining proliferative signalling, evading growth suppressors, resisting cell death, enabling replicative immortality, inducing angiogenesis, and activating invasion and metastasis [3].
32
Figure 1: The hallmarks of cancer.
- Sustaining proliferative signalling: cancer cells sustain chronic proliferation deregulating signals which, in normal tissues, carefully control the production and release of growth-promoting signals ensuring homeostasis and the maintenance of normal architecture and function. Cancer cells promote proliferative signalling in many ways: they may produce growth factor ligands themselves, to which they can respond via the expression of cognate receptors, resulting in autocrine proliferative stimulation. Alternatively, cancer cells may send signals to stimulate normal cells within the supporting tumour-associated stroma, which reciprocate by supplying the cancer cells with various growth factors.
- Evading Growth Suppressors: cancer cells must also circumvent powerful programs that negatively regulate cell proliferation; many of these programs depend on the actions of tumour suppressor genes. The two prototypical tumour suppressors encode the RB (retinoblastoma-associated) and TP53 proteins, which operate as central control nodes within two key complementary cellular regulatory circuits that govern the decisions of cells to proliferate or, alternatively, activate senescence and apoptotic programs.
- Resisting Cell Death: Programmed cell death is also known as the phenomenon of apoptosis. DNA damage sensor operates via the TP53 tumour suppressor which then induces apoptosis. Cells with DNA damage die off and the cellular parts reclaimed. Tumours find ways around this apoptosis, most commonly by evolving mutations to the TP53 pathway which inactivates it. There are many similarities between the pathways apoptosis and autophagy — the cellular recycling process of sub cellular parts and organelles. Importantly, autophagy has both good and bad effects as it may potentially delay the onset of cancer, once established, and enhance cancer survival by putting it into a dormant state.
- Enabling replicative mortality: cancer cells are immortal. Normal cells can only replicate a certain number of times before they die. Telomeres protecting the end of chromosomes are crucially important in developing immortality. Regular cells have telomeres that progressively get shorter the more times they divide. Thus, over time, as telomeres
33
shorten, cells get old. Normal cells don’t have it, and immortal cells, including cancer cells, do. This blocks aging (senescence) and apoptosis.
- Inducing angiogenesis: as the cancer grows, it requires blood vessels to bring nutrients into the centre of the tumour and to remove waste products. Without acquiring this ability to grow new blood vessels, tumours would die. This led to the development of a number of drugs that targeted and blocked specific receptors in this pathway.
- Activating Invasion and Metastasis: Tumours can invade other tissues through local invasion or metastatic spread. In local invasion, a tumour may invade the tissue surrounding it. In metastatic spread, the tumour spreads to tissues which are farther away from the original tumour.
Cancer treatment
The course of treatment depends on the type of cancer, its location, and its state of advancement. Surgery, often the first treatment, is used to remove solid tumours. It may be the only treatment necessary for early stage cancers and benign tumours. Radiation kills cancer cells with high-energy rays targeted directly to the tumour. It acts primarily by damaging DNA and preventing its replication; therefore, it preferentially kills cancer cells, which rapidly divide. It also kills some normal cells, particularly those that are dividing. Surgery and radiation treatment are often used together. Chemotherapy drugs are toxic compounds that target rapidly growing cells. Many of these drugs are designed to interfere with the synthesis of precursor molecules needed for DNA replication. Other drugs cause extensive DNA damage, which stops replication. A class of drugs called spindle inhibitors stops cell replication early in mitosis. During mitosis, chromosome separation requires spindle fibres made of microtubules; spindle inhibitors stop the synthesis of microtubules. Because most adult cells don’t divide often, they are less sensitive to these drugs than are cancer cells. Chemotherapy drugs also kill certain adult cells that divide more rapidly, such as those that line the gastrointestinal tract, bone marrow cells, and hair follicles. This causes some of the side effects of chemotherapy, including gastrointestinal distress, low white blood cell count, and hair loss.
Newer therapies block the activity of hormones often required by the cell for growing. For example, some breast cancer cells require estrogen for growth. Drugs that block the binding site for estrogen can slow the growth of these cancers. These drugs are called selective estrogen receptor modulators (SERMs) or anti-estrogens. Tamoxifen and Raloxifene are examples of this type of drug. A ten-year clinical trial of these two drugs with 20,000 women began in 1999 to determine their effectiveness in preventing breast cancer. Similarly, testosterone (an androgen hormone) stimulates some prostate cancer cells. Selective androgen receptor modulators (SARMs) are drugs that block the binding of testosterone to these cancer cells, inhibiting their growth and possibly preventing prostate cancer.
Newer chemotherapeutic drugs target specific, active proteins or processes in cancer cell signal transduction pathways, such as receptors, growth factors, or kinases. Because the targets are cancer-specific proteins, the hope is that these drugs will be much less toxic to normal cells than conventional cancer drugs.
Another promising target for cancer therapy is angiogenesis. Several drugs, including some naturally occurring compounds, have the ability to inhibit angiogenesis. Two compounds in this class are angiostatin and endostatin; both are derived from naturally occurring proteins. These drugs prevent angiogenesis by tumour cells, restricting tumour growth and preventing metastasis. One important advantage of angiogenesis inhibitors is that, because they do not target the cancer cells directly, there is less chance that the cancer cells will develop resistance to the drug. A technique called chemoimmunotherapy attaches chemotherapy drugs to antibodies that are specific for cancer cells. The antibody then delivers the drug directly to cancer cells without harming normal cells, reducing the toxic side effects of chemotherapy. These molecules contain two parts: the cancer-cell-specific antibody and a drug that is toxic once it is taken into the cancer
34
cell. A similar strategy, radioimmunotherapy, couples specific antibodies to radioactive atoms, thereby targeting the deadly radiation specifically to cancer cells.
1.
Brain cancer
Gliomas account for more than 70% of all primary brain tumours, and of these, glioblastoma is the most frequent and malignant histologic type (World Health Organization [WHO] grade IV) [4].
Clinical classification
There are two main types of tumours: malignant or cancerous tumours and benign tumours. Cancerous tumours can be divided into primary tumours that start within the brain, and secondary tumours that have spread from elsewhere, known as brain metastasis tumours.
Glioma occurs in the brain and spinal cord and, more precisely, in glial cells, which surround and help nerve cells. Tumours can be produced by three different types of cells and gliomas are usually classified according to the type of glial cell involved in the tumour. Types of glioma include: - astrocytomas, including astrocytoma, anaplastic strocytoma and glioblastoma,
- ependymomas, including anaplastic ependymoma, myxopapillary ependymoma and subependymoma,
- oligodendrogliomas, including oligodendroglioma, anaplastic oligodendroglioma and anaplastic oligoastrocytoma.
Secondary brain tumours are metastatic and have invaded the brain from cancers originating in other organs. They then circulate through the bloodstream, and are deposited in the brain. There, these cells continue growing and dividing, becoming another invasive neoplasm of the primary cancer's tissue. Secondary tumours of the brain are very common in the terminal phases of patients with an incurable metastasized cancer; the most common types of cancers that bring about secondary tumours of the brain are lung cancer, breast cancer, malignant melanoma, kidney cancer, and colon cancer (in decreasing order of frequency). Secondary brain tumours are more common than primary ones; in the United States there are about 170,000 new cases every year. Secondary brain tumours are the most common cause of tumours in the intracranial cavity. The skull bone structure can also be subject to a neoplasm that by its very nature reduces the volume of the intracranial cavity, and can damage the brain.
Risk factors
The cause of most brain tumours is unknown [4]. Epidemiological studies are required to determine risk factors. Aside from exposure to vinyl chloride or ionizing radiation, there are no known environmental factors associated with brain tumours [5]. Mutations and deletions of so-called tumour suppressor genes, such as P53, are thought to be the cause of some forms of brain tumour [6]. Inherited conditions, such as Von Hippel–Lindau disease, multiple endocrine neoplasia, and neurofibromatosis type 2 carry a high risk for the development of brain tumours [7]. People with celiac disease have a slightly increased risk of developing brain tumours [8]. Although studies have not shown any link between cell phone or mobile phone radiation and the occurrence of brain tumours, the World Health Organization has classified mobile phone radiation on the IARC scale into Group 2B – possibly carcinogenic [9]. Discounting claims that current cell phone usage may cause brain cancer, modern, third-generation (3G) phones emit, on average, about 1% of the energy emitted by the GSM (2G) phones that were in use when epidemiological studies that observed a slight increase in the risk for
35 glioma – a malignant type of brain cancer – among heavy users of wireless and cordless telephones were conducted.
2.
Breast cancer
Breast cancer is the most frequently diagnosed cancer among women in 140 of 184 countries worldwide and remains the most common cause of cancer death (322,600 breast cancer deaths have been averted inUS women through 2015) [10].
Clinical classification
Clinically, breast cancer classification is done on the basis of tumour morphological characteristics into different types and these include infiltrating ductal carcinoma of no special type, and a large number of ‘special types’ such as infiltrating lobular carcinoma, tubular, mucinous, medullary, and adenoid cystic carcinoma. Histological grade, including the degree of cellular differentiation, nuclear pleomorphism, and mitotic count help in further sub-classification of breast tumours. Breast tumours such as smaller size tubular carcinomas are typically associated with earlier stage at presentation, compared with infiltrating ductal carcinomas. It is also noted that breast tumours of high histological grade are generally large at presentation and are associated with local or distant metastasis, compared with tumours of low histological grade. Breast tumours have also been identified into five different subtypes based on the expression of estrogen receptors (ER) and progesterone receptors (PR), and Her2 oncogene. Overall, the ER positive tumours are more common than the ER-negative tumours. Also, the ER positive tumours are smaller and low grade and lymph node negative unlike the ER negative tumours [11]. Thus, there are two ER/PR-positive subgroups, Luminal A and Luminal B, and three ER-negative subgroups. One of the ER negative type is characterized by elevated expression of Her2 and related genes, and thus