The Performance of Seasoned Equity Issues in a
Risk-Adjusted Environment
?
Allen, D.E. 1, and V. Soucik 2
1
Department of Accounting, Finance and Economics, Edith Cowan University, W.A.
2
Erideon Group, Singapore Email: [email protected] Keywords: Seasoned equity issues, risk adjusted performance, long-term.
EXTENDED ABSTRACT
We show that firms issuing seasoned equity possess unique risk characteristics as captured by beta. We use a benchmark to control for this risk and then measure the extent of risk-adjusted under-performance using a longer time-frame than the five-year period used in most studies. We examine the impact of various factors on post-issue performance as well as initial issue underpricing. Why do companies making seasoned equity offerings (SEOs) significantly under-perform in the post-issue period? Loughran and Ritter (1997) suggested transitory over-pricing prior to issue, or agency and information costs, Healy and Palepu (1990) and Masulis and Korwar (1986). Rangan (1997) and Teoh, Welch and Wong (1997) suggested managerial price ramping. Are SEOs poor long-run performers?
Masulis and Korwar (1986) documented significant underperformance of companies issuing new equity, subsequently confirmed by Asquith and Mullins (1986), Mikkleson and Partch (1986) and Schipper and Smith (1986). Loughran and Ritter (1995), extended Healy and Palepu (1990), Ritter (1991) and Loughran, Ritter and Rydqvist’s (1994) work in the area of initial public offerings (IPOs), examining the performance of SEO firms. They observed 15.7% and 33.4% five-year holding period returns for IPOs and SEOs when the returns on non-issuing firms matched by capitalisation were 66.4% and 92.8%. Loughran and Ritter (1995) concluded “an investor would have had to invest 44 percent more money in the issuers than in non-issuers of the same size to have the same wealth five years after the offering date”. Loughran and Ritter (1997) suggest possible “windows of opportunity”, periods during which firms are significantly overvalued providing an opportunity to augment “financial slack”. Allen and Soucik (1999) suggest the conclusion of long-run underperformance is dependent on the definition of the ‘long-run’.
1. INTRODUCTION
Allen and Soucik (1999) reported a significant relationship between a companies’ beta and the extent of post-issue underperformance. This paper investigates this relationship and reassesses factors affecting post-issue performance whilst controlling for risk.
We find that issuers’ excess returns are consistent with previous studies – SEOs under-perform significantly following the offering, reverse their performances around the fourth year to actually outperform non-issuers temporarily but this translates into cumulated under-performance over the medium as well as long term.
The remainder of this paper is structured into four sections. We review our research objectives in section 2 and describe the methodology and data sources used in section 3. Our results follow in section 4, whilst section 5 concludes.
2. RESEARCH OBJECTIVES
We control for the effect of risk in SEO performance measures and re-examine whether the issuers in our sample actually do under-perform with respect to a non-issuer benchmark that specifically controls for company betas. We adopt:
Hypothesis 1: Firms issuing seasoned equity do not under-perform relative to corresponding non-issuers.
Hypothesis 2a: SEO firms do not crossover from
a period of under-performance to a period of over-performance relative to non-issuers.
Hypothesis 2b: SEO firms do not under-perform
non-issuers, in aggregate, over the extended long-run.
When pairing issuers with non-issuing firms we examine firms’ age, market capitalisation, year of issue and the annual volume of SEO issues. We regress the performance results on the company beta itself to confirm the effectiveness of our adjustment for this factor.
Hypothesis 3a: The extent of beta-adjusted SEO
underperformance is not a function of age.
Hypothesis 3b: The extent of beta-adjusted SEO
underperformance is not a function of beta.
Hypothesis 3c: The extent of beta-adjusted SEO
underperformance is not a function of market capitalisation.
Hypothesis 3d: The extent of beta-adjusted SEO
underperformance is not a function of the chronological attribute of the issue.
Hypothesis 3e: The extent of beta-adjusted SEO
underperformance is not a function of volume of seasoned equity offerings in the year of issue.
We examine the relationship between the opening return and the subsequent risk-adjusted under-performance.
Hypothesis 4a: SEO firms do not record
significant opening returns.
Hypothesis 4b: The extent of SEO underperformance is not a function of the size of initial returns.
3. RESEARCH METHOD 3.1. Data
The raw sample consists of 137 seasoned equity offerings made between January 1984 and October 1993; permitting at least five years of price data for each SEO company in the sample (leading up to 1998). The SEOs must meet the following criteria: (1) the company is listed on the Australian Stock Exchange and recorded in the DataStream Database at the time of the issue, (2) the offer must be a cash offer for common stock, (3) the book value of assets at the end of the fiscal year of issuing must be at least $5 million in 1990 purchasing power and (4) the company undertaking the SEO is not a financial company or a regulated utility. In the five year we remove all issues by the same company made within five years after the SEO to avoid a period overlap bias. This causes a deletion of 35 SEOs from the sample, leaving a total of 102 issues made by 94 companies.
To analyse long run performance we extend the time frame back to October 1986 instead of 1993 to allow for at least 12 years of data. This reduced the sample to 26 SEOs. Some 5 of these companies had multiple issues leaving a sample of 21 firms.
Data was taken from the DataStream Database and crosschecked with the Securities Data Company (SDC) database. The date of incorporation and the date of listing were obtained from the 1998 Australian Stock Exchange Yearbook and the 1998 Australian Stock Exchange Investor Handbook.
3.2. Method
Choice of Performance Benchmarks
At first, a benchmark was established against which the SEO performance would be measured. 1. In the middle of each issue year (defined as 30
June), all common stocks listed on the ASX that have not made an issue in the last five years are ranked according to their market beta.
2. Next, for each issuing firm in the sample a non-issuer is selected from the list that has beta closest to the issuer. If the sample firm has already the largest capitalisation, then a match with next highest market value is selected. This then becomes a beta-and-size matched non-issuer benchmark.
3. If the non-issuer becomes delisted before the end date for the corresponding issuer, a second (and if necessary third, fourth, etc.) matching firm is spliced in after the delisting date of the first matching firm.
3.3. Time series methods
Time Definitions
We define each year as consisting of 12 months, each month comprising 21 trading days.
Initial (or opening) return is calculated over the first trading day on which the seasoned equity was issued. Post-issue returns are computed during the period following the offer date, ie excluding the first day. Three separate time frames are defined: i. Short term – Defined as 3 years following
the offer date.
ii. Medium term – Defined as 5 years following the offer date.
iii. Long term – Defined as 12 years following the offer date. A twelve year period was chosen so as to be long enough for many of SEO’s R&D and Capital Projects to come to fruition thereby permitting testing of Hypotheses 2a and 2b.
Performance Measurement
We use Cumulative Abnormal Returns (CAR) method to measure the performance of firms issuing seasoned equity. Raw daily returns for issuers and non-issuers are first calculated as
1
1 , , ,=
−
− t ISS t ISS t ISSP
P
r
1
1 , , ,=
−
− t BM t BM t BMP
P
r
where PISS,t = closing price of the SEO
firm on day t
PBM,t = closing price of the benchmark non-issuing
firm on day t
The abnormal return is then calculated as the raw return from the issuing firm minus the return on the corresponding non-issuer. Hence
t BM t ISS t i
r
r
ar
,=
,−
,Where rISS,t = Raw return for SEO on
day t
rBM,t = Raw return for non-issuer
benchmark firm on day t
The average abnormal return for the day t across all SEOs is calculated as the equally weighted arithmetic average of the individual abnormal returns:
∑
=⎟
⎠
⎞
⎜
⎝
⎛
=
n i t i tar
n
AR
1 ,1
where n = number of SEOs in the sample The CAR from the first day after the offering until day t is calculated as the sum of the daily average abnormal returns until t. Hence
∑
==
t d d tAR
CAR
1To test for the significance of the resulting cumulative abnormal return we use a modified t-statistic that also accounts for the autocovariance that may exist in the time series:
cov
)
1
(
2
var
)
(
⋅
−
⋅
+
⋅
⋅
=
t
t
n
CAR
CAR
t
t twhere var = average cross-sectional variance over the measurement period
cov = first-order autocovariance of the ARt series
We also use holding-period return as an alternative measure of returns:
1
)
1
(
, : ,⎥
−
⎦
⎤
⎢
⎣
⎡
+
=
∏
= b a t t i b a iR
HPR
where Ri,t = Raw return of firm i on day t
a = Beginning of the holding period
b = End of the holding period
The above formula will be used to measure “the total returns from a buy and hold strategy in which a stock is purchased at the first closing market price after listing” (a=1) and held for the subsequent short-term (b=3×252=756), medium term (b=5×252=1260) and long term (b=12×252=3024) period.
3.4. Cross-sectional methods
In the ‘cross-sectional analysis’ stage of our study we regress the returns of SEOs (dependent variable) on a number of controlling factors (independent variables): i i i i i
CAR
=
α
+
β
Ω
+
ε
(univariate) i i n i n i i i i i iCAR
=
α
+
β
1,Ω
1,+
β
2,Ω
2,+
...
+
β
,Ω
,+
ε
(multivariate)where CARi = Cumulative abnormal return of
SEO i for a five year period
Ωi = Control variable whose effect on
SEO performance is being measured αi, βi = Regression coefficients
εi = Regression error terms
i. Age (2 variables)
INAGE: Number of years from the time of SEO firm’s incorporation in Australia.
PUBAGE: Number of years from the time of SEO firm’s listing on an organised stock exchange in Australia.
ii. Company Beta (1 variable) BETA iii. Market Capitalisation (1 variable)
EQUITY calculated market value of the firm expressed in 1990 dollars:
)
ln(
MV
adjEQUITY
=
iv. Year of Issue (1 variable) ISSYR: the year in which each issue is made.
v. Volume of SEOs in the issue year (2 variables) ) 1 ln( TOT TOTVOL= +Ψ ) 1 ln( SAMP SAMPVOL= +Ψ
The final element is to investigate the impact of initial underpricing on the subsequent performance of the issuer. The initial underpricing will be defined as
R
i=
ℜ
i−
R
AOI, with raw return (ℜi)
estimated using four methods:
CORERT: Calculates how deeply was each new share in the offer discounted with respect to the closing price on the day of the issue.
1
0⎟
−
⎠
⎞
⎜
⎝
⎛
=
IP
P
CORERT
where P0 = Closing price on the day of the
issue (t=0)
IP = Subscription price for each new share in the SEO
ABSRT: Compares the closing price at the offer date with the closing price on the day just prior to the issue.
1
1 0−
⎟⎟
⎠
⎞
⎜⎜
⎝
⎛
=
−P
P
ABSRT
DILRT: takes into account the proportion of new equity issued with respect to the equity in place prior to the offer.
1 ) 1 ( 0 − ⎟⎟ ⎠ ⎞ ⎜⎜ ⎝ ⎛ + × × + = IP P P DILRT o η η
where η = Ratio at which new equity is issued.
TOTRT: A holding period return for an investor who acquires the necessary number of shares (η) on the last day before the SEO, exercises the right to buy the extra equity, and sells it at the close of the day of the issue.
1 ) 1 ( 1 0 − ⎟⎟ ⎠ ⎞ ⎜⎜ ⎝ ⎛ + × × + = − IP P P TOTRT η η
Each of the market-adjusted definitions of the initial returns will be regressed on the three – year and five – year CARs of the issuers.
4. RESULTS
4.1. UNIQUENESS OF BETA
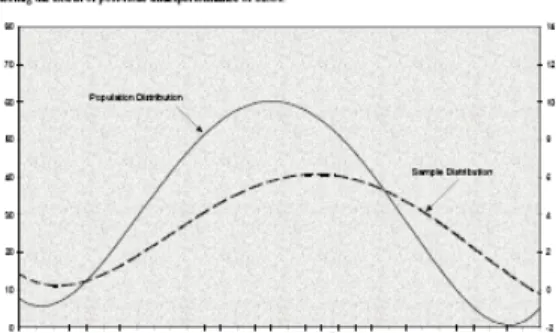
We examined whether the beta-characteristics of SEO firms are unique relative to non-issuing firms. The betas of our SEO are compared with the 1,106 firms listed on the ASX for which DataStream currently computes company betas. See the beta histogram in Figure I.
Figure II shows that while the population distribution approximates normality, our sample distribution is skewed to the right and exhibits positive kurtosis. There are differences in risk between issuers and non-issuers.
4.2. TIME SERIES PATTERNS using RISK-adjusted benchmark
The cumulative abnormal returns of SEOs observed using the beta-and-size matched benchmark are summarised in TableI Part A, and graphically presented in Figure III Panel A. We also include time-series results from Allen and Soucik (1999) where no explicit adjustment for beta has been made, presented as Panel B in Table I and Figure III. The benchmarks used to form these unadjusted results are based on returns from size-only matched non-issuers and industry-and-size matched non-issuers drawn from the same sample. The underperformance is more profound when beta is controlled for.
Five years following an issue the cumulative CARs for size-matched and industry-and-size matched benchmarks stood at -15.03% (-0.95) and 39.46% (2.28), respectively, compared to the -124.44% (-5.06) CAR for the beta-adjusted benchmark. The beta-adjusted CAR is dramatic during the first three years, showing -93.61% (-4.91), and then reduces in years four and five. The results reject Hypothesis 1 – firms that issue seasoned equity do under-perform non-issuers, especially when risk is accounted for. The underperformance is very marked in the first three years, plateaus in years four and five and then downturns again in the eighth year. However, unlike the performance observed with size and industry adjusted benchmarks, years six and seven did not record as significant an over-performance, and the downturn following year eight persisted longer (until year ten) before the turnaround finally emerged. Consequently, this leads to a much more economically significant aggregate cumulative abnormal return of -140.03% (-2.28), although statistical significance at a 5% level is comparable to the other benchmarks. Hypothesis 2a cannot be
rejected given SEO firms do not cross over from a period of underperformance to a period of over-performance. We rejection Hypothesis 2b – SEO firms do under-perform non-issuers, over the extended long run. Allen and Soucik (1999) suggest that the long-run underperformance of SEOs was dependent on the definition of the ‘long-run’. We retest the performance in the
extended long run period, using the beta-adjusted benchmark. The results are summarised in Part A of Table II and Figure V, each accompanied by Part B which highlights the findings for other matched benchmarks. Hypothesis 2a cannot be rejected as SEO firms do not cross over from a period of under-performance to a period of over-performance.
We also reject Hypothesis 2b –period SEO firms do under-perform non-issuers, in aggregate, over the extended long run.
4.3. Cross-Sectional Analysis using Beta-adjusted benchmark
As a first step in the cross-sectional part of our analysis we regressed the five-year beta-adjusted CARs against the seven control variables previously defined; see results in Table III. None of these variables are statistically insignificant. We then examined the opening gains for investors in the issuing companies, based on the four initial-return definitions; see Table IV, all are highly significant. underpricing has an impact on the extent of post-issue underperformance independent of the risk differential between issuers and non-issuers The results fail to reject Hypotheses 3a, 3c, 3d and 3e – the extent of underperformance does not appear to be related to the issuer’s age, market capitalisation, year of issue or the volume of SEOs in the year of issue. We fail to reject Hypothesis 3b
(that the relative performance is unrelated to beta)
Hypothesis 4a is also rejected by the results, highlighting the significant opening returns recorded by issuing firms. Finally, we reject
Hypothesis 4b; the extent of underperformance is related to the opening return.
5. CONCLUSION
Our results are consistent with previous studies. Issuers initially under-perform, but then turn around and actually outperform non-issuers on an annual basis. This might be attributed to the maturation of capital and R&D projects that issuers have taken up at a more rapid than non-issuers following an SEO (Loughran and Ritter, 1997). As competitors catch up the advantage is
eroded, and SEOs have an aggregate loss in the medium (5 year) as well as long (12 years) term.
6. REFERENCES
Allen D.E., and Soucik, 1999, Long Run Underperformance of Seasoned Equity Offerings: Fact or an Illusion?, Working Paper, School of Accounting, Finance and Economics, Edith Cowan University. Asquith P. and Mullins D., 1986, Equity Issues
and Offering Dilution, Journal of Financial Economics, 61-89
ASX, The Australian Stock Exchange Yearbook 1998, Australian Stock Exchange, Sydney, 1998
ASX, The Australian Stock Exchange Investor Handbook, Australian Stock Exchange, 1998 Ed., Brisbane, 1997
Healy P.M. and Palepu K.G., 1990, Earnings and Risk Changes Surrounding Primary Stock Offers, Journal of Accounting Research, Loughran T., Ritter J.R. and Rydqvist K., 1994,
Initial Public Offerings: International Insights, Pacific-Basin Finance Journal, 165-199
Loughran T. and Ritter J.R., 1995, The New Issues Puzzle, Journal of Finance, 23-51
Loughran T. and Ritter J.R., 1997, The Operating Performance of Firms conducting Seasoned Equity Offerings, Journal of Finance, December:1823-1850
Masulis R. and Korwar A., 1986, Seasoned Equity Offerings: An empirical investigation, Journal of Financial Economics, 91-118 Mikkleson W. and Partch M., 1986, Valuation
Effects of Security Offerings and the Issuance process, Journal of Financial Economics, 31-60
Rangan S., 1997, Earnings Management and the Performance of Seasoned Equity Offerings, Journal of Financial Economics.
Ritter J.R., 1991, The long-run performance of initial public offerings, Journal of Finance, 3-27
Teoh S.H., Welch I. and Wong T.J., 1997, Earnings Management and the underperformance of Seasoned Equity Offerings, Journal of Financial Economics. Schipper K. and Smith A., 1986, Comparison of
Equity Caveats and Seasoned Equity Offerings: Share Price Effects and Corporate Restructuring, Journal of Financial Economics, 153-186
Spiess D.K. and Affleck-Graves J., 1995, Underperformance in long-run stock returns following seasoned equity offerings, Journal of Financial Economics, 243-267 Welch I., 1989, Seasoned offerings, imitation
costs, and the underpricing of initial public offerings, Journal of Finance, 421-449