Centralized Trading, Transparency and Interest Rate
Swap Market Liquidity: Evidence from the
Implementation of the Dodd-Frank Act
Evangelos Benos
∗1, Richard Payne
∗2, and Michalis Vasios
∗†11
Bank of England
2
Cass Business School, City, University of London
July 30, 2018
Abstract
We use proprietary transaction data on interest rate swaps to assess the effects of cen-tralized trading, as mandated by Dodd-Frank, on market quality. Contracts with the most extensive centralized trading see liquidity metrics improve by between 12% and 19% relative to those of a control group. This is driven by a clear increase in competi-tion between dealers, particularly in US markets. Addicompeti-tionally, centralized trading has caused inter-dealer trading in EUR swap markets to migrate from the US to Europe. This is consistent with swap dealers attempting to avoid being captured by the trade mandate in order to maintain market power.
Keywords: Interest Rate Swaps; Pre-trade Transparency; Market Power; Liquidity; Swap Execution Facilities
JEL Classification: G10, G12, G14.
∗We are grateful to Darrell Duffie, Chester Spatt, Angelo Ranaldo, David Bailey, Paul Bedford, Jean-Edouard Colliard, Pedro Gurrola-Perez, Wenqian Huang, Rhiannon Sowerbutts, Esen Onur, Peter Van Tassel, and seminar participants at the Bank of England, the Bank of Greece, the Bank of Lithuania, the US Commodity Futures Trading Commission (CFTC), the US Securities and Exchange Commission (SEC), the European Securities and Markets Authority (ESMA), the European Systemic Risk Board (ESRB), the Federal Reserve Board, the UK Financial Conduct Authority (FCA), the 12th Annual Central Bank conference on the Microstructure of Financial Markets, the 2016 European Finance Association meeting, the 2017 American Finance Association meeting, the 2017 conference on OTC derivatives at the New York Fed, the 2017 Mid-West Finance Association meetings, the Brunel University, the University of Belfast, the University of Gothenburg, the University of St. Gallen and the University of Southampton for helpful comments and suggestions. The views expressed in this paper are those of the authors and not necessarily those of the Bank of England.
1
Introduction
A key regulatory response to the 2008 Global Financial Crisis has been to improve the resilience and transparency of Over The Counter (OTC) markets for derivative contracts. To this end, over the last decade these markets have seen the introduction of clearing and margining and also increases in pre- and post-trade transparency, via centralized trading requirements and the creation of repositories containing information on completed trades.
This study focusses on a particular aspect of this regulatory change, an increase in pre-trade transparency in OTC markets, and we investigate how this has affected the competitive structure and liquidity of interest rate swap (IRS) markets. The global swap market is by far
the largest OTC derivatives market1, and this is the first study of the impact of post-crisis
regulation on that market. Historically, global swap trading was decentralized and relatively opaque. However, a centralized trading requirement was introduced in the US in 2014 via
the “Dodd-Frank Act”, which required that any trade in a sufficiently liquid IRS contract
involving a US counter-party musttake place on a Swap Execution Facility (SEF). SEFs are
multi-lateral trading venues, featuring open limit order book (LOB) and request for quote (RFQ) functionalities, allowing customers to solicit quotes from multiple dealers and/or an order book simultaneously. Thus, SEFs introduced pre-trade transparency to a previously dark market and reduced customers’ costs of searching for liquidity.
We show that the introduction of SEF trading had several important effects on IRS markets. First, the evidence in our paper points to improvements in liquidity for swaps that were subject to the SEF trading mandate. Relative to EUR mandated swaps (where SEF trading is much less prevalent), all liquidity metrics for USD mandated swaps improve significantly. For example, price dispersion (used here as measure of liquidity) drops by
12% - 19%, which translates to daily execution costs for end-investors in USD mandated
swaps falling by about $3 - $6 million relative to those in EUR mandated swaps. When comparing mandated with non-mandated USD swaps, the results are slightly weaker with
the relative improvement between these two groups being significant for most but not all liquidity metrics. However, given that liquidity improves overall for all USD contracts (i.e. mandated and non-mandated ones), we argue that this is likely driven by spill-over effects from mandated to non-mandated contracts.
Second, we show that this improvement in liquidity is linked to more intense competition between swap dealers. Following the introduction of the SEF trading mandate, the number of active swap traders rose and we show that active US clients (i.e. those clients most strongly affected by the regulation) traded with a significantly larger number of dealers after the trade mandate.
Finally, we show that the introduction of centralized trading in the US led to the global EUR swap market fragmenting geographically, as the percentage of average daily trading volume between US and non-US domiciled dealers in EUR swaps declined abruptly from 20% to 5%. This decline in trans-Atlantic volume for EUR contracts was entirely driven by swap dealers with trading desks in multiple locations shifting the bulk of their inter-dealer
activity to their non-US (primarily European) branches.2 This is consistent with EUR
swap dealers trying to retain market power by blocking access to the inter-dealer market to potential entrants. This is because, by transferring activity outside of the scope of US rules and avoiding SEF trading, dealers retain the ability to exclude specific counter-parties, something that is not possible (or easy) under the trade mandate. No similar pattern exists
for trades between dealers and clients or trades in USD swaps.3
Our analysis uses proprietary data from the London Clearing House (LCH), supplemented with public data from the Depository Trust & Clearing Corporation (DTCC), for the period between January 2013 and September 2014. SEF trading was introduced to the US in October 2013 and SEF trading became mandatory for a set of contracts in February 2014. Thus, our data cover the trading activity in the Global IRS market for a reasonable period 2For related press coverage, see also ‘Big US banks make swaps a foreign affair’ in the Wall St Journal
(http://www.wsj.com/articles/SB10001424052702304788404579520302570888332).
3The USD market is dominated by US persons who are subject to the trade mandate and as such, migrating its entire inter-dealer segment outside the US would likely be impractical.
before and after the regulatory change. Both data sources contain standard information on swap transactions. The LCH data additionally contain counterparty information from which we can infer traders’ geographic locations and whether a trader is a dealer or a client. The DTCC data on the other hand indicate whether a trade was executed on a SEF.
We estimate a difference-in-differences model to isolate the effects of the introduction of SEF trading on liquidity, activity and competition. The treatment group in our analysis is the set of USD swaps that were required to trade on a SEF after February 2014. Our control group is either the EUR swaps that were mandated, but which are mostly traded by non-US persons who are not captured by the SEF trading requirement, or the USD swaps that were not captured by the SEF trading mandate. We measure liquidity using various price dispersion measures based on the metric proposed by Jankowitsch et al. (2011), plus Amihud’s price impact measure (Amihud (2002)) and a bid-ask spread derived from swap quote data.
This difference-in-difference setup is not without issues. First, the allocation of swaps to the treatment group is not exogenous. SEFs determine which swaps to trade and do so on the basis of liquidity. Second, the control groups have some limitations. For example, if SEF trading affects the liquidity of a mandated USD swap there may be spill-overs to non-mandated USD swaps that are nearby on the maturity curve. We discuss these issues further in Section 4.2 and argue that they are unlikely to overturn our main results.
To place our analysis within the context of recent theory work on transparency, our result that centralized trading has improved liquidity and increased dealer competition for mandated swaps lends support to the research of Duffie et al. (2005) and Yin (2005). These authors argue that pre-trade quote transparency is a necessary condition for competitive liquidity provision and lower transaction costs for customers since it reduces search frictions. Foucault et al. (2013) argue that in the presence of positive search costs, a unique Nash equilibrium exists where dealers quote monopolist prices i.e. prices that equal end-users’
reservation values. Thus, reducing search costs allows customers to access keener pricing.4
Hendershott and Madhavan (2015) examine how electronic venues may facilitate trading in OTC markets. They show that periodic one-sided electronic auctions, similar to the RFQ mechanism we see on SEFs, encourage dealer competition and result in better prices while limiting information leakage. Our results run counter to the intuition in de Frutos and Manzano (2002) and Foucault et al. (2007). The former argue that risk-averse dealers price less keenly in transparent markets, since, to induce trades that correct an inventory imbalance, they only need to marginally improve the quote on the relevant side of the market relative to their competitors. Foucault et al. (2007) show that when informed trading intensities are low, lower transparency (in the form of hiding trader identity information) can lead to higher liquidity.
Empirical work on the link between transparency and liquidity contains mixed results. Boehmer et al. (2005) show that liqudity of NYSE stocks increased significantly when the exchange began to publish the limit order book to traders not located on the exchange floor. Green et al. (2007) study municipal bond dealers. They argue that opacity in this market increases dealer market power and they show how market power increases execution costs. Goldstein et al. (2007), Edwards et al. (2007) and Bessembinder et al. (2006) show that introducing post-trade transparency to US corporate bond markets had, on balance, a positive effect on liquidity (with exceptions for thinly-traded bonds and for the largest
trades).5. In contrast, Foucault et al. (2007) show that imposing anonymity on trading
activity, i.e. reducing transparency, increased liquidity in Euronext stock trading. Friederich and Payne (2014) find the same result in data from the London Stock Exchange, attributing it to the possibility of predatory trading under transparency (i.e. when identities are revealed).
Our results chime with those that suggest a positive link between transparency and liquidity.6
4Vayanos and Wang (2012) survey the literature and explain how illiquidity is related to various market imperfections. They show that participation costs, imperfect competition and search frictions all have a detrimental effect on liquidity.
5Other evidence that links transparency with liquidity can also found in Harris and Piwowar (2006), Naik et al. (1999) and Boehmer et al. (2005).
Our work is also related to other recent studies focusing on regulatory developments
in OTC derivative markets.7 Loon and Zhong (2014) and Loon and Zhong (2015) study
the effects of centralized clearing and post-trade reporting on CDS markets. Both of these reforms, mandated by Dodd-Frank, are shown to improve liquidity, while the former also reduces credit risk. Our focus is different, in that we study the impact of pre-trade trans-parency as related to the third pillar of the Dodd-Frank OTC derivatives regulation (i.e. the mandate for centralized trading) and we also examine the IRS market, which is much larger than the CDS market. It is worth noting that Loon and Zhong (2015) include a SEF dummy variable in their panel regressions but as their sample period ends before the introduction of the CFTC trading mandate in February 2014 they cannot say anything about the impact of the centralized trading requirement on liquidity.
Our result that EUR swap markets have fragmented due to the US SEF trading mandate ties into a recent regulatory literature on the efficacy and impact of the reform (see Giancarlo (2015), Massad (2016), Powell (2016)). The result suggests that there are costs, pecuniary or otherwise, to trading on SEFs that dealers wish to avoid. As mentioned earlier, one possibility is that dealers move activity from their US desks to their European desks in order to retain control over who they deal with. This could allow them to exclude new entrants from the inter-dealer EUR swap market which, in turn, would preclude those new entrants
from trading effectively in the client market.8 Thus, the geographic fragmentation we observe
is consistent with dealers attempting to maintain entry barriers to (EUR) swap trading. Overall, our analysis highlights the importance of dealer market power in understanding how financial markets react to changes in transparency. This remains an area of policy interest. In January 2018 Europe adopted new centralized trading rules for swaps as part of the Markets in Financial Instruments Regulation (MiFIR). This has the potential to improve conditions for customers and also to remove the imbalance in regulation that has led to the 7See Spatt (2017) and Acharya et al. (2009) for an overview of the post-crisis derivatives reform agenda 8This would not be feasible for USD swaps as the inter-dealer market is well established, geographically, in the US, while the bulk of EUR swap trading already happens in Europe.
geographical fracture in swaps markets. At the same time, in the US, there is uncertainty as to whether all parts of the Dodd-Frank Act will be retained as law with the new CFTC
trading rules being at the heart of this discussion among policy makers and practitioners.9
2
Policy Context and Institutional Details
2.1
OTC derivatives and the Dodd-Frank Act
A major pillar of the US Wall Street Reform and Consumer Protection Act (the “Dodd-Frank Act”) concerns OTC derivatives markets. Owing to concerns that insufficient collateraliza-tion and opacity in these markets contributed to systemic risk during the crisis, the Act implemented reforms aimed at reducing counterparty risk and improving transparency in swaps markets. It mandates centralized clearing for eligible contracts, requires real-time reporting and public dissemination of transactions and also requires that eligible contracts should be traded on a SEF, a type of multilateral electronic trading venue. SEF trading
markedly increases the level of pre-trade transparency for affected swap contracts.
The CFTC implemented the Dodd-Frank trading mandate in two phases. First, on October 2, 2013, SEF trading became available for OTC derivatives on a voluntary basis. As of that date, newly authorized trading venues had to comply with a number of principles and requirements. A principal one of these requirements was the obligation to operate a
limit order book (LOB).10 Subsequently, specific contracts were explicitly required to be
executed on SEFs. The mandate captured swap (IRS) contracts of various currencies and maturities as well as several credit default swap (CDS) indices. The decision as to which
9See, for example, related reporting by Bloomberg:
https://www.bloomberg.com/gadfly/articles/ 2017-02-23/wall-street-girds-for-regulatory-battles-loud-and-quiet
10This does not mean that there were no electronic venues for swap trading before October 2, 2013. It means that after this date, any venue that was officially recognized as a SEF had to comply with the specific CFTC minimum requirements mentioned above. Unfortunately, we have no data on the swap executions prior to October 2, 2103. Nevertheless, if swaps were already being traded on pre-trade transparent electronic platforms before this date, this should bias us against finding any differences in market conditions when making a “before versus after” comparison. Our analysis shows that the differences were actually substantial.
swaps were to be SEF-traded was in the hands of the SEFs themselves, through the Made Available to Trade (MAT) procedure. A SEF can submit a determination that a swap is available for trade to the CFTC, which then reviews the submission. Once a swap is certified as available to trade, all other SEFs that offer this swap for trading must do so in accordance with the requirements of the trade mandate. The criteria for MAT determination include the trading volume of the swap and the frequency of transactions. Table 1 shows the mandated maturities along with the mandate date for the plain vanilla USD- and EUR-denominated IRS contracts which we study. Most maturities were mandated on February 15 2014 with a couple more following a few days later on the 26th.
The SEF trading mandate only captures “US persons”, with that definition being
rela-tively broad.11 Importantly, the mandate affects the trades of US persons regardless of who
their counterparty is. In other words, if a US person is to trade a mandated contract with a non-US person, the trade has to be executed on a SEF.
2.2
Swap Execution Facility (SEF) Characteristics
SEFs are electronic trading platforms where, according to the CFTC, “multiple participants have the ability to execute swaps by accepting bids and offers made by multiple participants in the platform”. In practice, SEFs accomplish this using two different trading mechanisms. The first is a standard central limit order book.All SEFs must offer an order book and, theoretically, this functionality allows end-users to bypass dealers altogether in concluding a trade, assuming of course that the order book has sufficient liquidity.
The second functionality is a request-for-quote (RFQ) mechanism. While this operates similarly to pre-existing single-dealer RFQ platforms, the innovation is that a client’s request for a quote must be disseminated simultaneously and instantly to multiple dealers instead 11Apart from US-registered swap dealers and major participants, the definition of a US person also includes foreign entities that carry guarantees from a US person (e.g. the foreign branch of a US dealer) and also any entities with personnel on US soil which is substantially involved in arranging, negotiating or executing a transaction. According to market reports this created initially some uncer-tainty as to who is captured. See for example: http://www.risk.net/risk-magazine/news/2256600/ broader-us-person-definition-could-cause-clearing-avalanche-participants-warn
of just one. Thus, clients can easily compare prices across dealers and competition between dealers for client order flow intensifies. Until October 2014, the law required that a RFQ be communicated to at least two dealers and, subsequently, to no less than three. Having
received a RFQ, dealers respond by posting their quotes to the client.12 Importantly, dealers
cannot see each others’ quotes nor do they know which other dealers have received the re-quest. In addition, those responding to the RFQ cannot be affiliated with the RFQ requester and may not be affiliated with each other. This arrangement makes collusion between dealers difficult and effectively renders the bidding process a first-price, sealed bid auction.
The two trading functionalities are designed to operate in conjunction for mandated
swaps.13 Practically, a SEF must provide a RFQ requester with any resting bid or offer on
the order book alongside any quotes received by the dealers from whom quotes have been requested. The requester has the discretion to execute either against the LOB quotes or
against the RFQ responses.14 After a LOB or RFQ trade, the SEF can establish a short
work-up session open to all market participants. During the work-up, market participants can trade an additional quantity of the same swap at the same price as the initial trade,
with first priority in execution given to counterparties who initiated the first trade.15
Many SEFs trade the swaps that we study. Data from the London Clearing House for April to September 2014 show that for USD swaps the most active SEFs were Tradeweb (with a market share of 20.6%), ICAP (19.8%), Tullet Prebon (17.2%) and Bloomberg (15%). Total USD trading activity for this period was $4,770bn. ICAP had the largest market share in EUR trading (at 34.8%), followed by BGC Partners (25.0%), Tullet Prebon
(15.0%) and Tradeweb (10.6%). Total trading volume in the EUR contracts was e4,444bn.
12It is worth noting that, due to concerns about information leakage of future trading intentions, the CFTC did not require that the identity of the RFQ requester be disclosed. See Foucault et al. (2007) and Nolte et al. (2015) for a discussion on the implications of the disclosure of counterparty identities.
13Any trades of swap contracts that are not subject to the mandate can still be executed on a SEF and the SEF must offer an order book. However, the SEF is also free to offer any other method of execution (including bilateral trading and voice-based systems) for these trades.
14Collin-Dufresne et al. (2016) analyze SEF trading of index CDS and show that most dealer-to-customer trades are done via RFQ, while inter-dealer trades use several different execution mechanisms.
In both cases, no other SEF had a market share above 10%. Thus, some of the most active SEFs are operated by brokers, while others are run by specialist information and trading systems firms. We have no data on the fraction of SEF trading in IRS occurring on order books versus RFQ, but Riggs et al. (2018) show that limit order book usage is limited in SEF trading of index CDS.
Overall, SEFs change the microstructure of the market in two important ways. First, they increase pre-trade transparency by allowing market participants to observe prices quoted by dealers much more easily. Second, SEFs increase competition between swap liquidity suppliers. They make comparison of dealer quotes straightforward, they allow new entrants to start supplying liquidity on LOBs and they allow end-users to trade directly with each other and to bypass dealers completely.
3
Data and Summary Statistics
3.1
Swap Transaction Data
We use transaction data for USD and EUR denominated vanilla spot interest rate swaps, which we obtain from the LCH and the DTCC. LCH clears approximately 50% of the global interest rate swap market and more than 90% of cleared interest rate swaps through its SwapClear platform. Its services are used by all major dealers. We obtain reports of all new trades that were cleared by LCH between January 1, 2013 and September 15, 2014.
Each LCH report contains the trade date, effective date, maturity date, notional, swap rate, and other contract characteristics.It also includes counterparty identities, which allows us to categorize trades by type of counterparty (dealer vs. non-dealer) and location (US, EU etc).As is standard in this market, we classify the top 16 banks by volume in our sample
as dealers, while any other counterparty is classified as a client.16 Since April 2014 LCH
16This choice is not arbitrary as these 16 banks are classified as “Participating Dealers” in the OTC Derivatives Supervisors Group, chaired by the New York Fed: https://www.newyorkfed.org/markets/ otc_derivatives_supervisors_group.html
reports also contain information on whether a transaction is executed on a trading venue, the name of the venue, as well as whether the venue is authorized as a SEF.
We apply a number of filters to clean the data. First, we remove duplicate reports, which arise because one report is generated for each side of a cleared trade. Then we keep only spot starting swaps, while removing portfolio and compression trades as they are not
price-forming.17 Finally, we filter inaccurate and false reports, defined as those where the
percentage difference between the reported swap rate and Bloomberg’s end-of-day rate for the same currency and maturity is more than 5% in absolute value.
Although LCH is the global leader in IRS clearing, there are other clearing houses that offer competing services, e.g. the Chicago Mercantile Exchange (CME). To ensure that our results are representative of the entire market, we complement the LCH data with data from the DTCC, a trade repository (TR) operator. We extract all transactions that were reported to them between January 1, 2013 and September 15, 2014. We filter the DTCC data in a similar way to the LCH data and we remove any trades that were reported to both LCH and DTCC via an algorithm that matches LCH and DTCC reports based on contract characteristics that are common to both data sets.
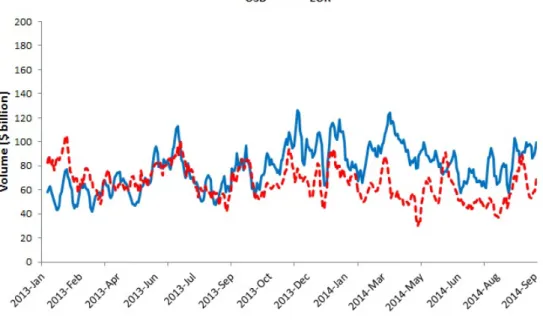
After filtering the data, we are left with a sample of 628,896 trade reports which account for a total $58.17 trillion in notional. In Figure 1 we show the time series of trading volume by currency. This figure illustrates the sheer size of the swap market with volumes around $70-80 billion for each currency on a daily basis. We can also see that total volume is roughly equally split between USD and EUR denominated swaps.
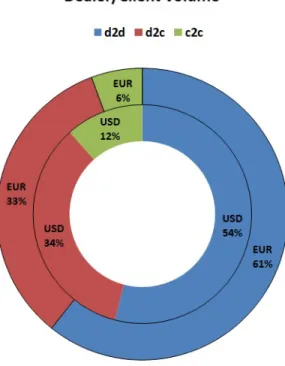
The upper panel in Figure 2 displays volume shares by counterparty type. The majority of trades are inter-dealer, consistent with the commonly held view that a small group of dealers dominates the swap market. Dealer-to-client trades account for about one-third of volume in both currencies. One difference between currencies is that the share of client-to-17Compression trades are used in order to reduce the total notional amounts outstanding of participating institutions, while leaving their net notional amounts unchanged. The purpose of this is to reduce the amount of counterparty risk (which is a function of gross notional) while maintaining the same level of exposure to market risk.
client activity is twice as large for USD-denominated swaps than it is for EUR swaps. With regard to location, we split trading activity into (i) trades between US financial institutions, (ii) trades between US and non-US financial institutions, and (iii) trades between non-US financial institutions. The lower panel in Figure 2 presents these data. About 50% of trading in USD-denominated swaps involves a US and a non-US counterparty, 30% two US counterparties, and 20% two non-US counterparties. For EUR-denominated swaps, US to non-US trading activity is only 14% of the sample, with the vast majority of trades, about 80%, between non-US counterparties. This means that the SEF trading mandate has little bite in EUR swap markets, as they are dominated by non-US counterparties. This observation motivates part of our empirical strategy.
4
SEF Trading and Market Quality
4.1
Liquidity Variables
We measure liquidity with five metrics that are built from transaction data or intra-day bid-ask quotes provided by Thomson Reuters. One limitation of the trade reports is that they are not time-stamped and so we cannot construct metrics that rely on transaction sequencing. Instead, we mainly use metrics that only require executed trades and bid-ask quotes.
Our first three liquidity metrics are based on price dispersion. These measures are esti-mates of the relative effective spread and as such we use them to measure execution costs. The first is that proposed by Jankowitsch et al. (2011):
DispJ N Si,t = v u u t Ni,t X k=1 V lmk,i,t V lmi,t Pk,i,t−mi,t mi,t 2 (1)
where Ni,t is the number of trades executed for contract i on day t, mi,t is Bloomberg’s
is the volume of transactionk andV lmi,t =PkV lmk,i,t is the total volume for contraction
day t. Jankowitsch et al. (2011) derive this measure from a microstructure model where it
is shown to capture inventory and search costs. Low price dispersion around the benchmark indicates low trading costs and high liquidity, and vice versa.
A variant of the Jankowitsch et al. (2011) measure uses the average execution price on a day as the price benchmark instead of the end-of-day midquote. This should improve the performance of the measure on days of high intra-day volatility:
DispV Wi,t = v u u t Ni,t X k=1 V lmk,i,t V lmi,t Pk,i,t−P¯i,t ¯ Pi,t 2 (2)
where notation is as above and ¯Pi,t is the average execution price on contract i and day t.
We require at least four intraday observations to determine the average execution price. As estimates of the effective spread, both of the above dispersion metrics are potentially biased due to day volatility. And while the second dispersion metric reduces the intra-day volatility bias, it does not eliminate it since the same average execution price can be obtained from both extremely volatile and relatively stable intra-day paths for the
mid-quote. Thus, we also employ the spread estimator proposed in Benos and ˇZikeˇs (2018)
which, subject to weak assumptions about prices, is bias-free.18 The estimator is equal to:
DispBZi,t =
q
max{2(3DispEW2
i,t −DispJ N S EWi,t2),0} (3)
where DispEW and DispJ N S EW are given by the formulas for the previous dispersion
metrics but where V lmk,i,t
V lmi,t is replaced by
1
Ni,t. Note that all dispersion metrics are
compa-rable across contracts with different base currencies and maturities as they are percentage deviations from a price benchmark.
Our fourth liquidity measure is the Amihud (2002) price impact measure:
Amihudi,t =
|Ri,t|
V lmi,t
(4)
whereRi,t is the price change for contraction daytandV lmi,t is the total volume expressed
in $ trillions. All of these liquidity measures have been used before in analysis of OTC derivatives markets and are shown to relate strongly to conventional liquidity proxies. See for example the evidence in Goyenko et al. (2009), Friewald et al. (2012), Friewald et al.
(2014), Loon and Zhong (2014), Loon and Zhong (2015) and Benos and ˇZikeˇs (2018).
Finally, we also measure liquidity with the relative quoted spread based on intra-day data obtained from Thomson Reuters. Bid and ask quotes for each contract are sampled every
10 minutes across the trading day and, assumingN intervals in a day, we calculate the daily
average quoted spread for contract i on day t as:
QSpreadi,t = 1 N N X k=1
2(Askk,i,t−Bidk,i,t)
Askk,i,t+Bidk,i,t
(5)
This liquidity measure is included to ensure robustness since it is not dependent on execution prices, which are used for all other liquidity metrics.
4.2
Panel diff-in-diff specifications
To assess the impact of SEF trading on market liquidity and activity, we estimate two panel difference-in-differences models. We wish to see if the introduction of SEF trading for a treatment group of contracts causes their liquidity to diverge from that of a control group. SEFs were officially authorized by the CFTC (and trades could be executed on them on a voluntary basis) on the 2nd of October 2013 and the dates on which it became mandatory for
US persons to trade particular contracts on SEFs are shown in Table 1.19 Table 2 summarizes
the main variables used in our models.
Before presenting the results of our estimations, it is worth noting that a problem with our simple diff-in-diff approach is that the set of contracts mandated for SEF trading is not exogenous. In fact, as detailed in Section 2.1, SEFs themselves determine which contracts they trade through the MAT procedure. Then, if the set of contracts made available to trade are precisely those that are most likely to benefit (in liquidity terms) from SEF trading, any evidence of liquidity improvement that we obtain will be a biased estimate of the true liquidity benefit associated with SEF trading. However, while it is clear that contracts made available for trade by SEFs were already the most liquid, this is not the same as saying that they chose contracts that were most likely to benefit in liquidity terms from SEF trading. Thus, while it worth acknowledging there has been selection on average liquidity in this setting, we suspect that any bias might not be too severe.
Another possible concern with our diff-in-diff framework is that, if SEF trading causes liquidity to rise for mandated swaps, this improvement might spill over to non-mandated swaps. For example, if dealers quote tighter spreads for the mandated 10 year USD swap, this may lead to tighter spreads in the (non-mandated) 9 year USD swap. If anything, though, this should create a bias towards us finding no significant effects and, in addition, it is a problem that should not contaminate the comparison of USD and EUR swaps.
Test 1: USD vs. EUR mandated contracts
For our first diff-in-diff test we use the mandated USD-denominated contracts as a treatment group and mandated EUR-denominated contracts as a control group. The USD segment of the IRS market has a very high proportion of U.S. participants who are captured by the CFTC mandate, while the EUR contracts may be mandated but, as we saw earlier in the 19These event dates are well after the implementation of the trade reporting mandate on December 31, 2012 and the clearing mandate on March 11, 2013. The clearing mandate implementation date occurs during our pre-event sample period, but excluding data prior to this date does not change our results in any important way.
lower panel in Figure 2, are mainly traded by non-US persons who are not required to trade on a SEF. Thus, if transparency improves liquidity, we would expect the liquidity
of USD contracts to improve relative to that of EUR contracts.20 An advantage of using
the mandated EUR contracts as a control group is that the treatment and control groups have similar liquidity profiles, which implies that our results are not subject to the selection bias mentioned above. On the other hand, liquidity and activity in the EUR segment of the market might be driven by different fundamentals. We control for this by including a number of contract and currency specific control variables in our specifications. We implement this test by estimating the following panel specification:
Lit =αi+β1Date (1) t +β2CurriDate (1) t +β3Date (2) t +β4CurriDate (2) t (6) +γSwap RVit+δ0Xt+it
where i indexes the set of swap contracts (defined by maturity and currency) such that the
αi are contract-specific fixed effects and t denotes days. Lit is a liquidity or market activity
variable. The liquidity variables are defined in equations (1) to (5) while our activity variables include daily volume traded, the daily number of trades and the number of unique market
participants active on a day. Date(tj), j = 1,2 are dummies for the SEF authorization and
SEF mandate dates, respectively, equalling one after the event and zero otherwise. Curri
is a dummy equal to one for USD contracts and zero for EUR contracts. Swap RV is the
daily contract-specific realized variance, calculated using 10 minutely quotes from Thomson
Reuters.21 It is included to make sure that our results are not driven by any differences in the
volatility of the EUR- and USD-denominated contracts. Xt is a vector of currency-specific
control variables intended to capture differences in fundamentals between the USD and EUR market segments, including stock market returns, stock index implied volatilities (as 20Of course, to the extent that SEFs are also used by those trading in EUR mandated contacts, albeit to a lower degree, we might expect (small) improvements in their liquidity too.
proxies for market uncertainty), overnight unsecured borrowing rate spreads for both markets (as proxies for dealer funding costs) and yield curve slopes. Our specification explicitly disentangles liquidity/activity in the two currency groups as well as any changes in liquidity
after the two events. The coefficientsβ1 andβ3 capture any effects that are common to both
market segments and coefficients β2 and β4 capture incremental effects that are particular
to the USD segment. We cluster the standard errors by both maturity and currency.
The left-column of plots in Figure 3 displays time-series of cross-swap mean values of our key dependent variables, separately for the EUR MAT and USD MAT samples, in the window prior to the SEF mandate date. These are displayed to shed light on the ‘parallel trends’ assumption that underlies our difference-in-differences analysis. The assumption appears to be a reasonable one for these data as the liquidity variables all evolve in rather similar fashion in the period of time before the SEF trading mandate came into force.
Tables 3 and 4 show the results of these estimations for the liquidity and activity variables respectively. The models are estimated with and without the control variables. Table 3 shows that after SEF trading became available on 2 October 2013 there is an improvement
in liquidity for both market segments as the significantly negative coefficients on Date(1)
and the insignificant interaction terms indicate. The only exception to this is for the quoted spreads, where a small but significant reduction in liquidity for USD contracts can be seen. Following the enforcement of the SEF trading mandate there is a clear differential effect between the USD and EUR segments of the market with the USD contracts showing a significant further liquidity improvement relative to the EUR contracts. This improvement is visible across all liquidity measures, with 11 of the 12 interaction terms being significantly negative at a 5% level and the other coefficient significantly negative at 10%. Also, for USD quoted spreads, the second event date interaction is negative and much larger in magnitude than the positive interaction on the first event date, implying that overall USD quoted spreads fall relative to EUR spreads.
and a respective increase in USD contracts mainly after the first event date, i.e. when SEF trading became available. It is interesting to note that, while activity in EUR mandated contracts declined, liquidity actually improved, as the market became more transparent. We do not observe any significant difference in trading activity between the USD and EUR contracts after the second event (February 2014). Another noteworthy effect is that after both events, the number of parties trading in USD markets rose significantly relative to the number of traders in EUR markets. Thus participation in USD markets grew.
In the activity and liquidity regressions, there are few consistently signed and consistently significant control variables. The realized volatility variable is always positive in the liquidity regressions (and is significant in half of the specifications). The VIX and VDAX are also often positive and significant (except in the quoted spread regressions) in the liquidity regressions. In the activity regressions, the control variables are only occasionally significant.
Test 2: USD mandated vs. USD non-mandated contracts
For the second diff-in-diff test we concentrate exclusively on USD contracts and use the mandated maturities as a treatment group and non-mandated USD swaps as the control
group.22 This test has the advantage of looking at contracts whose prices are driven by the
same fundamentals and also cleanly compares mandated versus non-mandated contracts. We estimate the following panel regression:
Lit =αi+β1Date (1) t +β2M ATiDate (1) t +β3Date (2) t +β4M ATiDate (2) t (7) +γSwap RVit+δ0Xt+it
where nowidenotes maturities andtdenotes days. The αi terms are again contract-specific
fixed effects. The key right-hand side variables used are the same as before with the only
difference being that we now have a dummy variable (M ATi) indicating whether a given
22The mandated maturities are: 2Y, 3Y, 4Y, 5Y, 6Y, 7Y, 10Y, 12Y, 15Y, 20Y and 30Y. The non-mandated maturities are: 1Y, 8Y, 9Y and 25Y.
contract maturity has been mandated by the CFTC.
The right-column of plots in Figure 3 gives our ‘parallel trends’ analysis for the USD MAT versus non-MAT samples. Again, there is evidence that the dispersion measures are neither diverging nor converging across the two samples. For the quoted spread data, there is a small level shift in MAT spreads roughly 4 months before the first event date, which is gradually eroded as we approach the mandate event date. For the Amihud measure, the trend in USD non-MAT contracts is rather noisy although there is no sign of divergence (or convergence) with that of USD MAT contracts. For this reason, we are inclined to place less weight on the difference-in-differences results from this variable.
Tables 5 and 6 show the results of these estimations for the liquidity and activity variables and for specifications with and without controls. There is evidence of liquidity improvement for both mandated and non-mandated contracts after SEF trading became available on 2 October 2013. This is particularly clear in the dispersion metrics, but not for the Amihud measures or the quoted spread data. Focussing on the dispersion-based liquidity measures, after the second event date the liquidity of the mandated contracts tends to increase again while, if anything, that of non-mandated contracts deteriorates slightly. The picture is less clear for quoted spreads and the Amihud measure. On the second event date, the coefficients on the interaction terms for these dependent variables are always negative, but they are not quite significant at conventional levels (with t-statistics between -1.30 and -1.50).
Thus, the broad picture here is of greater liquidity for mandated and non-mandated USD contracts with the increase being significantly greater for the former. It is fair to say, though, that evidence of a liquidity improvement for mandated contracts from these estimations is less strong than that obtained from comparison of USD and EUR mandated contracts. One interpretation of this finding is that the liquidity improvements in the mandated USD con-tracts spilled over to non-mandated USD concon-tracts. This may be because market participants might also have chosen to trade non-mandated contracts on SEFs as soon as the functional-ity became available, and possibly also because, as discussed above, more transparency for
some quoted prices on the USD maturity curve gives market participants a better idea of what a fair quote is for other USD maturities.
As far as activity and participation are concerned, Table 6 shows that, as for the estima-tions using the EUR control sample, there are positive effects occurring in the period after 2 October 2013 but only for the mandated contracts.
Economic Significance of Liquidity Improvement
We next assess the economic significance of the observed liquidity improvements by calculat-ing an implied dollar reduction in execution costs for market end-users. The market value of an IRS is set to zero at initiation by selecting the fixed rate such that the present values of the fixed and floating legs are the same. However, a bid-ask spread charged by a dealer on top of the fixed rate, would affect the value of the swap and thus introduce an additional cost incurred by the end-user. The total dollar value of this cost can in principle be approximated by:
Cost($)≈Spread×P ×m×T rade Size
where Spread is the relative effective spread of a transaction in an IRS contract with a
maturity ofmyears,P is the prevailing swap rate andT rade Sizeis the amount of notional
traded. This formula is just the change in the market value of the fixed leg of a swap when
the swap rate is increased by the (percentage) effective spread. 23
We extend this approach in order to calculate the reduction in execution costs resulting
from the trade mandate. In our case, the relative effective spread is approximated by any of the dispersion measures defined in equations (1)-(3). We base these calculations on Test 1, i.e. the comparison of USD with EUR mandated contracts, because mandated contracts are the most heavily traded segment of the market. Since our difference-in-differences specifications 23The swap rate, P, is multiplied by the percentage spread and then by notional so as to yield a dollar figure. The cost is incurred every year until maturity with each payment of the fixed rate and therefore multiplied bym.Note that we have just summed Dollar costs aross years without discounting which, given the historically low interest rates over our sample period, should not change the result very much.
in (6) are estimated on a daily basis, we approximate the daily dollarincremental reduction in execution costs for USD mandated contracts relative to EUR mandated contracts by:
∆Cost(USD MAT vs EUR MAT)≈( ˆβ2 + ˆβ4)×P¯×M aturity×V lm×D2C(%) (8)
where ˆβ2,βˆ4 are the estimated coefficients of the date-currency interaction terms in
equa-tion (6), ¯P is the average volume-weighted price of the USD mandated contracts (1.7%),
M aturity is their average volume-weighted maturity (7 years) and V lm is their average
daily volume ($75 billion). Finally, we multiply with the average fraction of dealer-to-client volume (33%) to estimate the reduction in execution costs that accrues to market end-users.
Similarly, the total reduction in execution costs for to USD mandated contracts is given by:
∆Cost(USD MAT)≈
4 X i=1 ˆ βi ×P¯×M aturity×V lm×D2C(%) (9)
where here we include the sum of all estimated dummy coefficients ˆβi from equation (6).24
This calculation suggests that the effects of the trade mandate are economically
signif-icant. The coefficients for the Curr×Date(1) and Curr×Date(2) terms in the dispersion
specifications give an incremental reduction in execution costs for USD mandated versus EUR mandated contracts of between 12% and 19% of previous cross-currency average dispersion
levels. This amounts to a daily reduction of approximately $3-$6 million for end-users. The
total reduction in execution costs for USD mandated contracts is larger, at 22% to 32% of previous dispersion levels, which amounts to roughly $7-$11 million daily for end-users. The effect on the EUR contracts is also substantial, despite the fact that fewer participants are captured by the mandate. The reduction in execution costs there is 10% to 14% or $3-$5 million daily.
24Note, though, that only the incremental reduction in execution costs can be causally attributed to the trade mandate.
4.3
Liquidity in D2D versus D2C trades
In this section we investigate whether the liquidity improvements for SEF-traded contracts are visible both in dealer-to-client (D2C) trades and inter-dealer (D2D) trades. Does SEF trading allow dealers to rebalance inventories more cheaply or are end-users able to enter positions more cheaply or both?
In Tables 7 and 8, we re-run our liquidity panel regressions, but where the dependent variable is now constructed from either D2D trades or D2C trades. Unfortunately, we can-not separate either the quoted spread data or the Amihud measure into D2D and D2C components (as they are not based on individual trades) and so we have results only for the dispersion measures of liquidity. We only report results for the specifications with all the controls.
The first 4 regressions in Tables 7 and 8 indicate that, after the SEF mandate date, D2C trades in the treated group of swaps always experience a liquidity improvement (i.e. dispersion falls), regardless of which control group we use and regardless of the dispersion measure used to approximate liquidity. This increase in liquidity is significant in 5 of the 6 regressions. There is no consistent movement in D2C liquidity for treated group relative to control group swaps on the first event date. Only one of the first event date interactions is significant and that too suggests an improvement in liquidity when SEF trading is available. For D2D trading, the picture is much less clear. The results, in the last 4 regressions in Tables 7 and 8, show that liquidity of D2D trades in USD mandated contracts improves relative to that of D2D trades in mandated EUR swaps after the SEF mandate date for all of the dispersion measures. However, there is no such improvement in D2D liquidity for mandated USD contracts relative to non-mandated USD contracts. The results suggest that D2D liquidity improves for both mandated and non-mandated USD contracts, in particular after the first event date (with results for one liquidity proxy showing that liquidity improves more for non-mandated contracts than for mandated contracts on this date).
liquidity benefits from mandated SEF trading. The picture for inter-dealer trades is less clear, in that we do not see uniform evidence that their trading has become less expensive.
4.4
SEF flag panel specifications
We next test how thefraction of SEF trading affects liquidity and market activity. For this,
we utilize the DTCC segment of our data which contains a flag indicating whether a given trade was executed on a SEF. We estimate the following panel specification for mandated USD and EUR-denominated contracts only, on a daily frequency:
Lit=αi+β1SEFit+β2Date(1)t +γSwap RVit+δ0Xt+it (10)
whereLitis one of the previously defined liquidity or market activity variables for contract
ion dayt,SEFitis the percentage of SEF trading,Date
(1)
t is a date dummy taking the value
of 1 after the authorization of SEFs on 2 October 2013 andXtis the usual vector of controls.
We include the date dummy in the specification to control for any effects on the dependent variable related to SEF trading being available regardless of the degree of actual SEF trading. For instance, dealers could be quoting narrower spreads simply because they know that SEF trading is possible and their quotes are potentially subject to comparison and scrutiny by
end-users. This effect could materialize regardless of the actual amount of SEF trading.25
Because it is possible that SEF trading is itself caused by market liquidity, we also estimate
this model using instrumental variables, instrumenting SEFit with its own lags.
Tables 9 and 10 show the results of these estimations. The coefficients on the percentage of SEF trading are significant in 14 of the 16 regressions and consistent with previous find-ings. A higher fraction of SEF trading is associated with increased levels of liquidity (i.e. lower dispersion, spreads and Amihud measures). Similarly, SEF trading is positive and sta-tistically significant in the regressions for activity variables: a higher fraction of SEF trading 25We also estimate model (10) only using data after the introduction of SEF trading. The results for the liquidity variables are similar to those reported below and for this reason they are omitted.
is associated with higher volumes, more trades and a larger number of market participants. Overall, these results suggest that SEF trading is associated with robust and measurable improvements in market quality.
5
SEFs and Dealer Market Power
5.1
Relationships between Dealers and Clients
Duffie et al. (2005) and Yin (2005) argue that the beneficial effects of pre-trade transparency on liquidity come via the effect of transparency on dealer competition. More intense dealer competition leads to better prices for customers. We have already seen, in Tables 4 and 6, that the introduction of SEF trading increased the number of parties trading swaps, potentially making these markets more competitive. In this section we explore whether the trading relationships between individual customers and dealers have changed as a result of the CFTC trade mandate. If SEF trading has led to more intense competition between dealers, we would expect the number of dealers that the average customer trades with to have risen for swaps subject to the SEF trading mandate.
We create a variable, N dealersit, that is a count of the number of unique dealers with
whom customer i trades in month t, based on trades across all EUR and USD mandated
swaps.As a first pass, we aggregate N dealersit across months and end-users for the period
before mandatory SEF trading and then do the same for the period after the mandate came into force. Figure 4 displays the frequency distributions of those two samples. It is clear that SEF trading is associated with a dramatic rightwards shift in the distribution. For example, prior to the cutoff date, around 28% of customers traded only with a single dealer. With the introduction of the SEF trading mandate, this number dropped to 8%. Similarly, prior to February 2014, over 50% of customers dealt with 3 or fewer dealers, while after this date the corresponding number was around 20%.
of the interactions between swap dealers and customers. The improvements in pre-trade transparency have weakened the ties between individual customers and particular dealers: customer search costs have fallen and thus it has become easier for customers to trade with the dealer showing the best price. Thus, effective competition between dealers has risen and, as shown above, this has led to lower execution costs.
As the CFTC trade mandate only captures US persons, one would also expect any changes in the dealer-client relationships to be more pronounced for US persons. To test this, we estimate a difference-in-differences model using the cross-section of all clients in our sample.
Using our N dealersit variable for every customer and every month, we estimate;
N dealersit = ai+bU Si+c1Date (1) t +c2(Date (1) t ×U Si) +c3(Date (1) t ×ACT IV Ei) +d1Date (2) t +d2(Date (2) t ×U Si) +d3(Date (2) t ×ACT IV Ei)
+f1ACT IV Ei+f2(U Si×ACT IV Ei) +f3(Date(1)t ×U Si×ACT IV Ei)
+f4(Date
(2)
t ×U Si×ACT IV Ei) +γ0Xit+uit (11)
wheretdenotes months,iindexes end-users andai is a fixed effect for end-useri. Date(1)
is the October 2013 SEF introduction dummy, Date(2) is the February 2014 SEF mandate
dummy and the Xi,t vector contains end-user specific trading activity variables (including
number of trades and total volume executed). U Sis a dummy for clients that are US-persons,
whileACT IV Eit is a dummy that identifies a client who trades at least 20 times per month
on average (i.e. roughly once a day or more). In our data, there are a large number of
end-users who trade very infrequently (e.g. once a week or less) and for whom N dealersit
is thus always low regardless of the trading environment. So, in order to focus on clients for whom increased dealer competition and greater liquidity is going to be most valuable, we separate the active from the less active clients in the dummy specification in the regression Table 11 shows the results of this estimation. The implementation of the SEF trading mandate leads to the active set of US clients executing against a significantly larger number
of dealers. Prior to the mandate date, and focussing on the results without control variables for clarity of interpretation, the significant coefficients indicate that those active US clients dealt with around 9 dealers per month on average and afterwards this increases by around 17%, or 1.6 dealers, on average. This change is statistically significant, while there are no significant shifts for non-US or inactive clients. The specification with control variables yields qualitatively similar findings, although in that case the less active US clients see a small, marginally significant drop in the number of dealers they trade with after the mandate date. Thus, our graphical and econometric evidence is consistent. After the introduction of mandatory SEF trading competition between dealers intensified, particularly for the set of active US clients, and this likely contributes to the fall we observe in clients’ trading costs.
5.2
The Geography of Trading and Dealer Market Power
Shortly after the SEF trading mandate took effect, one concern among market participants and regulators was that it might lead the global swaps market to fragment along geographical lines (ISDA (2014)). Since the mandate only applied to US persons it was conceivable that, for example, European counterparties who wished to avoid trading on a SEF might do so by trading exclusively with other European counterparties. Indeed, some reports released after the implementation of the mandate suggested that the market was fragmenting and that this was causing market quality to deteriorate (e.g. Giancarlo (2015)).
To shed light on this issue, we exploit the data on counterparty identities for the LCH trades. We classify market participants as either US or non-US-based and calculate the percentage of trading volume executed between those two groups (US-to-non-US).
Figure 5 plots this percentage for USD and EUR-denominated contracts. It is evident that after the introduction of SEF trading there is a clear reduction in the fraction of US-to-non-US volume in EUR-denominated swaps, from around 20% to 5%. There is no similar effect in USD contracts. More formally, the first two columns of Table 12 show the results of time-series regressions of the fractions of US-to-non-US volumes in USD and EUR contracts on the
SEF introduction event dummy and a number of controls. The dummy coefficient is highly significant and negative for the EUR contracts and insignificant for USD contracts. Thus the EUR segment of the swap market became significantly more geographically fragmented following the introduction of SEF trading.
As previously discussed, it is likely that the observed difference between the two market segments is because of the much smaller proportion of US market participants in EUR-denominated swaps trading. If a non-US counterparty wants to trade with another non-US counterparty and avoid executing on a SEF, this is much simpler for a EUR-denominated contract than for a USD-denominated one. Given the preponderance of US persons trading USD swaps, it is hard to avoid trading with a US person and thus on a SEF.
However, given the beneficial effects of SEF trading, the obvious question is why any (and which) counterparties might want to avoid trading on SEFs. Figure 6 shows a breakdown of the fraction of US-to-non-US volume in the EUR-denominated contracts according to the type of counterparties. It is clear that the observed fragmentation is entirely driven by inter-dealer trading and the last two columns of Table 12 confirm this. Thus, it appears that it is swap dealers who are trying to avoid using SEFs where possible. There is no observable fragmentation for EUR trades that involve at least one non-dealer. This might have been expected, as there is no incentive for customers to avoid trading on SEFs given the liquidity improvements they offer.
The question that remains is why cross-border activity by EUR swap dealers dropped so clearly when the SEF trading mandate was introduced in the US. One possibility is that inter-dealer trading between US-based and non-US-based dealers could genuinely have exogenously declined and could have been replaced by local (intra-US and intra-European) trading. Alternatively, inter-dealer trades between US and non-US firms could have been executed by the non-US branches of swap dealers who happen to have trading desks in multiple jurisdictions. For example, a trade in EUR between a US and a European dealer that was being executed by the US desk of the former, could now be executed by the European
desk of the same dealer. In this case, it would be registered as an intra-European trade and would not be subject to the SEF trade mandate.
To see if this is the case, we plot in Figure 7 the fraction of inter-dealer trading in EUR contracts done by the US and non-US trading desks of only those swap dealers who have desks in multiple jurisdictions and who execute more than 10% of their swap volumes from a desk located in the United States. The figure shows that there is a sharp shift in inter-dealer activity from the US desks to the non-US ones. The fraction of non-US desk trading increases from a daily average of 75% prior to the introduction of SEFs, to an average of 95% after (with the corresponding fraction of US desk trading dropping from 25% to 5%). Additionally, Figure 8 shows that there is virtually no change in the amount of inter-dealer trading done exclusively by dealers who regularly trade the bulk (i.e. more than 90%) of their derivatives from their European desks. We interpret this as implying that the observed geographical fragmentation is artificial in the sense that it is entirely driven by EUR swap dealers in large institutions using their non-US desks to do business that would previously have passed through their US desk.
These results are consistent with (although not direct proof of) swap dealers strategically choosing the location of the desk executing a particular trade in order to avoid trading in a more transparent and competitive setting. A potential explanation for this lies in attempts to maintain market power. By shifting the location of the inter-dealer market in EUR swaps to Europe and using European entities to execute, the SEF trading mandate and the
associated CFTC impartial access requirements are avoided.26 This allows dealers to retain
power, in that they retain control over who they trade with and how, which in turn would allow them to exclude any potential new competitors from inter-dealer trading. If a potential competitor cannot access inter-dealer markets to manage inventory, their quotes are likely to be less tight and thus they are less likely to attract business in the customer market.
26The CFTC guidance is available at:
6
Summary and Conclusion
One of the pillars of the G20 reform agenda for OTC derivatives markets is the requirement to migrate trading activity to more centralized, more transparent venues. In response, as part of Dodd-Frank, US regulators have mandated that US persons should trade certain interest rate swap contracts on swap execution facilities (SEFs). These venues improve transparency by automatically disseminating requests for quotes to multiple dealers and by featuring an electronic order book which allows any market participant to compete with dealers for liquidity provision by posting quotes. Thus, SEFs induce competition between existing dealers and also lower the barriers to potential entrants to the dealing community.
Using transaction data from the IRS market we assess the impact of SEF introduction on swap market activity and liquidity. Our findings suggest that the move from an OTC to a more centralized, competitive market structure leads to a reduction in execution costs. This is more pronounced for mandated USD contracts as these are primarily traded by US persons who are captured by the trade mandate. For these contracts, dispersion-based liquidity measures show that liquidity improves by 12% to 19% relative to EUR mandated contracts. This amounts to daily savings in execution costs of as much as $3 - $6 million for end-users of USD swaps.
We then demonstrate that the introduction of centralized trading resulted in a sharp increase in competition between swap dealers. The average active US client in this market trades with a significantly greater number of dealers after the centralized trading mandate. Thus, dealer competition rises and liquidity improves, as one would expect.
Additionally, we find that, for the EUR-denominated swap market, the bulk of inter-dealer trading previously executed between US and non-US trading desks is now largely executed by the non-US (mostly European) trading desks of the same institutions (i.e. banks have shifted inter-dealer trading of their EUR swap positions from their US desks to their European desks). We interpret this as an indication that swap dealers wish to avoid being captured by the SEF trading mandate and the associated impartial access requirements.
Migrating the EUR inter-dealer volume off-SEFs enables dealers to choose who to trade with and (more importantly) who not to trade with. This might allow them to erect barriers to potential entrants to the dealing community. Thus this fragmentation of the global market may be interpreted as dealers trying to retain market power, where possible. Importantly, we find no evidence that customers in EUR swap markets try to avoid SEF trading and the improved liquidity it delivers.
Overall, given the global nature of OTC derivatives markets, our findings suggest that extending the scope of the trading mandate to cover other sufficiently liquid swap markets could be beneficial. Such regulation was implemented at the start of 2018 in the EU as part of the Markets in Financial Instruments Regulation (MiFIR).
References
Acharya, V., Engle, R., Figlewski, S., Lynch, A., Subrahmanyam, M., 2009. Centralized Clearing for Credit Derivatives. In: Acharya, V., Richardson, M. (Eds.), Restoring Fi-nancial Stability: How to Repair a Failed System. John Wiley & Sons Inc, Hoboken, NJ.
Amihud, Y., 2002. Illiquidity and stock returns: Cross-section and time-series effects. Journal of Financial Markets 5 (1), 31–56.
Benos, E., ˇZikeˇs, F., 2018. Funding constraints and liquidity in two-tiered OTC markets.
forthcoming, Journal of Financial Markets.
Bessembinder, H., Maxwell, W., Venkataraman, K., 2006. Market transparency, liquidity externalities, and institutional trading costs in corporate bonds. Journal of Financial Eco-nomics 82 (2), 251 – 288.
Boehmer, E., Saar, G., Yu, L., 2005. Lifting the veil: An analysis of pre-trade transparency at the NYSE. The Journal of Finance 60 (2), 783–815.
Collin-Dufresne, P., Junge, B., Trolle, A., 2016. Market structure and transaction costs of index CDSs. Working Paper.
de Frutos, A., Manzano, C., 2002. Risk aversion, transparency, and market performance. Journal of Finance, 959–984.
Duffie, D., Gˆarleanu, N., Pedersen, L. H., 2005. Over-the-counter markets. Econometrica
73 (6), 1815–1847.
Duffie, D., Zhu, H., 2015. Size discovery. National Bureau of Economic Research Working Paper No. 21696.
Edwards, A. K., Harris, L. E., Piwowar, M. S., 2007. Corporate bond market transaction costs and transparency. The Journal of Finance 62 (3), 1421–1451.
Flood, M. D., Huisman, R., Koedijk, K. G., Mahieu, R. J., 1999. Quote disclosure and price discovery in multiple-dealer financial markets. Review of Financial Studies 12 (1), 37–59. Foucault, T., Moinas, S., Theissen, E., 2007. Does anonymity matter in electronic limit order
markets? Review of Financial Studies 20 (5), 1707.
Foucault, T., Pagano, M., R¨oell, A., 2013. Market Liquidity: Theory, Evidence and Policy.
Oxford University Press.
Friederich, S., Payne, R., 2014. Trading anonymity and order anticipation. Journal of Finan-cial Markets 21, 1 – 24.
Friewald, N., Jankowitsch, R., Subrahmanyam, M. G., 2012. Illiquidity or credit deteriora-tion: A study of liquidity in the US corporate bond market during financial crises. Journal of Financial Economics 105 (1), 18 – 36.
Friewald, N., Jankowitsch, R., Subrahmanyam, M. G., 2014. Transparency and liquidity in the structured product market. Unpublished working paper.
Giancarlo, C., 2015. Pro-reform reconsideration of the CFTC swaps trading rules: Return to Dodd-Frank. White Paper.
Goldstein, M. A., Hotchkiss, E. S., Sirri, E. R., 2007. Transparency and liquidity: A con-trolled experiment on corporate bonds. Review of Financial Studies 20 (2), 235–273. Goyenko, R. Y., Holden, C. W., Trzcinka, C. A., 2009. Do liquidity measures measure
liquidity? Journal of Financial Economics 92 (2), 153–181.
Green, R. C., Hollifield, B., Schrhoff, N., 2007. Financial intermediation and the costs of trading in an opaque market. Review of Financial Studies 20 (2), 275–314.
Harris, L. E., Piwowar, M. S., 2006. Secondary trading costs in the municipal bond market. The Journal of Finance 61 (3), 1361–1397.
Hendershott, T., Madhavan, A., 2015. Click or call? Auction versus search in the over-the-counter market. The Journal of Finance 70 (1), 419–447.
ISDA, 2014. Cross-border Fragmentation of Global OTC Derivatives: An Empirical Analysis. Research Note.
Jankowitsch, R., Nashikkar, A., Subrahmanyam, M. G., 2011. Price dispersion in OTC markets: A new measure of liquidity. Journal of Banking & Finance 35 (2), 343–357. Loon, Y. C., Zhong, Z. K., 2014. The impact of central clearing on counterparty risk,
liq-uidity, and trading: Evidence from the credit default swap market. Journal of Financial Economics 112 (1), 91 – 115.
Loon, Y. C., Zhong, Z. K., 2015. Does Dodd-Frank affect OTC transaction costs and liq-uidity? Evidence from real-time CDS trade reports. forthcoming, Journal of Financial Economics.
Massad, T., 2016. Testimony of Chairman Timothy G.
Mas-sad Before the U.S. House Committee on Agriculture. , URL
http://www.cftc.gov/PressRoom/SpeechesTestimony/opamassad-41.
Naik, N. Y., Neuberger, A., Viswanathan, S., 1999. Trade disclosure regulation in markets with negotiated trades. Review of Financial Studies 12 (4), 873–900.
Nolte, I., Payne, R., Vasios, M., 2015. Profiting from mimicking strategies in non-anonymous markets. Working Paper.
Powell, J., 2016. Trends in Fixed Income Markets: Testimony of Governor Jerome H. Pow-ell Before the Subcommittee on Securities, Insurance, and Investment, and Subcommit-tee on Economic Policy, CommitSubcommit-tee on Banking, Housing, and Urban Affairs. , URL
Riggs, L., Onur, E., Reiffen, D., Zhu, H., 2018. Swap trading after dodd-frank: Evidence from index CDS. Working Paper.
Spatt, C., 2017. Designing reliable clearing and settlement systems for enhancing the trans-parency and stability of derivatives markets. Working Paper.
Vayanos, D., Wang, J., 2012. Market liquidity–theory and empirical evidence. National Bu-reau of Economic Research Working Paper No. 18251.
ˇ
Zikeˇs, F., 2017. Measuring transaction costs in the absence of timestamps. Finance and Economics Discussion Series, 045, Board of Governors of the Federal Reserve System. Yin, X., 2005. A comparison of centralized and fragmented markets with costly search. The
Figure 1: Total traded volume (in $ billion) by currency. In this figure we plot the total volume of EUR-denominated and USD-denominated plain vanilla swaps. The sample covers every spot vanilla interest rate swap which was either cleared by LCH or reported to DTCC between January 1, 2013 and September 15, 2014.
Figure 2: Volume shares by type of counterparty or location: In this figure we decompose the total
volume into (a) dealer-to-dealer (d2d), dealer-to-client (d2c), and client-to-client (c2c) trading; and
(b) US-to-US, US-to-non-US, and non-US-to-non-US trading. The inner circle presents the volumes of USD-denominated swaps, while the outer circle presents the volumes of EUR-denominated swaps. The sample covers every spot vanilla interest rate swap which was cleared by LCH between January 1, 2013 and September 15, 2014.
Figure 3: Parallel trends: this figure shows the evolution of our key liquidity measures, for treated and control samples, prior to the second event date. The liquidity measures shown are smoothed price dispersions, quoted spreads and the Amihud measure and they have been averaged across the members of the relevant set of contracts on each date.
Apr 13 Jul 13 Oct 13 Jan 14 0 0.5 1 1.5 2 USD MAT EUR MAT
(a) Disp(vw): USD MAT vs EUR MAT
Apr 13 Jul 13 Oct 13 Jan 14 0 0.5 1 1.5 2 USD MAT USD non-MAT
(b) Disp(vw): USD MAT vs non-MAT
Apr 13 Jul 13 Oct 13 Jan 14 0 0.5 1 1.5 2 USD MAT EUR MAT
(c) Disp(JNS): USD MAT vs EUR MAT
Apr 13 Jul 13 Oct 13 Jan 14 0 0.5 1 1.5 2 USD MAT USD non-MAT
(d) Disp(JNS): USD MAT vs non-MAT
Apr 13 Jul 13 Oct 13 Jan 14 0 1 2 3 4 5 USD MAT EUR MAT
(e) Qspread: USD MAT vs EUR MAT
Apr 13 Jul 13 Oct 13 Jan 14 0 1 2 3 4 5 USD MAT USD non-MAT
(f) Qspread: USD MAT vs non-MAT
Apr 13 Jul 13 Oct 13 Jan 14 0 5 10 15 20 USD MAT EUR MAT
(g) Amihud: USD MAT vs EUR MAT
Apr 13 Jul 13 Oct 13 Jan 14 0 10 20 30 40 USD MAT USD non-MAT
Figure 4: Frequency distribution of the number of dealers with whom end-users trade before and after February 2014, when SEF trading becomes mandatory for all US persons trading any mandated IRS contracts.
Figure 5: Fraction of US-to-non-US trading. This figure shows the percentage of US-to-non-US trading in USD- and EUR-denominated swaps. The sample covers every spot vanilla interest rate swap transaction reported to LCH. The vertical line marks the introduction of SEFs (October 2, 2013). The time period is January 1, 2013 to September 15, 2014.