Author
Allemani, Claudia, Matsuda, Tomohiro, Di Carlo, Veronica, Harewood, Rhea, Matz, Melissa,
Niksic, Maja, Bonaventure, Audrey, Valkov, Mikhail, Johnson, Christopher J, Esteve, Jacques,
Ogunbiyi, Olufemi J, Azevedo e Silva, Gulnar, Chen, Wan-Qing, Eser, Sultan, Engholm, Gerda,
Stiller, Charles A, Monnereau, Alain, Woods, Ryan R, Visser, Otto, Lim, Gek Hsiang, Aitken,
Joanne, Weir, Hannah K, Coleman, Michel P
Published
2018
Journal Title
Lancet
Version
Post-print
DOI
https://doi.org/10.1016/S0140-6736(17)33326-3
Copyright Statement
© 2018 Elsevier. Licensed under the Creative Commons
Attribution-NonCommercial-NoDerivatives 4.0 International Licence, which permits unrestricted, non-commercial use,
distribution and reproduction in any medium, providing that the work is properly cited.
Downloaded from
http://hdl.handle.net/10072/384545
Griffith Research Online
https://research-repository.griffith.edu.au
Global surveillance of trends in cancer survival 2000–14
(CONCORD-3): analysis of individual records for
37 513 025 patients diagnosed with one of 18 cancers from
322 population-based registries in 71 countries
Claudia Allemani, Tomohiro Matsuda, Veronica Di Carlo, Rhea Harewood, Melissa Matz, Maja Nikšić, Audrey Bonaventure, Mikhail Valkov, Christopher J Johnson, Jacques Estève, Olufemi J Ogunbiyi, Gulnar Azevedo e Silva, Wan-Qing Chen, Sultan Eser, Gerda Engholm, Charles A Stiller, Alain Monnereau, Ryan R Woods, Otto Visser, Gek Hsiang Lim, Joanne Aitken, Hannah K Weir, Michel P Coleman, CONCORD Working Group*
Summary
Background In 2015, the second cycle of the CONCORD programme established global surveillance of cancer survival as a metric of the effectiveness of health systems and to inform global policy on cancer control. CONCORD-3 updates the worldwide surveillance of cancer survival to 2014.
Methods CONCORD-3 includes individual records for 37·5 million patients diagnosed with cancer during the 15-year period 2000–14. Data were provided by 322 population-based cancer registries in 71 countries and territories, 47 of which provided data with 100% population coverage. The study includes 18 cancers or groups of cancers: oesophagus, stomach, colon, rectum, liver, pancreas, lung, breast (women), cervix, ovary, prostate, and melanoma of the skin in adults, and brain tumours, leukaemias, and lymphomas in both adults and children. Standardised quality control procedures were applied; errors were rectified by the registry concerned. We estimated 5-year net survival. Estimates were age-standardised with the International Cancer Survival Standard weights.
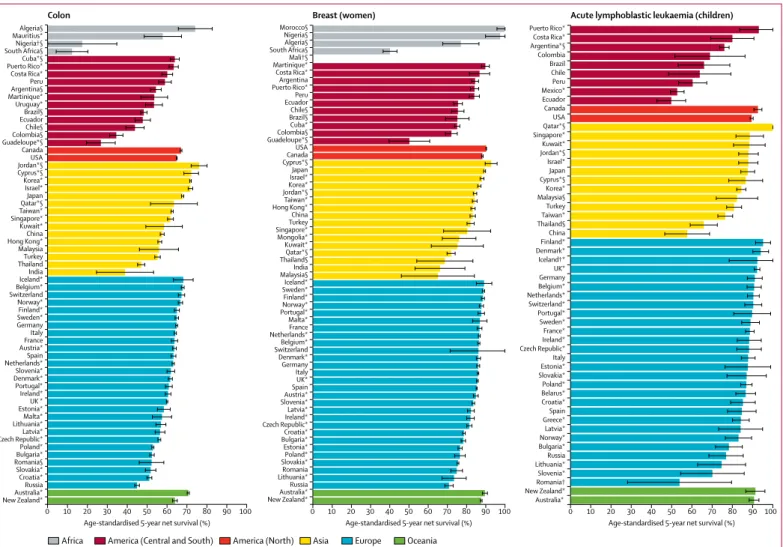
Findings For most cancers, 5-year net survival remains among the highest in the world in the USA and Canada, in Australia and New Zealand, and in Finland, Iceland, Norway, and Sweden. For many cancers, Denmark is closing the survival gap with the other Nordic countries. Survival trends are generally increasing, even for some of the more lethal cancers: in some countries, survival has increased by up to 5% for cancers of the liver, pancreas, and lung. For women diagnosed during 2010–14, 5-year survival for breast cancer is now 89·5% in Australia and 90·2% in the USA, but international differences remain very wide, with levels as low as 66·1% in India. For gastrointestinal cancers, the highest levels of 5-year survival are seen in southeast Asia: in South Korea for cancers of the stomach (68·9%), colon (71·8%), and rectum (71·1%); in Japan for oesophageal cancer (36·0%); and in Taiwan for liver cancer (27·9%). By contrast, in the same world region, survival is generally lower than elsewhere for melanoma of the skin (59·9% in South Korea, 52·1% in Taiwan, and 49·6% in China), and for both lymphoid malignancies (52·5%, 50·5%, and 38·3%) and myeloid malignancies (45·9%, 33·4%, and 24·8%). For children diagnosed during 2010–14, 5-year survival for acute lymphoblastic leukaemia ranged from 49·8% in Ecuador to 95·2% in Finland. 5-year survival from brain tumours in children is higher than for adults but the global range is very wide (from 28·9% in Brazil to nearly 80% in Sweden and Denmark).
Interpretation The CONCORD programme enables timely comparisons of the overall effectiveness of health systems in providing care for 18 cancers that collectively represent 75% of all cancers diagnosed worldwide every year. It contributes to the evidence base for global policy on cancer control. Since 2017, the Organisation for Economic Co-operation and Development has used findings from the CONCORD programme as the official benchmark of cancer survival, among their indicators of the quality of health care in 48 countries worldwide. Governments must recognise population-based cancer registries as key policy tools that can be used to evaluate both the impact of cancer prevention strategies and the effectiveness of health systems for all patients diagnosed with cancer.
Funding American Cancer Society; Centers for Disease Control and Prevention; Swiss Re; Swiss Cancer Research foundation; Swiss Cancer League; Institut National du Cancer; La Ligue Contre le Cancer; Rossy Family Foundation; US National Cancer Institute; and the Susan G Komen Foundation.
Introduction
The incidence of cancer continues to rise, both in high-income countries and, especially, in low-high-income and middle-income countries. Prevention is crucial, but implementation has been slow and incomplete, even in high-income countries. Prevention is a long-term
strategy, and not all cancers can be prevented.1 To reduce
cancer mortality, reduction of cancer incidence and improvement of cancer survival are both necessary.
Many patients will continue to be diagnosed with cancer every year for decades to come: an estimated 14 million patients a year worldwidearound 2012,2 with a
Published Online January 30, 2018 http://dx.doi.org/10.1016/ S0140-6736(17)33326-3 See Online/Comment http://dx.doi.org/10.1016/ S0140-6736(18)30155-7 *Members are listed at the end of the Article
Cancer Survival Group, Department of
Non-Communicable Disease Epidemiology, London School of Hygiene & Tropical Medicine, London, UK (C Allemani PhD, V Di Carlo MSc, R Harewood MSc, M Matz PhD, M Nikšić PhD, A Bonaventure MD, Prof M P Coleman BM BCh); Population-based Cancer Registry Section, Division of Surveillance, Center for Cancer Control and Information Services, National Cancer Center, Tokyo, Japan
(T Matsuda PhD); Department of Radiology, Radiotherapy and Oncology, Northern State Medical University, Arkhangelsk, Russia
(Prof M Valkov MD); Cancer Data Registry of Idaho, Boise, ID, USA (C J Johnson MPH); Department of Biostatistics, Université Claude Bernard, Lyon, France (Prof J Estève PhD); Ibadan Cancer Registry, University City College Hospital, Ibadan, Dyo State, Nigeria
(Prof O J Ogunbiyi MBBS); Department of Epidemiology, Universidade do Estado do Rio de Janeiro, Maracanã, Rio de Janeiro, Brazil
(Prof G Azevedo e Silva PhD); National Office for Cancer Prevention and Control and National Central Cancer Registry, National Cancer Center, Beijing, China
(W-Q Chen PhD); Department of Public Health, Balıkesir University, Balıkesir, Turkey
(S Eser PhD); Department of Documentation and Quality, Danish Cancer Society, Copenhagen, Denmark
(G Engholm MSc); National Cancer Registration and Analysis Service, Public Health England, London, UK
(C A Stiller MSc); Registre des hémopathies malignes de la Gironde, Institut Bergonié, Bordeaux, France
(A Monnereau MD); French Network of Cancer Registries, Toulouse, France
(A Monnereau); British Columbia Cancer Registry, BC Cancer Agency, Vancouver, BC, Canada (R Woods MSc); Netherlands Cancer Registry Netherlands Comprehensive Cancer Organisation (IKNL), Utrecht, Netherlands
(O Visser PhD); National Registry of Diseases Office, Health Promotion Board, Singapore (G H Lim MSc); Cancer Council Queensland, Fortitude Valley, QLD, Australia
(Prof J Aitken PhD); and Division of Cancer Prevention and Control, Centers for Disease Control and Prevention, Atlanta, GA, USA (H K Weir PhD) Correspondence to: Dr Claudia Allemani, Cancer Survival Group, Department of Non-Communicable Disease Epidemiology, London School of Hygiene & Tropical Medicine, London WC1E 7HT, UK
50% projected increase to 21·6 million patients a year by 2030.3 Those patients will all need prompt diagnosis
and optimal treatment to improve their survival. Monitoring the effectiveness of national and regional health systems in treating and caring for these patients becomes ever more crucial.
In 2016, the WHO Executive Board recommended strengthening health systems to ensure early diagnosis and accessible, affordable, high-quality care for all patients with cancer.3 The World Health Assembly
followed up with a resolution on cancer control in May, 2017. It included recommendations that national cancer control strategies should aim to reduce late presentation and ensure appropriate treatment and care for potentially curable malignancies such as acute leukaemia in children “to increase survival, reduce mortality and improve quality of life”.4
President Tabaré Vázquez of Uruguay and WHO Director-General Tedros Ghebreyesus have called for all
countries “to provide universal health coverage, thereby ensuring all people can access needed preventive and curative health-care services, without falling into poverty”.5 Their call relates to all non-communicable
diseases, including cancer. Population-based cancer survival is one metric that can help evaluate whether all people have access to effective treatment services.
In 2015, the second cycle of the CONCORD programme (CONCORD-2) established global surveillance of cancer survival for the first time,6 with publication of trends in
survival over the 15-year period 1995–2009 among patients diagnosed with cancer in 67 countries, home to two thirds (4·8 billion) of the world’s population. In 40 countries, the data had 100% national popu-lation coverage. CONCORD-2 incorporated centralised quality control and analysis of individual data for 25 676 887 patients diagnosed with one of the ten common cancers that represented 63% of the global cancer burden in 2009. The 279 population-based
Research in context
Evidence before this study
In 2015, the second cycle of the CONCORD programme (CONCORD-2) established global surveillance of cancer survival as one of the key metrics of the effectiveness of health systems and to inform global policy on cancer control. This was done by analysis of individual records for 25·7 million patients diagnosed with one of ten common cancers during 1995–2009 and followed up to Dec 31, 2009. The data were provided by 279 population-based cancer registries in 67 countries. CONCORD-2 revealed wide differences in cancer survival trends that were attributed to differences in access to early diagnosis and optimal treatment.
Added value of this study
CONCORD-3 covers almost 1 billion people worldwide. It includes 15 common cancers in adults and three common cancers in children. Data quality has improved. The results are timely, published within 3 years of the end of follow-up. CONCORD-3 updates the worldwide surveillance of cancer survival to 2014. It includes data for over 37·5 million patients diagnosed with cancer during the 15-year period 2000–14. Data were provided by more than 320 population-based cancer registries in 71 countries and territories, including 27 countries of low or middle income; 47 countries provided data with 100% population coverage. The study now includes 18 cancers or groups of cancers: oesophagus, stomach, colon, rectum, liver, pancreas, lung, breast (women), cervix, ovary, prostate, and melanoma of the skin in adults, together with brain tumours, leukaemias, and lymphomas in both adults and children. These cancers represent 75% of all cancers diagnosed worldwide every year, in both low-income and high-income countries. The use of a similar study design and the same statistical methods as in CONCORD-2 enables the evaluation of survival trends for ten cancers over the 20-year period 1995–2014.
For the first time, worldwide trends in survival are also available for cancers of the oesophagus, pancreas, and brain, and lymphomas and leukaemias.
Implications of all the available evidence
The CONCORD programme enables comparative evaluation of the effectiveness of health systems in providing cancer care. It also contributes to the evidence base for global policy on cancer control. CONCORD monitors progress towards the overarching goal of the 2013 World Cancer Declaration, to achieve “major reductions in premature deaths from cancer, and improvements in quality of life and cancer survival” by 2020. It provides evidence to support WHO policy following the Cancer Resolution passed by the World Health Assembly in 2017. The International Atomic Energy Agency’s Programme for Action on Cancer Therapy used CONCORD-2 results in 2015 to launch its worldwide campaign to highlight the global divide in cancer survival, and to raise awareness of persistent inequalities in access to life-saving cancer services. The results were used in a Lancet Series on women’s cancers in 2016. The US Centers for Disease Control and Prevention used the results in a 2017 supplement to the journal Cancer to inform cancer control policy designed to reduce racial differences in cancer survival. CONCORD-3 can be expected to affect cancer control policy worldwide, especially in countries with low survival.
The Organisation for Economic Co-operation and Development published a subset of CONCORD-3 results in 2017 as the official benchmark of cancer survival, among their indicators of the quality of health care in 48 countries worldwide. The survival estimates will also form part of the Lancet Oncology Commission on childhood cancer in 2018. Future research will include examination of the impact on international differences in cancer survival of stage at diagnosis, compliance with treatment guidelines, and the quality of health care.
registries covered a combined total population of 896 million people.
The US National Cancer Institute, in an invited commentary7 for The Lancet, noted that the global analyses
of cancer survival in CONCORD-2 provided insights from countries with successful cancer control initiatives that could be applied in other regions, and that the availability of better data “provides a clearer picture of the effect of cancer control programmes on the ultimate goal of improving survival and reducing the effect of cancer on the social and economic development of countries”.
The US Centers for Disease Control and Prevention described CONCORD-2 as the start of global surveillance of cancer survival,8 with survival estimates “that can be
compared so scientists can begin to determine why survival differs among countries. This could lead to improvements in cancer control programs.” The results from CONCORD-2 influenced national cancer control strategy in the UK in July, 2015.9,10 In September, 2015,
the International Atomic Energy Agency’s Programme for Action on Cancer Therapy used the results to launch a worldwide campaign11 to highlight the global divide in
cancer survival, and to raise awareness of persistent inequalities in access to life-saving cancer services.12
Further analyses of survival trends and disparities by race and stage at diagnosis in 37 US states have been included in a supplement to Cancer,13,14 designed to improve cancer
control in the USA.
CONCORD-3 updates worldwide surveillance of cancer survival trends to include patients diagnosed up to 2014, with follow-up to Dec 31, 2014. In countries that were already involved, more registries are participating, and eight more countries have joined the programme. Follow-up for patients diagnosed during 2000–09 with one of the ten cancers included in CONCORD-2 has been updated. CONCORD-3 includes data for patients diagnosed during 2000–14 with one of 18 malignancies that represent 75% of the global cancer burden (table 1). In addition to information on stage at diagnosis, we have collected data on tumour grade and the first course of treatment. Findings are published within 3 years of the end of follow-up.
Methods
Cancer registries
We contacted 412 cancer registries in 85 countries: 20 in Africa (13 countries), 45 in Central and South America (15 countries), 68 in North America (two countries), 80 in Asia (20 countries), 189 in Europe (33 countries), and ten in Oceania (two countries).
When the data call for CONCORD-3 was issued in May, 2016, 12 of the 279 cancer registries that had participated in CONCORD-2 were no longer operational. The registry in Benghazi (Libya) had been disrupted by war, the registry in Macerata (Italy) had ceased operating, the Department of Health had ceased funding the UK National Registry of Childhood Tumours in 2013, and the
nine English regional cancer registries had been replaced by a single cancer registry for England in 2013. Of the 267 remaining registries, nine could no longer provide up-to-date follow-up of all registered patients, whereas 13 did not reply to repeated approaches. Data from the Tirol (Austria) registry are no longer reported separately from the Austrian national estimates. In all, 244 (87%) of the 279 registries (63 of the 67 countries) that participated in CONCORD-2 submitted data(appendix p 266).
Of the 133 registries that had not previously participated in the CONCORD programme, 108 agreed to do so. Of these, 85 (78%) registries in 12 countries submitted data, whereas 11 were unable to complete follow-up of registered patients with cancer for their vital status, nine made no further contact, and three signed up too late (appendix p 266).
Of the 329 registries that submitted data, seven were excluded because their data were not compliant with the protocol and could not be rectified in time. These exclusions affected the only participating registry or registries from several countries: Tunisia (Central Region), Bosnia and Herzegovina (Republika Srpska), Saudi Arabia, and Serbia (Central Region and Vojvodina). We analysed data provided by 322 cancer registries (81% of the 400 operational registries invited) in 71 countries and territories (appendix p 266), for patients diagnosed with cancer during the 15-year period 2000–14, with data on their vital status at least 5 years after diagnosis, or at Dec 31, 2014.
Eight countries from four world regions are participating in the global surveillance of cancer survival
Overall
(n=14067894) More developed regions (n=6053621) Less developed regions (n=8014273)
Oesophagus 455 784 (3·2%) 86 144 (1·4%) 369 640 (4·6%) Stomach 951 594 (6·8%) 274 509 (4·5%) 677 085 (8·4%) Colorectum 1 360 602 (9·7%) 736 867 (12·2%) 623 735 (7·8%) Liver 782 451 (5·6%) 134 302 (2·2%) 648 149 (8·1%) Pancreas 337 872 (2·4%) 187 465 (3·1%) 150 407 (1·9%) Lung 1 824 701 (13·0%) 758 214 (12·5%) 1 066 487 (13·3%) Melanoma 232 130 (1·7%) 191 066 (3·2%) 41 064 (0·5%) Breast (women) 1 671 149 (11·9%) 788 200 (13·0%) 882 949 (11·0%) Cervix 527 624 (3·8%) 83 078 (1·4%) 444 546 (5·5%) Ovary 238 719 (1·7%) 99 752 (1·6%) 138 967 (1·7%) Prostate 1 094 916 (7·8%) 741 966 (12·3%) 352 950 (4·4%) Brain and central
nervous system 256 213 (1·8%) 88 967 (1·5%) 167 246 (2·1%) Lymphomas 451 691 (3·2%) 219 255 (3·6%) 232 436 (2·9%) Leukaemias 351 965 (2·5%) 141 274 (2·3%) 210 691 (2·6%) All index cancers* 10 537 411 (74·9%) 4 531 059 (74·8%) 6 006 352 (74·9%) Data are from Globocan, 2012.15 Index cancer refers to a cancer or group of malignancies included in CONCORD-3.
More developed regions refers to North America, Europe, Australia, New Zealand, and Japan; all other countries and regions are classified as less developed.15 These are UN designations intended for statistical convenience and do not
reflect a judgment about the stage reached by a particular country or area in the development process.16 *Excluding
non-melanoma skin cancer.
Table 1: Estimated number of patients diagnosed with an index cancer worldwide each year around 2012
for the first time: Morocco (Africa); Costa Rica (national), Mexico (children, national), and Peru (Central and South America); Iran, Kuwait (national), and Singapore (national; Asia), and Greece (children, national; Europe). Ethical approvals
We maintain approvals from the Confidentiality Advisory Group of the UK’s statutory Health Research Authority (HRA; reference ECC 3-04(i)/2011; last update March 3, 2017), the National Health Service Research Ethics Service (11/LO/0331; Feb 21, 2017), and the London School of Hygiene & Tropical Medicine (12171; Sept 6, 2017). The HRA also approves the Cancer Survival Group’s System-Level Security Policy, governing data security. One investigator (MPC) maintains triennial certification with the Collaborative Institutional Training Initiative in Human Subjects Research for Biomedical Investigators (CITI Program; ID3327653; certification updated May 2, 2016). We maintain statutory or ethical approvals and data sharing agreements, usually with annual renewal, in 85 other jurisdictions participating in the CONCORD programme. Registries in all other jurisdictions obtain local approval. The data belong to the participating registries and are only used for purposes agreed in the CONCORD protocol.
Participants transmit data via a specially configured file transmission utility with 256-bit Advanced Encryption Security. The utility automatically generates a random, strong, one-time password for each data file at the time of transmission, and emails it to a different address. Neither the password nor the address are seen by the sender. This avoids the need for confirmation of passwords by email or telephone. Tumour records are effectively anonymised: they do not contain the patient’s name, address, postcode, or any national identity or social security number. All variables are numeric or alphanumeric codes. Each registry is sent a set of unique codes that must be used in naming each cancer data file, including distinct filenames for any retransmission. The codes have no meaning outside of the study. Data files thus contain no information that could be used to identify a person or a cancer registry, and neither the name nor the content of the file would indicate that the file contains cancer data. This enhances security and facilitates efficient handling of thousands of data files. Protocol
The CONCORD-3 protocol defining the data structure, file transmission procedures, and statistical analyses was expanded and updated from the CONCORD-2 protocol, with the inclusion of variables on five additional cancers or groups of malignancies, tumour grade, and the modality and date of the first course of treatment by surgery, radiotherapy, or systemic therapy.
In a study of this scale, adherence to protocol is crucial. The protocol and analytic approaches were discussed with CONCORD Working Group members from 27 countries
at a 1-day meeting in Marrakesh, Morocco, on Oct 17, 2016. The protocol was also discussed at workshops in China, Romania, Russia, Singapore, and the USA (for North America), and in conference calls with Costa Rica, Hong Kong, Malaysia, Mauritius, Mexico, and Mongolia.
English is still a barrier to communication in many countries, so the CONCORD-3 protocol was translated into eight other languages: Arabic, Chinese (Mandarin), French, Italian, Japanese, Portuguese, Russian, and Spanish. Translations were done by native speakers in the CONCORD Central Analytic Team in London or the wider CONCORD Working Group, and checked against the English original by other native speakers. The protocol was made available to participants in all nine languages on the CONCORD website. The Central Analytic Team communicates with participants in six languages.
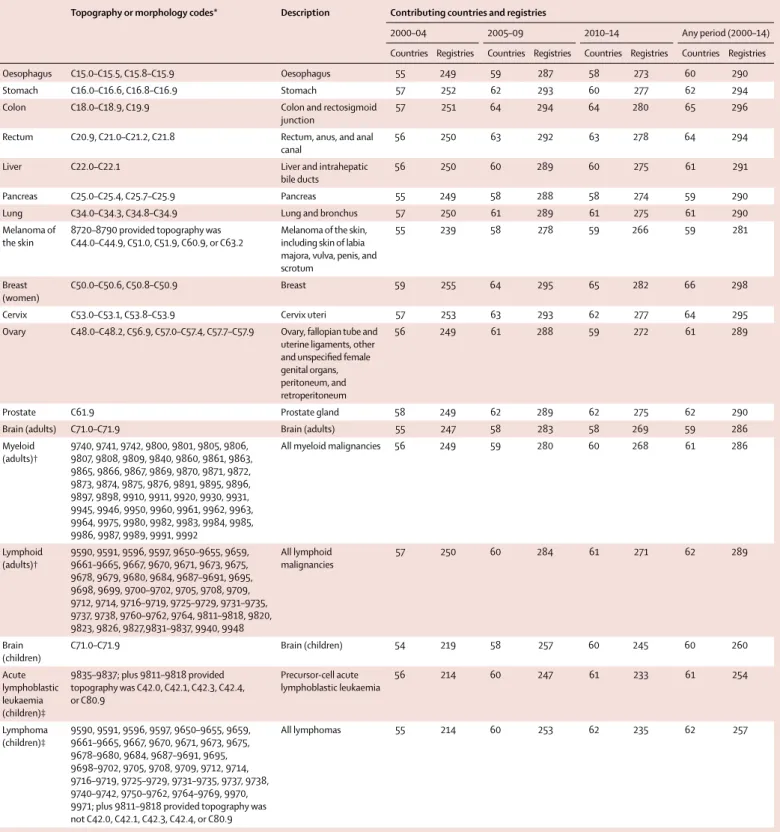
We examined survival for 18 cancers or groups of malignancies (referred to as index cancers): oesophagus, stomach, colon, rectum, liver, pancreas, lung, melanoma of the skin, breast (women), cervix, ovary, and prostate in adults (15–99 years); brain tumours, myeloid, and lymphoid malignancies in adults; and brain tumours, acute lymphoblastic leukaemia, and lymphomas in children (0–14 years). Collectively, these cancers accounted for about 75% of the estimated number of patients diagnosed with cancer worldwide each year around 2012 (table 1). The overall proportion is very similar in North America, Europe, Australia, New Zealand, and Japan (referred to as developed countries15) and in other
world regions (referred to as developing countries15), but
it varies widely between cancers: prostate cancer is proportionately three times more common in developed countries, and cervical cancer is four times more common in developing countries (table 1).
Solid tumours were defined by anatomical site (topography), and the leukaemias, lymphomas, and mela noma of the skin by morphology (table 2). Topog-raphy and morphology were coded to the International Classification of Diseases for Oncology (third edition, ICD-O-3),17 including its first revision.18 We restricted
estimation of survival for melanomas to those arising in the skin, including the skin of the labia majora, vulva, penis, and scrotum (table 2). Melanomas arising in internal organs were included with all other malignancies in those organs. For ovarian cancer, we included the fallopian tube, uterine ligaments, and adnexa, as well as the peritoneum and retroperitoneum, where high-grade serous ovarian carcinomas are often detected.21 Registries
were not asked to select cancers by sex, although some did so. Where datasets did include records for breast cancer in men, the proportion was consistently around 0·7%; these records were excluded. We also excluded small numbers of retroperitoneal malignancies in men, as well as Kaposi’s sarcoma, and tumours in solid organs with haemopoietic morphology.
Registries provided data for all haemopoietic malignancies (ICD-O-3 morphology codes in the
Topography or morphology codes* Description Contributing countries and registries
2000–04 2005–09 2010–14 Any period (2000–14)
Countries Registries Countries Registries Countries Registries Countries Registries
Oesophagus C15.0–C15.5, C15.8–C15.9 Oesophagus 55 249 59 287 58 273 60 290
Stomach C16.0–C16.6, C16.8–C16.9 Stomach 57 252 62 293 60 277 62 294
Colon C18.0–C18.9, C19.9 Colon and rectosigmoid
junction 57 251 64 294 64 280 65 296
Rectum C20.9, C21.0–C21.2, C21.8 Rectum, anus, and anal
canal 56 250 63 292 63 278 64 294
Liver C22.0–C22.1 Liver and intrahepatic
bile ducts 56 250 60 289 60 275 61 291
Pancreas C25.0–C25.4, C25.7–C25.9 Pancreas 55 249 58 288 58 274 59 290
Lung C34.0–C34.3, C34.8–C34.9 Lung and bronchus 57 250 61 289 61 275 61 290
Melanoma of
the skin 8720–8790 provided topography was C44.0–C44.9, C51.0, C51.9, C60.9, or C63.2 Melanoma of the skin, including skin of labia majora, vulva, penis, and scrotum
55 239 58 278 59 266 59 281
Breast
(women) C50.0–C50.6, C50.8–C50.9 Breast 59 255 64 295 65 282 66 298
Cervix C53.0–C53.1, C53.8–C53.9 Cervix uteri 57 253 63 293 62 277 64 295
Ovary C48.0–C48.2, C56.9, C57.0–C57.4, C57.7–C57.9 Ovary, fallopian tube and uterine ligaments, other and unspecified female genital organs, peritoneum, and retroperitoneum
56 249 61 288 59 272 61 289
Prostate C61.9 Prostate gland 58 249 62 289 62 275 62 290
Brain (adults) C71.0–C71.9 Brain (adults) 55 247 58 283 58 269 59 286
Myeloid (adults)† 9740, 9741, 9742, 9800, 9801, 9805, 9806, 9807, 9808, 9809, 9840, 9860, 9861, 9863, 9865, 9866, 9867, 9869, 9870, 9871, 9872, 9873, 9874, 9875, 9876, 9891, 9895, 9896, 9897, 9898, 9910, 9911, 9920, 9930, 9931, 9945, 9946, 9950, 9960, 9961, 9962, 9963, 9964, 9975, 9980, 9982, 9983, 9984, 9985, 9986, 9987, 9989, 9991, 9992
All myeloid malignancies 56 249 59 280 60 268 61 286
Lymphoid (adults)† 9590, 9591, 9596, 9597, 9650–9655, 9659, 9661–9665, 9667, 9670, 9671, 9673, 9675, 9678, 9679, 9680, 9684, 9687–9691, 9695, 9698, 9699, 9700–9702, 9705, 9708, 9709, 9712, 9714, 9716–9719, 9725–9729, 9731–9735, 9737, 9738, 9760–9762, 9764, 9811–9818, 9820, 9823, 9826, 9827,9831–9837, 9940, 9948 All lymphoid malignancies 57 250 60 284 61 271 62 289 Brain
(children) C71.0–C71.9 Brain (children) 54 219 58 257 60 245 60 260
Acute lymphoblastic leukaemia (children)‡ 9835–9837; plus 9811–9818 provided topography was C42.0, C42.1, C42.3, C42.4, or C80.9 Precursor-cell acute lymphoblastic leukaemia 56 214 60 247 61 233 61 254 Lymphoma (children)‡ 9590, 9591, 9596, 9597, 9650–9655, 9659, 9661–9665, 9667, 9670, 9671, 9673, 9675, 9678–9680, 9684, 9687–9691, 9695, 9698–9702, 9705, 9708, 9709, 9712, 9714, 9716–9719, 9725–9729, 9731–9735, 9737, 9738, 9740–9742, 9750–9762, 9764–9769, 9970, 9971; plus 9811–9818 provided topography was not C42.0, C42.1, C42.3, C42.4, or C80.9
All lymphomas 55 214 60 253 62 235 62 257
Some registries contributed data for selected cancers or calendar periods, so the number of participating countries also varies by cancer and calendar period. The number of countries and registries that contributed data at some point during 2000–14 is thus greater than or equal to the number in any 5-year period. *International Classification of Diseases for Oncology (ICD-O-3),17 including its first revision.18 †Lymphoid malignancies
were defined by HAEMACARE19 groups 1–19 and myeloid malignancies by HAEMACARE groups 20–25, incorporating morphology codes from the first revision of ICD-O-3. ‡The International Classification of Childhood
Cancer (third edition)20 incorporating morphology codes from the first revision of ICD-O-318 was used to define childhood acute lymphoblastic leukaemia (group Ia1) and lymphoma in children (group II).
For the database of global administrative areas see http://www.gadm.org/
range 9590–9992) in adults and children, to minimise differences in the spectrum of leukaemias and lym-phomas submitted for analysis. In consultation with specialists in the HAEMACARE19 and InterLymph22,23
groups, we agreed to analyse survival for adults in two broad groups: lymphoid malignancies (HAEMACARE groups 1–19) and myeloid malignancies (groups 20–25; table 2; appendix pp 2–5).
For children, we agreed to present survival estimates separately for acute lymphoblastic leukaemia and lymphomas, based on ICD-O-3 codes, grouped according to the third edition of the International Classification of Childhood Cancer.20 The first revision of ICD-O-3,
published in 2013,18 introduced eight new entities for
acute lymphoblastic leukaemia or lymphoma (morph-ology codes 9811–9818). These new entities were not used at all by registries in 42 of the 58 countries that submitted data for children diagnosed with acute lymphoblastic leukaemia during 2010–14, and very rarely in eight countries (ie, the combined number of children coded to a new entity was fewer than 100), but the proportions ranged from 11% to 89% in large datasets from Australia, Belgium, Canada, the Netherlands, Puerto Rico, Singapore, Taiwan, and the USA. The overall proportion for all 58 countries combined during 2010–14 was 29% (10 679 of 36 867 children). We therefore included the new entities in all analyses. We included them among the acute lymphoblastic leukaemias if the anatomical site was coded as blood, bone marrow, reticulo-endothelial, or haemopoietic system not otherwise specified (C42.0–42.1, C42.3–42.4), or unknown primary site (C80.9). Otherwise, such malignancies were included with the lymphomas (appendix pp 2–5).
Survival analyses include only primary, invasive malignancies (ICD-O-3 behaviour code 3), except for the brain, where benign tumours (behaviour code 0) are also included. To facilitate quality control and comparison of the intensity of early diagnostic and screening activity, registries were asked to provide data for all registered malignancies at each index site, including those that were benign, of uncertain or borderline malignancy (behaviour code 1), in situ (behaviour code 2), metastatic (behaviour code 6), or uncertain whether primary or metastatic (behaviour code 9).
Registries were asked to provide full dates (day, month, and year) of birth, diagnosis, and death or last known vital status, both for quality control and to enable comparable estimation of survival.24 Where the day or
month of birth, or the day of the date of diagnosis, or the day or month of the date of last known vital status was missing, we used an algorithm (details on request) to standardise the imputation of missing components of dates for all populations.
Participating registries completed a questionnaire on their methods of operation, including data definitions, data collection procedures, coding of anatomical site, morphology and behaviour, the tracing of patients
registered with cancer to ascertain their vital status, and how tumour records are linked with data on vital status.
Patients diagnosed with two or more primary cancers at different index sites during 2000–14 were included in the analyses for each cancer—eg, colon cancer in 2005 followed by a breast cancer in 2010. Survival was measured from the date of diagnosis until death, loss to follow-up, or censoring. We retained the most complete record for patients with synchronous primary cancers in the same organ. If a patient was registered with two or more primary malignancies in the same index site during 2000–14 (metachronous primaries), only the first was included in analyses.
North American registries define multiple primary cancers under the rules of the Surveillance Epidemiology and End Results programme.25 Those rules accept more
cancers as new primary cancers than do the rules of the International Association of Cancer Registries (IACR),26
which are used by most cancer registries in other continents. The North American Association of Central Cancer Registries (NAACCR) kindly updated the program developed for CONCORD-2 to enable all North American registries to recode their entire incidence databases to the IACR multiple primary rules before their datasets for 2000–14 were extracted for CONCORD-3.
Countries and territories were defined by their United Nations (UN) name, continent, and code as of 2015.16 The
names of jurisdictions used in the text, tables, graphics, maps, and appendix are based on those used for statistical purposes by the Statistics Division of the UN Secretariat; similarly, we use the terms “national coverage” to contrast with “regional coverage” for statistical purposes. These designations and the presentation of data here do not imply any assumption regarding the political affiliation of countries or territories, or the expression of any opinion whatsoever on the part of the CONCORD programme concerning the legal status of any country, territory, city, or area, or of its authorities, or concerning the delimitation of its frontiers or boundaries. Some names have been shortened for convenience (eg, Korea for South Korea): this does not carry any political significance.
Cyprus is a Member State of the European Union, but it is part of Asia. Costa Rica, Cuba, Guadeloupe, Martinique, Mexico, and Puerto Rico (Caribbean and Central America) were grouped with South America as Central and South America. World maps and 29 regional maps were prepared in ArcGIS Release 10.3,27 using
digital boundaries (shapefiles) from the database of global administrative areas (GADM 2.8).
The population coverage of the data from participating registries is given as the proportion of the country or jurisdiction’s population, taken from the UN Population Division database for 2014,28 or from the authorities for
Australia, Guadeloupe, Hong Kong, Poland, Portugal, and Taiwan, or the registries concerned. Belarus, Greece, and Mexico provided data only for childhood cancers, so the populations used were for children (0–14 years),
and Mali, Mongolia, and Morocco only provided cancer data for women, so we used the female populations. Quality control
As for the previous cycle of the CONCORD programme,6
we carried out data quality checks in three phases: protocol adherence, exclusions, and editorial checks. After each phase, a detailed report was sent to each cancer registry for discussion and correction of data where required.
First, we sent registries a report showing the percentage compliance with the protocol for each of 51 variables in each cancer file. Compliance of less than 100% required correction or resubmission of data. Next, we checked for logical inconsistencies between the variables in each tumour record. Exclusion criteria were defined a priori, on the basis of experience from CONCORD-2, and extended to cover features of some of the five additional cancers such as Ann Arbor stage for the lymphomas and 14 additional variables on tumour grade and treatment. The variables in each record were checked for logical coherence against 20 sets of criteria, including eligibility (eg, age and tumour behaviour), definite errors (eg, sex-site errors, invalid dates, impossible date sequence, and missing vital status), and possible errors, including a wide range of inconsistencies between age, tumour site, and morphology.6,29 Registries were sent exclusion
reports for each index cancer and each calendar period, summarising the number of tumour records with each type of definite or possible error, the number registered from a death certificate only (DCO) or detected at autopsy, and the number and proportion of eligible patients whose data could be included in survival analyses. Registries were invited to request details of tumour records in which errors had been detected. Many registries used this information to update their databases. Where errors in classification, coding, or pathological assignment were identified, registries were asked to correct and resubmit their data.
Finally, we examined the proportion of tumour records with morphological verification of the diagnosis, whether from histology of a biopsy or surgical specimen, cytology of a smear or bone marrow aspirate, or from imaging or biomarkers, including tumours with a specific morphology code. We also examined the proportion of cases with non-specific morphology; the distributions of the day and month of the dates of birth, diagnosis, and last known vital status; and the proportion of patients who died within 30 days, were lost to follow-up, or were censored within 5 years of diagnosis.
Follow-up for vital status
Cancer registries use various methods to determine the vital status (alive, dead, emigrated, or lost to follow-up) of patients registered with cancer.6 Among 243 registries
that provided specific information on follow-up procedures, 242 (99%) determine the vital status of
registered patients with cancer using passive follow-up techniques in which tumour registration records are regularly linked to a regional or national index of all death registrations, regardless of the cause of death. Linkages are usually based on a national identity or social security number that is stored in both records. Such linkages are increasingly done electronically, but manual scrutiny of printed lists is still required in places. Tumour records that match to a death record are updated with the date of death. Some registries routinely receive paper or electronic death certificates for their territory but this is insufficient on its own because death certificates that do not mention cancer are rarely included. Transcription errors can arise with identity numbers, so variables such as the name, sex, and date of birth are often used to improve the probability of an accurate match between a cancer record and a death registration.
Many registries use electoral registers, hospital records, or official databases, such as social insurance, health insurance, and driving licences, to determine the date on which a patient was last known or believed to have been alive. Patients recorded as having migrated beyond the registry’s jurisdiction, or to another country, might be recorded as lost to follow-up because the patient’s eventual death is unlikely to be recorded: they are censored from survival analysis on that date.
Active follow-up techniques are also used by 124 (51%) of the 243 registries, which routinely contact the treating physician, general practitioner, or hospital administration to determine the vital status for each registered patient, often on a quarterly or annual basis. Some registries also determine the vital status by contact with the patient’s family, by telephone or home visit, or with the village administration.
Registries were asked to submit data with follow-up for at least 5 years or, for patients diagnosed during 2010–14, until Dec 31, 2014. Registration and follow-up for patients diagnosed in 2000–09 was updated and new datasets were submitted.
Patients registered solely from a death certificate or diagnosed at autopsy were excluded from analyses because their survival time is unknown.
Statistical analysis
Most registries submitted data for patients diagnosed between 2000 and 2014, with follow-up to 2014, although some registries only began operation after 2000 or provided data for less than 15 years. The study design we used to examine survival trends among patients diagnosed in three consecutive 5-year calendar periods was “cohort, cohort, period”. We used the cohort approach to estimate survival for patients diagnosed during 2000–04 and 2005–09 and the period approach for patients diagnosed during 2010–14. This design was also used for CONCORD-2,6 so it enables us to examine
including the estimates for patients diagnosed during 1995–99.
The cohort approach is considered the gold standard30,31
because it provides a survival estimate for a group of patients who were diagnosed during the same year or period, are likely to have been treated in similar fashion, and who have all been followed up for at least the duration of survival required, such as 5 years. This approach to the estimation of survival is easy to interpret, but other approaches are required when some patients have been followed up for less than 5 years.
We used the cohort approach for patients diagnosed in 2000–04 and 2005–09 because in most datasets all patients had been followed up for at least 5 years. We used the period approach32 for patients diagnosed during
2010–14 because 5 years of follow-up data were not available for all patients. This combination of cohort and period approaches facilitates monitoring of cancer survival trends over an extended time span, from the earliest to the most recent years of cancer registration for which follow-up data are available (appendix p 267).33
To ensure comparability of survival trends from 1995,6
we estimated net survival up to 5 years after diagnosis for both adults and children. Net survival is the cumulative probability of surviving up to a given time since diagnosis (eg, 5 years) after correcting for other causes of death (background mortality). We used the Pohar Perme estimator,34 which takes unbiased account of the higher
competing risks of death in elderly people, implemented with the algorithm stns35 in Stata (version 14).
To control for the wide differences in background mortality between participating jurisdictions and over time, we produced 6210 life tables of all-cause mortality rates for each calendar year during 2000–14 in the general population of each country or registry territory, by single year of age, by sex, and by race or ethnicity in Australia (Northern Territory: Indigenous or non-Indigenous), Israel (Arab or Jewish), New Zealand (Māori or non-Māori), and Singapore (Chinese, Malay, or Indian). For 127 registries, we obtained complete life tables that did not require interpolation or smoothing for each calendar year in 2000–14.
For 193 registries, the method of life table construction depended on whether we received raw data (numbers of deaths and populations) or mortality rates, and on whether the raw data or the mortality rates were by single year of age (ie, complete) or by 5-year age group (ie, abridged).
For 108 registries, we obtained death and population counts from the registry or the relevant national statistical authority. We derived life tables for 2001 and 2013 if possible, each centred on 3 calendar years of data (eg, 2000–02 or 2012–14) to increase the robustness of the rates. We constructed raw mortality rates from the death and population counts using a Poisson regression model with flexible functions,36 then
smoothed and extended the rates to obtain complete
life tables by sex and single year of age up to age 99 years. Life tables for each calendar year in 2002–12 were created by linear interpolation between the 2001 and 2010 life tables.37 Rather than extrapolate, we used
the life table centred on 2001 for 2000, and the life table centred on 2013 for 2014.
For 56 registries that provided abridged mortality rates, or complete mortality rates that were not smoothed, we used the Ewbank relational model38 with three or four
parameters to interpolate (if abridged) and smooth the mortality rates for the registry territory against a high-quality smooth life table for a country with a similar pattern of mortality by age.39
Each set of life tables was checked with a standardised statistical summary on the earliest and latest year of available data, showing the data source and the method of construction and smoothing. For each sex and, where relevant, each race or ethnicity, the reports show the life expectancy at birth, the probability of death in the age bands 15–59, 60–84, and 85–99 years, and semi-log plots of the age–mortality rates from 0 to 99 years, showing both the raw datapoints and the final smoothed life-table curve, and the model residuals by age group (appendix pp 268–271).
Collection of authoritative raw data on the numbers of deaths and populations by age, sex, and calendar year or period in participating jurisdictions proved more difficult than in 2013–14. For 29 registries, no reliable data on all-cause mortality could be obtained for the registry territory. We took national life tables published by the UN Population Division28 and interpolated and extended
them to age 99 years with the Elandt-Johnson method.40
For the 42 participating states in the USA, we used life tables by state, race, and socioeconomic status, provided by the US National Cancer Institute (Mariotto A; personal communication on Jan 26, 2016).
For each country, registry, and calendar period, we present age-standardised net survival estimates for each cancer at 5 years after diagnosis. For adults, we used the International Cancer Survival Standard (ICSS) weights,41
in which age at diagnosis is categorised into five groups: 15–44, 45–54, 55–64, 65–74, and 75–99 years and, for prostate cancer, 15–54, 55–64, 65–74, 75–84, and 85–99 years. Of the three sets of ICSS weights, we used group 2 (cancers for which incidence does not increase steeply with age) for melanoma of the skin, cervix uteri, and brain (adults), and group 1 (cancers for which incidence does increase steeply with age) for oesophagus, stomach, colon, rectum, liver, pancreas, lung, breast, ovary, and prostate, and both groups of haemopoietic malignancies. For children, we estimated survival for the age groups 0–4, 5–9, and 10–14 years; we obtained age-standardised estimates by assigning equal weights to the three age-specific estimates.41,42
Cumulative survival probabilities in the range 0–1 are presented for convenience as percentages in the range 0–100%. 95% CIs for both unstandardised and
age-standardised survival estimates were derived assuming a normal distribution, truncated to the range 0–100. Standard errors to construct the CIs were derived with the Greenwood method.43 If no death or censoring occurred
within 5 years, or if all patients died within 5 years (survival probability 1 or 0), we obtained a binomial approximation for the lower or upper bound, respectively, of the CI.30
We did not estimate survival if fewer than ten patients were available for analysis. If 10–49 patients were available for analysis in a given calendar period, we only estimated survival for all ages combined. If 50 or more patients were available, we attempted survival estimation for each age group. If a single age-specific estimate could not be obtained, we merged the data for adjacent age groups and assigned the combined estimate to both age groups before standardisation for age. If two or more age-specific estimates could not be obtained, we present only the unstandardised estimate for all ages combined. We did not merge data between consecutive calendar periods.
We considered survival estimates as less reliable if 15% or more of patients were lost to follow-up or censored alive within 5 years of diagnosis. For patients diagnosed in 2010 or later, this criterion was applied for
patients censored alive before Dec 31, 2014, the study closure date. Estimates are also considered less reliable if 15% or more of patients were registered only from a death certificate or at autopsy and excluded from analysis, because their survival is unknown. Finally, estimates are also considered less reliable if 15% or more of patients were excluded from analysis because one or more dates was incomplete: unknown year of birth, unknown month or year of diagnosis, or unknown year of last known vital status.
The pooled estimates for countries with more than one registry do not include data from registries for which the estimates were less reliable. Less reliable estimates are shown with a flag in figures and tables when they are the only available information from a given country or territory. Role of the funding source
The funding sources played no part in the design, data collection, quality control, analysis, interpretation of the findings, writing of the manuscript, or the decision to submit for publication. The corresponding author had full access to all data and responsibility for submission for publication.
Figure 1: Participating countries and regions: world (adults)
Registries in smaller countries are shown in boxes, at different scales. See appendix (pp 178–208) for regional maps and for world map for childhood cancers. National coverage
Regional coverage Regional territory (no data) No coverage
Guadeloupe
Martinique Gibraltar
Cuba
Puerto Rico Malta Cyprus Jordan Qatar Mauritius
Israel
Taiwan Hong Kong
Results
The CONCORD database 2000–14
We analysed data for 322 cancer registries in 71 countries in Africa (eight registries, six countries), Central and South America (33 registries, 13 countries), North America (57 registries, two countries), Asia (66 registries, 17 countries), Europe (149 registries, 31 countries), and Oceania (nine registries, two countries; figure 1).
For 47 countries, data were provided with 100% coverage of the national population: 41 countries for both adults and children, and six for children only (Argentina, Belarus, France, Greece, Mexico, and Switzerland; table 3). In the other countries, population coverage varied from less than 1% in India to 86% in the USA (tables 4, 5). 80 cancer registries joined the CONCORD programme for the first time. The 322 participating registries covered a combined pop ulation of almost 1 billion people around 2014 (989 082 244; tables 4, 5). Detailed maps of participating jurisdictions are shown in the appendix (pp 178–208).
Coverage is now national in Australia, and contributions from additional registries increased the population coverage in another 14 of the 25 countries that participated in CONCORD-2 with subnational coverage. These are Africa: Algeria (from 1·6% to 6·0%); Central and South America: Brazil (from 5·7% to 7·7%), Chile (from 5·5% to 13·8%), Colombia (from 6·9% to 9·0%), and Ecuador (from 33·8% to 40·2%); North America: the USA (from 83·2% to 85·8%); Asia: Japan (from 29·2% to 40·6%), Thailand (from 5·9% to 20·3%), and Turkey (from 5.4% to 23·4%); Europe: France (from 18·4% to 21·7%), Italy (from 38·6% to 58·3%), Romania (from 3·1% to 5·0%), Russia (from 0·9% to 5·6%), and Switzerland (from 47·4% to 54·7%); and Oceania: Australia (from 90·8% to 100·0%). International coverage has been reduced by the loss of data from Indonesia (Jakarta) and from four countries in Africa: Gambia, Lesotho, Libya, and Tunisia.
Three of the Polish registries that participated in CONCORD-2 now use a different or anglicised name, changing the alphabetical order in the supplementary tables: Holy Cross (formerly Kielce), Lower Silesia (Wrocław), and Subcarpathia (Podkarpackie). All 16 voivodeships of Poland are now included.
Four registries submitted data with wider territorial coverage than before. The Burgundy (Digestive) registry in France submitted data for both the Saône-et-Loire and the Côte-d’Or departments; in Italy, the Biella registry now covers the Vercelli province as well as Biella, and the Milan registry now covers the Milan province and Lodi as well as the city of Milan; and the Cluj registry in Romania expanded coverage from Cluj county to include Bistrița-Năsăud county.
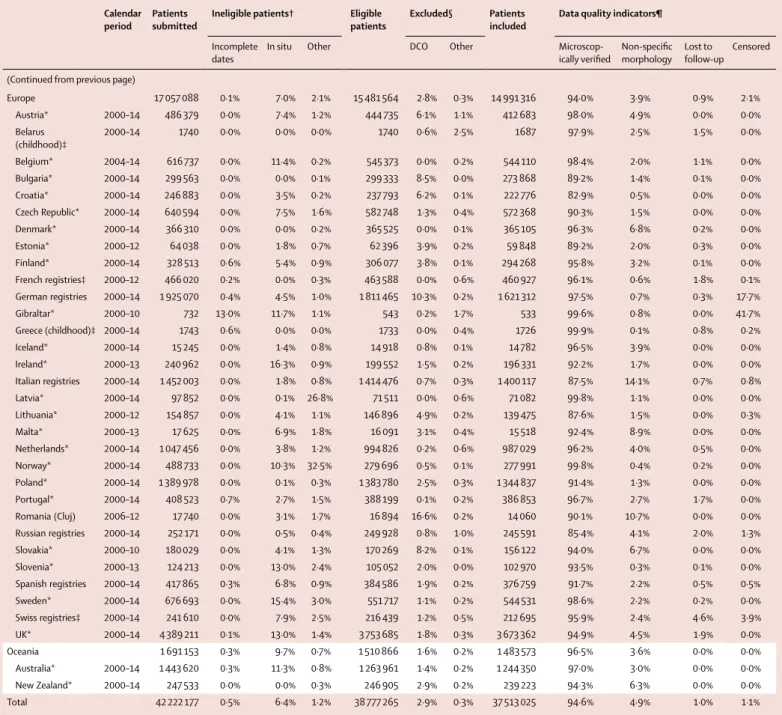
We received more than 4700 datasets. We examined individual cancer registrations for 42 222 177 patients diagnosed with an index cancer during the period 2000–14 (table 3). Of these, 2 690 466 (6·4%) were for an in-situ cancer, mostly of the cervix (54·6% of 1 708 385 women), melanoma of the skin (27·0% of 2 262 368 patients), breast
(10·6% of 7 379 194 women), rectum (4·8% of
1 881 039 patients), colon (4·4% of 4 619 844 adults), or prostate (0·6% of 6 069 870 men; appendix pp 6–101). The proportions of in-situ cancer are not directly comparable between countries because some registries still do not record in-situ malignancies, whereas others did not submit data for cancers for which in-situ malignancy is common. The variation between continents is still of interest: for cervical cancer, it ranged from 2·2% in African registries to 23·6% in Central and South American registries, 37·4% in Asian registries, 66·7% in European registries, and 81·9% in Oceania; US registries did not submit data for in-situ cervical cancers and only three Canadian provinces did so. The proportion of in-situ breast cancers varied from 0·2% in African registries to 4-6% in Central and South America, Asia, Europe, and Oceania, and 17·3% in North America (appendix pp 52–56).
Patients with in-situ cancer were not included in survival analyses. We excluded a further 227 038 (0·5%) patients because the year of birth, the month or year of diagnosis, or the year of last known vital status was unknown; and 527 408 (1·2%) patients because the tumour was not a primary, invasive malignancy (behaviour code 3); or the morphology was that of Kaposi’s sarcoma or lymphoma in a solid organ; or for other reasons (table 3). The proportion of records excluded for these reasons is shown for each cancer and each cancer registry in the appendix (pp 6–101).
Of the 38 777 265 patients otherwise eligible for inclusion in survival analyses, we excluded 1 132 833 (2·9%) records because the cancer was registered only from a death certificate or discovered at autopsy (table 3) and a further 131 407 (0·3%) for other reasons. These reasons included definite errors (unknown vital status, unknown sex, sex-site error, and invalid dates or sequence of dates) and possible errors, such as apparent inconsistencies between age, cancer site, and morphology (details on request). For example, we excluded hepato blastomas in children older than 6 years and multiple myeloma in people aged less than 20 years, unless the record was confirmed as correct by the registry concerned.
Among the 37 513 025 patients available for survival analyses for all cancers combined (96·7% of those eligible for inclusion), pathological evidence of malignancy (histology, cytology, or haematology) was available for 35 502 123 (94·6%). This proportion ranged from 88·6% in Asia, 91·6% in Africa, and 92·4% in Central and South America up to 94–98% in Europe, Oceania, and North America (table 3). Continental variation was much wider for some cancers (appendix pp 6–101).
In what follows, we present results in a similar structure for each group of cancers. Differences between survival estimates are given as the arithmetic difference: for example, 12% is 2% (not 20%) higher than 10%. We use flags in the figures (figures 2, 3) and tables (tables 6, 7) to indiate where survival estimates are based on national
Calendar
period Patients submitted Ineligible patients† Eligible patients Excluded§ Patients included Data quality indicators¶
Incomplete
dates In situ Other DCO Other Micro scop-ically verified Non-specific morphology Lost to follow-up Censored
Africa 46 627 9·6% 0·4% 1·1% 41 447 0·9% 2·1% 40 197 91·6% 14·1% 7·6% 37·7% Algerian registries 2000–14 18 157 7·6% 0·1% 1·8% 16 434 1·8% 3·3% 15 602 98·4% 10·2% 0·0% 31·5% Mali (Bamako) 2010–12 104 41·3% 0·0% 0·0% 61 0·0% 1·6% 60 100·0% 20·0% 0·0% 0·0% Mauritius* 2005–12 4125 0·0% 0·0% 0·4% 4109 0·0% 3·7% 3959 96·7% 19·8% 0·0% 2·3% Morocco (Casablanca) 2008–12 4840 1·4% 0·0% 0·1% 4769 0·0% 1·8% 4683 100·0% 2·4% 33·0% 35·6% Nigeria (Ibadan) 2003–14 11 726 25·4% 1·4% 1·2% 8443 0·9% 1·1% 8274 98·7% 2·0% 0·0% 65·3% South Africa (Eastern Cape) 2000–14 7675 0·0% 0·0% 0·6% 7631 0·0% 0·2% 7619 62·3% 39·5% 19·7% 40·2%
America (Central and
South) 906 076 5·4% 3·1% 0·7% 822 687 13·7% 1·1% 700 946 92·4% 8·0% 5·2% 3·7% Argentinian registries‡ 2000–14 75 167 1·7% 1·5% 0·5% 72 366 10·8% 0·6% 64 151 96·5% 5·7% 0·0% 2·3% Brazilian registries 2000–14 191 344 18·5% 3·9% 0·5% 147 622 8·0% 0·9% 134 597 90·0% 10·6% 22·9% 0·3% Chilean registries 2000–12 28 987 0·0% 0·8% 0·7% 28 555 7·6% 0·1% 26 363 86·2% 12·0% 0·0% 13·6% Colombian registries 2000–14 63 402 3·1% 1·5% 1·2% 59 740 5·0% 0·9% 56 245 89·9% 11·3% 0·0% 21·0% Costa Rica* 2002–14 72 900 0·0% 4·1% 1·4% 68 900 8·4% 0·8% 62 536 90·1% 13·0% 0·0% 0·0% Cuba* 2000–12 193 196 0·0% 0·0% 0·2% 192 755 32·3% 2·5% 125 696 91·8% 5·1% 2·6% 0·0% Ecuadorian registries 2000–14 71 798 7·7% 8·2% 0·8% 59 892 9·8% 1·6% 53 043 92·0% 9·9% 0·3% 2·7% Guadeloupe* 2008–13 8896 0·0% 12·0% 0·3% 7802 0·0% 0·2% 7787 99·1% 2·1% 0·0% 57·7% Martinique* 2000–12 16 066 0·0% 0·0% 0·1% 16 053 0·0% 1·7% 15 779 97·3% 0·7% 7·3% 0·1% Mexico (childhood)‡ 2008–14 9749 5·8% 0·0% 9·7% 8236 0·0% 0·5% 8194 99·8% 3·9% 9·3% 7·6% Peru (Lima) 2010–12 19 078 0·1% 0·0% 0·7% 18 929 8·9% 0·1% 17 226 93·9% 2·9% 0·0% 10·2% Puerto Rico* 2000–11 118 877 3·7% 3·9% 0·7% 109 001 6·4% 0·3% 101 613 98·4% 3·4% 0·0% 0·0% Uruguay* 2008–12 36 616 0·0% 9·6% 0·7% 32 836 15·5% 0·1% 27 716 85·0% 15·9% 0·0% 0·0% America (North) 15 925 870 0·7% 6·8% 0·7% 14 622 183 1·8% 0·3% 14 320 034 97·7% 3·0% 1·4% 0·0% Canadian registries 2000–14 1 519 461 0·1% 4·9% 0·7% 1 431 975 1·2% 0·4% 1 409 413 94·8% 5·5% 0·0% 0·0% US registries 2000–14 14 406 409 0·7% 7·0% 0·7% 13 190 208 1·8% 0·3% 12 910 621 98·0% 2·8% 1·5% 0·0% Asia 6 595 363 0·6% 3·4% 0·4% 6 298 518 4·7% 0·4% 5 976 959 88·6% 11·5% 0·4% 1·0% Chinese registries 2003–13 610 729 0·8% 0·2% 0·2% 603 861 1·4% 0·1% 594 533 66·2% 41·8% 3·2% 0·1% Cyprus* 2004–14 25 086 1·4% 2·6% 0·8% 23 880 9·0% 0·5% 21 610 98·9% 1·8% 0·0% 34·8% Hong Kong* 2005–14 78 127 3·8% 0·0% 0·0% 75 146 0·4% 0·2% 74 721 96·6% 0·0% 5·5% 0·0% Indian registries 2000–14 5048 3·2% 0·0% 0·0% 4882 1·7% 0·6% 4774 82·1% 25·1% 1·8% 0·1% Iran (Golestan) 2006–08 1187 0·0% 0·0% 0·5% 1181 8·9% 3·1% 1 039 82·1% 17·9% 8·9% 0·0% Israel* 2000–13 282 191 0·0% 7·3% 2·2% 255 359 4·8% 0·4% 241 881 96·8% 4·2% 0·0% 0·0% Japanese registries 2000–14 2 237 861 1·0% 4·8% 0·5% 2 096 697 12·4% 0·1% 1 834 894 91·4% 11·3% 0·0% 1·7% Jordan* 2000–14 43 442 0·2% 1·2% 1·5% 42 179 0·2% 1·6% 41 433 99·1% 3·0% 5·9% 0·0% Korea* 2000–14 1 770 463 0·5% 0·0% 0·0% 1 762 176 0·0% 0·1% 1 760 804 93·1% 7·8% 0·0% 0·0% Kuwait* 2000–13 8931 0·0% 1·4% 1·1% 8710 2·3% 0·3% 8484 99·8% 0·4% 1·2% 0·0% Malaysia (Penang) 2000–13 19 612 0·3% 0·0% 0·1% 19 527 1·6% 2·1% 18 805 94·2% 9·5% 0·0% 13·0% Mongolia* 2003–14 1025 0·0% 1·1% 0·0% 1014 0·3% 1·2% 999 77·0% 4·1% 7·6% 0·0% Qatar* 2000–14 7940 0·0% 1·0% 1·0% 7778 1·0% 0·7% 7642 95·4% 6·3% 0·0% 51·0% Singapore* 2000–14 122 461 0·0% 7·0% 1·9% 111 495 1·1% 0·3% 109 992 91·7% 1·9% 0·0% 0·0% Taiwan* 2000–14 941 313 0·1% 8·6% 0·1% 859 169 0·0% 0·1% 858 683 86·6% 0·5% 0·0% 0·0% Thai registries 2000–14 183 776 0·0% 0·3% 0·5% 182 455 3·8% 8·7% 159 528 68·6% 34·0% 0·0% 3·0% Turkish registries 2000–13 256 171 1·5% 2·7% 0·9% 243 009 1·9% 0·5% 237 137 94·7% 7·9% 0·2% 3·8%
population coverage, are unstandardised, or are considered less reliable. Where relevant, we mention in the text only reliable, age-standardised survival estimates. Where possible, we also present graphics of national trends in
cancer survival over the 20-year period 1995–2014. Estimates for patients diagnosed during 1995–99 are for countries that provided data for one of the ten cancers included in CONCORD-2.6
Calendar
period Patients submitted Ineligible patients† Eligible patients Excluded§ Patients included Data quality indicators¶
Incomplete
dates In situ Other DCO Other Micro scop-ically verified Non-specific morphology Lost to follow-up Censored (Continued from previous page)
Europe 17 057 088 0·1% 7·0% 2·1% 15 481 564 2·8% 0·3% 14 991 316 94·0% 3·9% 0·9% 2·1% Austria* 2000–14 486 379 0·0% 7·4% 1·2% 444 735 6·1% 1·1% 412 683 98·0% 4·9% 0·0% 0·0% Belarus (childhood)‡ 2000–14 1740 0·0% 0·0% 0·0% 1740 0·6% 2·5% 1687 97·9% 2·5% 1·5% 0·0% Belgium* 2004–14 616 737 0·0% 11·4% 0·2% 545 373 0·0% 0·2% 544 110 98·4% 2·0% 1·1% 0·0% Bulgaria* 2000–14 299 563 0·0% 0·0% 0·1% 299 333 8·5% 0·0% 273 868 89·2% 1·4% 0·1% 0·0% Croatia* 2000–14 246 883 0·0% 3·5% 0·2% 237 793 6·2% 0·1% 222 776 82·9% 0·5% 0·0% 0·0% Czech Republic* 2000–14 640 594 0·0% 7·5% 1·6% 582 748 1·3% 0·4% 572 368 90·3% 1·5% 0·0% 0·0% Denmark* 2000–14 366 310 0·0% 0·0% 0·2% 365 525 0·0% 0·1% 365 105 96·3% 6·8% 0·2% 0·0% Estonia* 2000–12 64 038 0·0% 1·8% 0·7% 62 396 3·9% 0·2% 59 848 89·2% 2·0% 0·3% 0·0% Finland* 2000–14 328 513 0·6% 5·4% 0·9% 306 077 3·8% 0·1% 294 268 95·8% 3·2% 0·1% 0·0% French registries‡ 2000–12 466 020 0·2% 0·0% 0·3% 463 588 0·0% 0·6% 460 927 96·1% 0·6% 1·8% 0·1% German registries 2000–14 1 925 070 0·4% 4·5% 1·0% 1 811 465 10·3% 0·2% 1 621 312 97·5% 0·7% 0·3% 17·7% Gibraltar* 2000–10 732 13·0% 11·7% 1·1% 543 0·2% 1·7% 533 99·6% 0·8% 0·0% 41·7% Greece (childhood)‡ 2000–14 1743 0·6% 0·0% 0·0% 1733 0·0% 0·4% 1726 99·9% 0·1% 0·8% 0·2% Iceland* 2000–14 15 245 0·0% 1·4% 0·8% 14 918 0·8% 0·1% 14 782 96·5% 3·9% 0·0% 0·0% Ireland* 2000–13 240 962 0·0% 16·3% 0·9% 199 552 1·5% 0·2% 196 331 92·2% 1·7% 0·0% 0·0% Italian registries 2000–14 1 452 003 0·0% 1·8% 0·8% 1 414 476 0·7% 0·3% 1 400 117 87·5% 14·1% 0·7% 0·8% Latvia* 2000–14 97 852 0·0% 0·1% 26·8% 71 511 0·0% 0·6% 71 082 99·8% 1·1% 0·0% 0·0% Lithuania* 2000–12 154 857 0·0% 4·1% 1·1% 146 896 4·9% 0·2% 139 475 87·6% 1·5% 0·0% 0·3% Malta* 2000–13 17 625 0·0% 6·9% 1·8% 16 091 3·1% 0·4% 15 518 92·4% 8·9% 0·0% 0·0% Netherlands* 2000–14 1 047 456 0·0% 3·8% 1·2% 994 826 0·2% 0·6% 987 029 96·2% 4·0% 0·5% 0·0% Norway* 2000–14 488 733 0·0% 10·3% 32·5% 279 696 0·5% 0·1% 277 991 99·8% 0·4% 0·2% 0·0% Poland* 2000–14 1 389 978 0·0% 0·1% 0·3% 1 383 780 2·5% 0·3% 1 344 837 91·4% 1·3% 0·0% 0·0% Portugal* 2000–14 408 523 0·7% 2·7% 1·5% 388 199 0·1% 0·2% 386 853 96·7% 2·7% 1·7% 0·0% Romania (Cluj) 2006–12 17 740 0·0% 3·1% 1·7% 16 894 16·6% 0·2% 14 060 90·1% 10·7% 0·0% 0·0% Russian registries 2000–14 252 171 0·0% 0·5% 0·4% 249 928 0·8% 1·0% 245 591 85·4% 4·1% 2·0% 1·3% Slovakia* 2000–10 180 029 0·0% 4·1% 1·3% 170 269 8·2% 0·1% 156 122 94·0% 6·7% 0·0% 0·0% Slovenia* 2000–13 124 213 0·0% 13·0% 2·4% 105 052 2·0% 0·0% 102 970 93·5% 0·3% 0·1% 0·0% Spanish registries 2000–14 417 865 0·3% 6·8% 0·9% 384 586 1·9% 0·2% 376 759 91·7% 2·2% 0·5% 0·5% Sweden* 2000–14 676 693 0·0% 15·4% 3·0% 551 717 1·1% 0·2% 544 531 98·6% 2·2% 0·2% 0·0% Swiss registries‡ 2000–14 241 610 0·0% 7·9% 2·5% 216 439 1·2% 0·5% 212 695 95·9% 2·4% 4·6% 3·9% UK* 2000–14 4 389 211 0·1% 13·0% 1·4% 3 753 685 1·8% 0·3% 3 673 362 94·9% 4·5% 1·9% 0·0% Oceania 1 691 153 0·3% 9·7% 0·7% 1 510 866 1·6% 0·2% 1 483 573 96·5% 3·6% 0·0% 0·0% Australia* 2000–14 1 443 620 0·3% 11·3% 0·8% 1 263 961 1·4% 0·2% 1 244 350 97·0% 3·0% 0·0% 0·0% New Zealand* 2000–14 247 533 0·0% 0·0% 0·3% 246 905 2·9% 0·2% 239 223 94·3% 6·3% 0·0% 0·0% Total 42 222 177 0·5% 6·4% 1·2% 38 777 265 2·9% 0·3% 37 513 025 94·6% 4·9% 1·0% 1·1%
DCO=death certificate only. *Data with 100% coverage of the national population. †Incomplete dates: records in which the year of birth is unknown; or the month or year of diagnosis is unknown; or the year of last known vital status is unknown. In-situ malignancy (ICD-O-3 behaviour code 2): some registries do not register in-situ cancers; other registries did not submit them. Other: records with incomplete data or for tumours that are benign (behaviour code 0, except brain tumours), of uncertain behaviour (behavior code 1), metastatic from another organ (behavior code 6), or unknown if primary or metastatic (behavior code 9); or for patients with age outside the range 0–14 years (children) or 15–99 years (adults); or other conditions. ‡Data with 100% coverage of the national population for childhood malignancies only. §DCO: tumours registered only from a death certificate or detected at autopsy. Sweden does not register DCOs; autopsy-detected cases were not submitted for CONCORD-2 but have been submitted for CONCORD-3. Other: vital status or sex unknown; invalid date or sequence of dates; inconsistency of sex–site, site-morphology, age–site, age-morphology, or age–site-morphology. ¶Non-specific morphology (solid tumours only): ICD-O-317,18 morphology code in the range 8000–8005. Censored: patients whose last known vital status is “alive” and who were censored within 5 years of
diagnosis or, if diagnosed in 2010 or later, before Dec 31, 2014.
Oesophagus
Results are available for 734 428 adults from 290 registries in 60 countries (table 2, table 4). In 2010–14, 5-year age-standardised net survival was in
the range 10–30% in most countries, with a much wider range in Asia (appendix p 248). Most survival estimates were considered reliable (table 6; appendix pp 138–151).
Population
covered Percentage of national population covered
Number of patients Total
number of patients†
Oesophagus Stomach Colon Rectum Liver Pancreas Lung Melanoma
of the skin Africa 10 533 762 3·5% 3057 1731 2172 1487 869 379 2734 368 40 197 Algerian registries 2 447 075 6·3% 104 1129 1331 827 244 272 1852 248 15 602 Mali (Bamako) 764 245 9·0% ·· ·· ·· ·· ·· ·· ·· ·· 60 Mauritius* 1 268 567 100·0% 59 494 494 289 27 45 584 4 3959 Morocco (Casablanca) 2 178 083 12·7% ·· ·· ·· ·· ·· ·· ·· ·· 4683 Nigeria (Ibadan) 2 797 220 1·6% ·· ·· 230 266 333 ·· ·· 69 8274
South Africa (Eastern
Cape) 1 078 572 2·0% 2894 108 117 105 265 62 298 47 7619
America (Central and
South) 99 818 363 23·7% 13 528 60 643 82 843 26 424 9019 15 731 53 959 8202 700 946 Argentinian registries‡ 3 973 922 9·2% 1152 2686 6076 1959 968 1657 5195 1084 64 151 Brazilian registries 15 882 624 7·7% 6678 15 567 21 984 10 354 858 5520 4884 1424 134 597 Chilean registries 2 459 133 13·8% 918 4423 1949 824 525 793 2166 554 26 363 Colombian registries 4 277 369 9·0% 642 7988 3874 1990 1129 1303 3965 1373 56 245 Costa Rica* 4 757 606 100·0% 528 8577 5438 1926 1239 1188 2688 1432 62 536 Cuba* 11 379 111 100·0% ·· 6664 15 047 ·· ·· ·· 19 344 ·· 125 696 Ecuadorian registries 6 398 546 40·2% 486 7210 3203 1622 1502 1069 2641 1080 53 043 Guadeloupe* 450 273 100·0% 119 521 724 210 82 167 308 52 7787 Martinique* 396 425 100·0% 213 973 1305 423 206 473 693 164 15 779 Mexico (childhood)‡ 35 188 624 100·0% ·· ·· ·· ·· ·· ·· ·· ·· 8194 Peru (Lima) 7 548 697 24·4% ·· ·· 2803 992 ·· ·· ·· ·· 17 226 Puerto Rico* 3 686 517 100·0% 1743 3900 14 594 3882 2202 1984 6570 1039 101 613 Uruguay* 3 419 516 100·0% 1049 2134 5846 2242 308 1577 5505 ·· 27 716 America (North) 301 237 785 84·8% 195 255 283 566 1 471 548 461 707 246 966 462 187 2 564 507 678 206 14 320 034 Canadian registries 27 213 277 76·5% 18 788 33 889 166 760 60 958 20 858 41 908 236 434 65 235 1 409 413 US registries 274 024 508 85·8% 176 467 249 677 1 304 788 400 749 226 108 420 279 2 328 073 612 971 12 910 621 Asia 227 771 765 7·2% 206 254 971 935 703 081 361 987 617 479 205 345 950 362 31 314 5 976 959 Chinese registries 31 755 347 2·3% 72 714 92 578 35 001 31 498 74 295 19 110 133 932 1 449 594 533 Cyprus* 1 153 658 100·0% 81 802 2665 788 247 534 2489 589 21 610 Hong Kong* 7 241 700 100·0% ·· ·· 28 797 12 856 ·· ·· ·· ·· 74 721 Indian registries 1 005 294 0·1% 269 303 199 191 230 134 850 29 4774 Iran (Golestan) 1 893 646 2·4% 412 353 216 58 ·· ·· ·· ·· 1039 Israel* 7 939 483 100·0% 1691 9737 33 938 9401 2310 8083 25 347 12 265 241 881 Japanese registries 51 445 407 40·6% 63 631 381 457 247 682 102 776 122 792 79 636 276 444 4018 1 834 894 Jordan* 7 416 083 100·0% 352 1955 5116 1775 606 952 4282 214 41 433 Korea* 50 074 400 100·0% 30 627 396 213 187 078 121 053 214 821 59 357 257 345 5771 1 760 804 Kuwait* 3 753 121 100·0% 90 207 908 330 261 240 559 18 8484 Malaysia (Penang) 1 543 500 5·2% 290 1061 2285 1126 927 539 2863 ·· 18 805 Mongolia* 1 468 823 100·0% ·· ·· ·· ·· ·· ·· ·· ·· 999 Qatar* 2 172 065 100·0% 98 361 784 283 438 186 587 55 7642 Singapore* 3 870 700 100·0% 1 434 6822 17 225 6241 7101 3481 17 921 367 109 992 Taiwan* 23 123 866 100·0% 27 680 54 983 108 844 57 163 158 157 22 283 141 108 2988 858 683 Thai registries 13 738 188 20·3% 3344 5321 13 801 6679 30 814 3284 28 865 695 159 528 Turkish registries 18 176 484 23·4% 3541 19 782 18 542 9769 4480 7526 57 770 2856 237 137