Environment International, Vol. 18, pp. 117-151, 1992 0160-4120/9255.00 +.00
Printed in the U.S.A. All rights reserved. Copyright 01992 Pergamon Press plc
IS THERE A LARGE RISK OF RADIATION? A
CRITICAL REVIEW OF PESSIMISTIC CLAIMS*
Adnan Shihab-Eldin**
Visiting Scholar from Kuwait Institute for Scientific Research and Lawrence Berkeley Laboratory, Berkeley, CA 94720 USA
Alexander Shlyakhter and Richard Wilson
Department of Physics, Harvard University, Cambridge, MA 02138 USA
El 9104-130M (Received 17 April 1991; accepted 1 December 1991)
A number of situations where it has been claimed that moderate radiation doses cause leukemia or other cancers are carefully reviewed. We look at cases in the United States and Great Britain. Usually, it can be demonstrated that there is an alternative, more probable, explanation for the effect seen. In several cases, the authors of the papers have fallen into statistical traps. The most frequent is a posteriori selection of cohort boundaries in both space and time: a trap illustrated dramatically by Feynman. The next most common trap is to arbitrarily select one out of many ways of looking at the data, against which we were warned by Tippett. Several cohorts are compared with respect to the number of persons at risk, average dose, and the number of cancers expected. Of these, only the cohort of A-bomb survivors in Japan provides evidence of clearly visible excess cancers.
INTRODUCTION
Radiation is still perceived by the public as one of the major health hazards. Although x-rays have been with us since the 1890s, and radioactivity was dis- covered soon thereafter; and while there was some fear of the usual x-rays, the widespread public fear did not arise until 1945 when the first atomic bomb exploded. Fear is a common response among the public - - an irrational fear that can prevent rational
*An expanded version of this paper will be published as Argonne National Laboratory Report.
**Present address: UNESCO/ROSTAS, 8 Abdul-Rahman Fahmy St., Garden City, 11511, Cairo, Egypt.
action to achieve the desired benefits and reduce hazards, while introducing a minimum of new hazards. When fear exists, there will, in a free society, be those who exploit the fear for their own ends, who feed it and nourish it. The exaggerated claims and predictions of doom appear in the newspapers (or the Congressional Record), but rarely in scientific jour- nals. This whole issue of fear has been discussed by Weart (1988).
Some people make a sharp distinction between natural and man-made radiation. But in practice, this distinction is arbitrary. The natural background can be reduced or increased by our actions. We can build houses to avoid radon gas or to trap it.
In this paper, we review some of the pessimistic claims about radiation. We attempt to discover what,
118 S h i h a b - E l d i n et al.
if anything, that is useful these claims tell us. Ideally, we would only consider data and claims made in journals which have peer review. However, public policy is often made using reports and papers that have not been so published. One ignores these at the price of being irrelevant. However, in the references, we try to make the distinction clear when it is not obvious. For example, newspapers and the congres- sional record are not peer reviewed, nor are scientific newspapers such as the N e w Scientist. However, Na- ture and S c i e n c e are peer reviewed.
Any discussion and review of the effects of radia- tion on health is necessarily incomplete. It has been estimated that there are over 100 000 references on the subject. In making this review, we have just begun to address many of the claims and have only read a fraction of the papers. However, we hope and believe that we show how to address the main issues. In addition to the reports of scholarly and interna- tional organizations (BEIR 1972, 1980, 1990; ICRP 1982; NCRP 1980, 1989; UNSCEAR 1986, 1988, Shimizu et al. 1988), there are a number of other review papers and books by distinguished authors. Some of them address the issues considered here, and we list them for convenience (Yalow 1986; Webster 1980; Bond 1970, 1981; Hamilton 1983; Cohen 1980, 1981, 1986; Pochin 1983; Archer 1980; Goldman 1989; Shleien et al. 1991).
There are also a number of books and papers which are written in a less restrained manner by various persons (e.g., McCracken 1982; Grant 1988). These are useful as sources of information, but are, in general, too partisan to present a proper case. FROM INDIVIDUAL CASE TO CONTROLLED
STUDY
When a p h y s i c i a n notices an unusual problem among his patients, he looks for a pattern. The litera- ture is, properly, full of such case reports by obser- vant physicians. It was the observation by Percival Pott that most chimney sweeps died prematurely of cancer of the scrotum that led to the realization that the soot causes cancer. This observation was so clear that no fancy e p i d e m i o l o g i c a l procedures were necessary. However, when effects are small, more elaborate procedures are needed.
There is some confusion about the terms used by different authors. Sir Austin Bradford Hill (1965) uses the word association to describe a situation when two phenomena are known to occur at the same time or place. A statistician often refers to a correla- tion between two observables in the same sense and insists that a correlation may not always be causal;
However, this distinction between a causal and a non-causal correlation is not always realized, and correlation is often automatically exaggerated into causal correlation. We here use the word association instead of correlation in order to emphasize this dis- tinction, and to reject any implication of causality, although an association may sometimes be a causal correlation.
Hill (1965) outlined nine criteria that have to be considered when attempting to attribute a cause to an effect. He emphasizes that they need not all be simul- taneously necessary. For example, the strength of the association observed by Percival Pott was so great that the association forced attention, even though there was little biology to make the causality plausible and nothing with which to make an analogy. The nine criteria are as follows:
1. The strength of the association. If the strength of the association is large, then common sense usual- ly makes it outweigh other considerations. Nonethe- less, cigarette smoking gives a large effect, but the delayed nature of the effect meant that 50 years passed before it was generally accepted that most lung cancers are caused by cigarettes.
2. The consistency of the results. If the same data set is analyzed by different people, they should all find similar results.
3. The specificity of the results. If a specific health condition is associated with the claimed cause, it is usually more believable than a general claim of in- creased mortality.
4. Temporality. The effect must follow the claimed cause and never precede it. If there is a delay (latency period), it must be plausible and understood.
5. Existence of a biological gradient. The effect should increase as the pollution increases.
6. Biological plausibility. The effect should be plausible biologically. This need not mean that there is a detailed explanation, but that the effect should not violate known biological laws.
7. Coherence. Various studies should be correlated in a coherent picture; one isolated study is hard to believe if it seems to contradict others.
8. Experimentation. In some cases, the epidemio- logical study can be supported by experiments on animals where doses are given in a controlled way. It is such experiments, for example, that led to the Linear Quadratic model of BEIR (1980).
9. Analogy. Sometimes we can make an analogy between two carcinogenic agents. For example, ben- zene causes acute myeloid leukemia with a short latent period. Thus, one might reasonably expect a short latent period for radiation-induced leukemia.
Risk of radiation 119
These may seem sophisticated criteria, but they are just simple logical requirements. Hill (1965) em- phasizes that the attribution of cause to an effect does not need all the items to be present; however it is clear that there must be no disproof. Each of these nine criteria are here considered in conjunction with unusual claims of effects of radiation.
If a phenomenon does not fit with existing scien- tific understanding, it requires more, rather than less, evidence to prove its reality. If, for example, it was claimed that a dog ran down 5th Avenue in the city of New York at noon, not many people would be surprised. But if it was claimed that a lion ran down 5th Avenue at noon, there would be considerable proof required. The required proof would be less if other information made it more plausible--if it were known, for example, that a lion had escaped from the Bronx Zoo, in New York City. However, if it were c l a i m e d that a p t e r o d a c t y l ran down 5th Avenue at noon, most auditors would be skeptical because pterodactyls are extinct.
Anyone who claims that low doses of radiation give large effects must overcome a weight of prior evidence; this demand might be reduced if it could be shown that the instruments measuring the dose or the calculations thereof were faulty, and the dose might not be low after all. In most of the cases we discuss here, the evidence provided is insufficient to challenge the well-established facts.
Associated with this need for increased proof in unusual situations, is the need to create a plausible model to d e s c r i b e the e v e n t . This m o d e l , which presumably should be valid at other places and times, should be tested to see whether it indeed makes such valid predictions. For example, if occupational ex- posure to radiation is claimed to cause an excess of cancer, and a background of environmental and medi- cal exposures gives 10 times the radiation dose, one should easily be able to find an excess of cancers from these environmental and medical exposures. If one cannot, then the model must be incorrect. Any claim of unusual association which does not go on to describe a plausible model is incomplete; it will, however, be seen that few authors make such models.
TECHNICAL TERMS
Statistical significance is used to quantify the out- comes of random events (e.g., a throw of a die), by reporting the mean value plus the standard deviation within a certain probability or confidence limit. For normal distributions, if the mean value is N, then the standard deviation is ~/-N-. The 95% confidence limit corresponds to the range of values not exceeding
(N + 1.64 • q-if). If the expected number of cancers among a group of residents is N and the number observed exceeds (N + 1.64 • ~/-N-), then one can claim that a cluster is observed and there is less than a 5% chance that the observed excess is due to a statistical fluctuation above the normal rate.
Infant mortality rate is 1000 multiplied by the ratio of number of deaths of infants <1 y to the number of live births during same year (MacMahon 1970).
The Standard Mortality Ratio (SMR), sometimes called the Total Mortality Ratio (TMR), in a given group is the number of deaths expressed as a per- centage of the number of deaths that would have been expected if the age-and-sex-specific rates in the general populations were obtained. The Cancer Mor- tality Ratio (CMR) is the same, with deaths replaced by cancer deaths. Infant mortality ratio (IMR) is the same as SMR, but restricted to infants.
STATISTICAL TRAPS
Hill (1965) did not state the two most elementary criteria--and the criteria most frequently ignored. There must be a statistically significant effect to consider, and secondly, the statistical analysis must not be biased.
Many errors in pessimistic claims considered in this paper are statistical. The most important of these is biased selection of initial data. Errors associated with such data selection are also some of the hard- est to explain to those unacquainted with statistical methods.
The late Richard Feynman had a dramatic way of demonstrating that a biased selection of data can invalidate standard statistical tests. Coming into class, he said, "You know, the most amazing thing hap- pened to me tonight. I was coming here, on the way to the lecture, and I came in through the parking lot. And you won't believe what happened. I saw a car with the license plate ARW 357! Can you imagine? Of all the millions of license plates in the state, what was the chance that I would see that particular one tonight?" (Goodstein 1989). We can easily work it out: 3 is one out of 10 numbers, 5 is one out of 10 numbers, 7 is one of 10 numbers, A is one of 26 letters, R is one out of 26 letters, and W is one out of 26 letters. If we multiply these numbers together, we find a low probability of 1 in 18 000 000. Yet Feyn- man saw it. This commonplace experience does not seem that improbable. What is the answer to this paradox?
As presented, the answer to this paradox is ob- vious: Feynman did not ask the question about the particular license plate until he knew the answer.
120 Shihab-Eldin et at.
However, in epidemiological studies, the paradox is often disguised. This trap is far from unique to epidemiology, nor is it unusual. Physicists fall into it with surprising regularity. In honor of our friend, the late Professor Richard Feynman, we call it the Feynman Trap.
The i m p o r t a n c e of using unbiased data in any epidemiological study can hardly be overemphasized. The ideal p r o c e d u r e in e p i d e m i o l o g y would be to select a cohort (group of persons) for study while they are young and follow them into the future. Such a study can only be complete after several decades, and even then is not immune from genetic bias or bias due to pre-existing environmental effects.
In practice, what is called a prospective study does not do this; the epidemiologist defines a cohort of interest that existed in the past and then goes through records to find out what happened to the members of the cohort. The epidemiologist must make every ef- fort to be sure that he/she is not influenced by any prior knowledge of the final result in selection of the cohort. This is hard to do; it is not sufficient that the investigator not have prior knowledge. His superior and his funding agency may have such knowledge and have an influence upon the choice of cohort.
This is so difficult, yet so important, that it is preferable that every prospective epidemiological paper starts with a discussion of this point, especially if the numbers are small and the effect of bias most serious. U n f o r t u n a t e l y , this is not done in many epidemiological studies, even by some of the best authors and even in some studies using small num- bers upon which major societal decisions depend.
For example, if a small, possibly unusual, cluster of cancer cases is found in a certain location, con- cerned citizens will properly search for possible causes. They might find an abandoned well or dump site containing some chemical known to be toxic, but with no specific known adverse chronic health effects. It is proper to postulate this c h e m i c a l as a possible cause. This is sometimes called the hypo- thesis-generating event. This can be related to the automobile in the Feynman example.
The hypothesis generating event can then trigger an epidemiological study; the epidemiologist must search for other similar wells or dump sites also containing the chemical of concern. The people must be similar to the general population in all respects except their proximity to the well or dump site and possess no other d i f f e r e n c e in c o m m o n with the people around the original well. Having found such a cohort, and not before (or he/she might be in- fluenced in his/her choice by the result), he/she can
then search the records to find out whether the same type of cancer appears at the new location.
Finally, in establishing statistical significance, the epidemiologist must omit the original group of people, with their cancer cases, that brought the sub- ject to his attention in the first place. We see that this then will satisfy the requirements of reproducibility and specificity outlined by Hill (1965). In many of the discussions below of the claims of large effects of radiation, the requirement of the strength of as- sociation is met, but the others are not.
There are numerous, well-established, epidemio- logical studies that show that large radiation doses to people cause an i n c r e a s e in l e u k e m i a rates, and we know roughly how much. Moreover, radiation- induced leukemias appear after a moderately short latent period, so that they are easier to identify than radiation-induced cancers with a long latent period. It seems obvious, therefore, to search for possible increases in leukemia near nuclear power plants, or any other known radiation sources. It seems espe- cially appropriate to use leukemia as a marker for chronic effects of radiation. Thus, it would appear that the hypothesis has already been generated. However, this is only true if there is enough radioac- tivity from the source to cause a statistically sig- nificant increase in the leukemias. In several of the cases below, we are discussing a new hypothesis: "radiation causes leukemias at several h u n d r e d t i m e s the rate e x p e c t e d from the k n o w n and p u b l i s h e d radiation measurements assuming linear dose-response curve." This could happen either be- cause the actual radiation levels are several hundred times the known and published ones, or because of a new, and most scientists would say unlikely, biological phenomenon.
One of the most common temptations for any epidemiologist or other student of statistics, is to decide upon groups of data, or decide upon statistical tests, after the preliminary results of the study are known. It must always be remembered that if 20 independent biological endpoints (such as cancer in 20 separate organs) are studied, and each tested ac- cording to separate statistical tests, then one will appear to be statistically significant with P < 0.05 by chance alone.
Again, in practice, it is rarely possible to be ab- solutely pure in this regard. When a new idea for a test arises after the study has started and the data collected, some correction can be made by increasing the level of statistical significance demanded. In the case above, where 20 tests are examined, and it is not known in advance which test is to be examined, one
Risk of radiation 121
should demand P < 0.05/20 = 0.0025 instead of the usual P < 0.05. A failure to do this is sometimes called Tippett's Trap, because the well-known statistician Tippett called attention to this problem (Tippett 1937). The reader can often tell whether basic statistical errors such as these have been made. If an author of a paper has data which are just significant, and does not discuss these potential problems, it can usually be assumed that he or she was unaware of them and may have fallen into one of the traps.
DOES RADIATION CAUSE INFANT MORTALITY? Ernest Sternglass published a paper (Sternglass 1963) alleging a link between fallout from nuclear bomb tests and the infant mortality rate. This was based on the experimental evidence by Stewart and
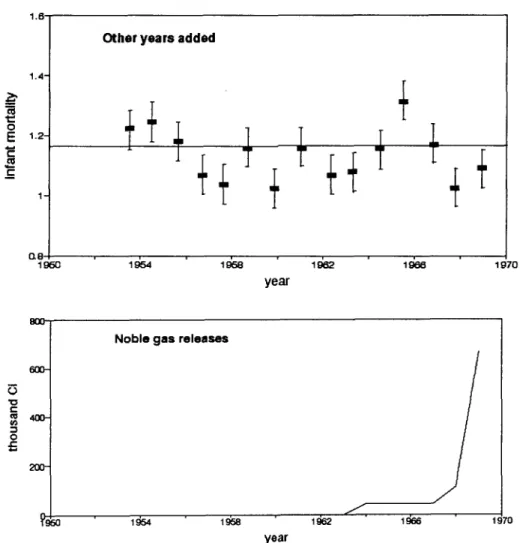
Kneale (1970) and by MacMahon (1963) that x-rays given to pregnant women increased the incidence of childhood leukemias. Fitting these data to a linear dose-response relationship he argued that fallout from bomb tests should increase childhood leukemias, and then extended the argument to other infant mortality. This paper made a number of arbitrary assumptions which were criticized by Dunham (1963), Bennett (1963) and MacMahon (1963). In 1969, Sternglass p r o d u c e d a number of other papers and reports (Sternglass 1969a, 1969b, 1969c, 1969d, 1969e, 1969f). In these papers, he made a number of sugges- tions that fallout from nuclear bomb tests was respon- sible for a number of infant leukemias. These claims were made on the basis of a plot of infant mortality versus time (Fig.la).
1,(]; 1 . 4 - 1 . 2 - 1 - 0.8 1960 lgC:)4 1.6 1.4- 1,2- 1 - Original Sternglass statement m m O.8
I~5o I ~ 1~e I~e2 1~e Io7o
year
Statistical errors added
I
Fig. l a and b. Infant mortality near Indian Point, New York.
1~e Ig~z 1~e ~97o
122 Shihab-Eldin et al. 0 E
E
1,6" 1.4" 1.2-Other years added
Q8 year
J.
I g7CI "0 t-- 0 8oo 6o0- 400- N o b l e g a s r e l e a s e s J , yearFig. lc and d. Infant mortality near Indian Point, New York.
1970
It was tempting at the time for scientists to believe Sternglass' claims without looking carefully at them. By 1963, a majority of scientists had successfully persuaded the major countries of the world to stop t e s t i n g o f n u c l e a r b o m b s in the a t m o s p h e r e . Sternglass appeared to provide extra ammunition to justify this. Rotblat (1970, private communication), a leader in urging nuclear test bans, asked that this temptation be rejected; sooner or later, he argued, the acceptance of bad science, even for a good reason, would backfire. He was particularly concerned that it would be used against peaceful uses of nuclear energy.
Sternglass then extended the arguments about fall- out from nuclear bomb tests to study infant mortality (and sometimes leukemia) near nuclear power plants. A number of persons have reviewed various of his claims; one of the most specific is that of Hull and Shore ( 1 9 7 1 ) . S t e r n g l a s s has s i n c e p r o d u c e d a
string of about ten reports a year, none of which has b e e n a c c e p t e d in the c o m m u n i t y as having any validity.Sternglass' claims met with a storm of criticism (Graham and Thro 1969; Boffey 1969; Stewart 1969; Wrenn 1969; Sagan 1969; E i s e n b u d et al. 1969; Heller 1970). This then led to an unprecedented state- ment read by the current and signed by all living past presidents of the Health Physics Society (Moeller 1971). "We, the President and Past Presidents of the Health Physics Society, do not agree with the claim of Dr. Sternglass that he has shown that radiation exposure from nuclear power operations has resulted in an increase in infant mortality."
An example of one of these is his claim that infant mortality increased near Indian Point I Nuclear Power Plant just after it began operation in 1961. Figure 1 shows how these claims, made for one specific pair of years, show selection bias. The top figure (la) shows Sternglass' two points. They look
Risk of radiation 123
less significant when statistical errors are shown ( l b ) . When the whole graph is shown (Hull and Shore 1971), it is clear that the points were arbitrarily selected in time. Figure ld shows that the increase was not c o r r e l a t e d with r a d i o a c t i v i t y r e l e a s e s as originally claimed, but preceded them. This was a selection bias in time. There also maybe a biased selection of place.
In one of the more recent reports, Sternglass (1986) claims that a release of radioactive material to the environment from the Pilgrim Nuclear Power plant in Plymouth, MA, in June 1982 caused an increase in infant mortality in the counties nearby. As reported to the Nuclear Regulatory Commission (NRC), the release was a solid material and was confined to the power plant property. Nonetheless, it is, of course, plausible to look for effects near the power plant. Sternglass claimed an increase in infant mortality from 1981 to 1982.
In Fig. 2, we show the full data on infant mortality for v a r i o u s y e a r s c o l l e c t e d by the M a s s a c h u s e t t s Department of Public Health (Massachusetts 1987). In Fig. 2a are Sternglass' two points for the town of Plymouth for 1981 and 1982. These indeed suggest an increase. When the statistical errors are added in (Fig. 2b), the claim already looks less impressive. In Fig. 2c, the data for many years are included, show- ing that the overall trend is opposite to that implied by Sternglass. When the data are collected for the whole county and the whole state, in Figs. 2b and 2c, the fluctuations are reduced because of the larger statistical sample. Finally, we note that the measured radioactivity releases from the power plant were larger during the early years of operation--before a graphite filter was installed and while there was a period of leaking fuel pins. However, at no time would these releases have suggested a large excess of cancers, and indeed no such excess has been found. We call attention to the similarity of the claim of infant mortality around Indian Point, and its refutation, to the claim of infant mortality around Pilgrim. Figure 3 shows the same argument for the recent low birthweight around Pilgrim Power Plant.
Not content with the claim that there was increased infant mortality near Pilgrim in 1982 caused by the 1982 release, Sternglass attributed an increase in infant mortality in southwest New Hampshire, 100 miles (160 km) away, to a combination of Pilgrim and two other nuclear power plants--Vermont Yankee and Yankee Rowe. The smog in Boston is closer, thus providing a more likely potential culprit to study.
LEUKEMIA CLUSTERS
It is self-evident that people dying of infectious diseases do not die uniformly throughout the world, but in clusters, either in space or in time, where the infection has taken hold. Diseases which are not infectious are not expected to cluster, except in so far as there might be exogenous causes. Cancer is generally believed to be a non-infectious disease.
Only 3% of cancers are leukemias; but about 15% of cancers that are induced by radiation in the first 30 y after exposure seem to be leukemias (BEIR 1990). This is because of the relatively short latent period for leukemia. This suggests looking for leukemias--particularly acute myeloid leukemias-- as an indicator or marker of radiation exposure. Moreover, leukemia has a short latent period, a causal association with an event becomes easier to prove than for other cancers. But there are several other causes of leukemia; such as benzene and possibly other solvents. Leukemias are believed to cluster in such a way that statistical deviations from ex- pected rates exceed the standard deviation (Glass et al. 1968).
There are four major types of leukemia that are h e m a t o l o g i c a l l y distinct: acute lymphatic (ALL), chronic lymphatic (CLL), acute myeloid(AML) and its variants, and chronic myeloid (CML). Of these, CLL is not known to be caused by radiation. Indeed the progression of the disease is slow, as evidenced by a doubling time of white blood cells of two to three years after diagnosis. Extrapolating back to a single cell division suggests that CLL is caused early in life, and perhaps has a genetic origin. Therefore, in studies of leukemia caused by an external agent such as radiation, it is usual to exclude CLL (BEIR
1990; Cartwright and Bernard 1987).
H o w e v e r , there have been many searches for clusters, particularly of leukemia, from a suggestion that leukemia, and in particular childhood leukemia, might have a viral origin (Smith 1982). Darby and Doll (1987) also addressed this idea. For a long time, leukemias have been known to cluster without an obvious cause, an effect that suggests that the origin might be an infectious disease. For example, the first child in a family is much more likely to get childhood leukemia than later ones. A particularly interesting phenomenon was noted by Smith, et al. (1985). One way of curing leukemia is to destroy blood cells and bone marrow by heavy radiation exposure. Then, new blood can be provided by a blood transfusion, preferab- ly from a twin. Smith et al. (1985) noted the occur- rence of leukemia in a patient with new bone marrow well after the treatment by whole body irradiation.
124 Shihab-Eldin et al. 20" "~ 15
!
3 10 o " 0 e - 1968 A 1970 19'72 1974 ' 1976 1978 19:80 19~2 I ~ I year 211 15 v,- ~ 10 ¢s o -e 1 9 6 8 1970 1972 19'74 1 976 19'78 1 ~ 0 1 ~ . 19~4 year 20-.t!_
o 1,5 .z @ '1o 0 1968 \ ', ,, , : , ~ . . . Q ; , stal]sl]cal uncertainty given by size of the error bars' 19'70 ' 19'72 1974 ' 19'76 ' 19'78 ' 19~0 1 ~ . ' 1~34 year
I
---~-. Massachuse~s --B- Plymouth County ~ Town of Plymouth ]Risk of radiation 125
i
r - U t v .CI 1968 1970 ' 1972 ' 1974 A A year v - v ; ' ~ e 1 ; 7 0 1972 1 ~74 ' 1 ~Te year C2~t.... " e 2 ~ . . . --*-"E22~ " ' " " ~ 2 ~ - . . , " ' 1 1 ~ , - i ~ . , l m " " ~ . . . . . . D r ~ v - v ° ~ e 1~70 ' 1~72 ' 1~/74 ' l d 7 e ' 1 ~ 7 e year ' l~eO ' 1 ~ e 2 ' 1~e4--~-- Massachuselts - ~ - PMnoutl~ County ~ Town of Pb/mouU3 [
126 Shihab-Eldin et al.
This is consistent with a viral origin for the leukemia. Some earlier suggestions that clustering occurred are usually attributed to biased post hoc selection of boundaries for the grouping of leukemias (Glass et al. 1968).
Few clusters of cancer or leukemia survive as real (i.e., not due to statistical f l u c t u a t i o n ) clusters when the data was subjected to careful screening and analysis. Jablon et al. (1990) of the National Cancer Institute (NCI) of the U.S. have carried out a comprehensive analysis of leukemia and cancer in- cidence at the county level around all nuclear plants in the U.S. and found no significant effect. They noted a deficit of leukemias in Plymouth county which contains the Pilgrim Nuclear Power Plant.
Finally, we reiterate that real (nonstatistical fluc- tuations) leukemia or cancer clusters can occur randomly without an apparent cause. Such random clusters, it appears, do not discriminate between nuclear or non-nuclear facilities. In a blind attempt to study l e u k e m i a c l u s t e r s , l e u k e m i a around 14 military sites in England was studied. Clusters were found around two of them. When the identity of the two military sites was released to the study group, it turned out that the sites were medieval castles. (Cehn and Sagan 1988). It is unclear whether the study group was influenced by the statement that they were military sites.
LEUKEMIAS NEAR PLYMOUTH, MASSACHUSETTS Cobb (1987) noted that the number of leukemias in certain counties in southeastern Massachusetts was larger than expected. He asked whether they could have been caused by the Pilgrim Nuclear Power Plant. Cobb postulated a certain pattern of coastal circula- tion of the air within 2-4 miles (3-4 km) of the coastline (Clapp et al. 1987). In his testimony in front of the Joint Committee of Energy of the Common- wealth of Massachusetts, he stated that, "It is easy to imagine how an injection of pollutants to the middle of such a pattern might be contained and carried along the coast." However, detailed measurement shows that winds do not follow the postulated pattern (Stone and Webster 1988). A more detailed listing of leukemias in Plymouth county has been carried out by Rothman et al. (1988) (Tables 1 and 2). In these tables, the expected number is based upon state-wide statistics.
Table 1 shows a small excess of leukemia (exclud- ing CLL which, as noted, is not caused by radiation) for the years 1982-84 in the five coastal towns closest to Plymouth. This is barely statistically significant, and the significance vanishes when more years are included. This is shown more clearly in Table 2 from Rothman et al. Moreover, we know of no postulated reason, other than the impossible one, that they are due to the wind-borne radioactivity. However, an
Table 1. Observed and expected incidence of Leukemias other than chronic lymphocytic leukemia in three groups of Massachusetts
towns, 1982-1986'. Data from Rothman et al. (1988).
F i v e C o a s t a l T o w n s b
F i v e T o w n s
C l o s e s t t o P l y m o u t h c P l y m o u t h C o u n t y d
Y e a r s O b s Exp. S M R 9 5 % C I Obs. Exp. S M R 9 5 % CI O b s . Exp. S M R 9 5 % C I
1 9 8 2 - 8 4 27 1 7 . 0 1 . 5 9 1 . 0 5 - 2 . 3 1 13 1 2 . 2 1 . 0 6 0 . 5 9 - 1 . 7 8 63 7 3 . 8 0 . 8 5 0 . 6 6 - 1 . 0 9 1 9 8 5 - 8 6 6 1 1 . 8 0 . 5 1 0 . 2 1 - 1 . 0 6 6 8 . 6 0 . 7 0 0 . 2 8 - 1 . 4 5 36 4 7 . 5 0 . 7 6 0 . 5 3 - 1 . 0 5 1 9 8 2 - 8 6 33 2 8 . 8 1 . 1 4 0 . 7 9 - 1 . 6 1 19 2 0 . 8 0 . 9 1 0 . 5 7 - 1 . 4 0 99 1 2 1 . 3 0 . 8 2 0 . 6 6 - 0 . 9 9 " A b b r e v i a t i o n s : O b s . , o b s e r v e d c a s e s ; E x p . , e x p e c t e d c a s e s ; SMR, s t a n d a r d i z e d m o r t a l i t y r a t i o ( O b s . / E x p . ) ; CI, c o n f i d e n c e i n t e r v a l (by e x a c t m e t h o d ) . b D u x b u r y , K i n g s t o n , M a r s h f i e l d , P l y m o u t h a n d S c i t u a t e . c C a r v e r , D u x b u r y , K i n g s t o n , P l y m p t o n a n d P l y m o u t h . d 27 t o w n s , i n c l u d i n g a l l t h o s e i n t h e o t h e r t w o g r o u p s .
Risk of radiation 127
Table 2. Observed and expected mortality from leukemias other than chronic lymphocytic leukemia in three groups of Massachusetts towns, 1969-1986'. Data from Rothman et al. (1988).
F i v e C o a s t a l T o w n s b
F i v e T o w n s
C l o s e s t t o P l y m o u t h ¢ P l y m o u t h C o u n t ~ l e s s 5 T o w n s
O b s . E x p . S M R 9 5 % C I O b s . Exp. S M R 9 5 % C I Obs. Exp. S M R 9 5 % C I O b s . E x p . S M R
Y e a r s 1 9 6 9 - 7 2 17 1 7 . 3 0 . 9 8 0 . 5 9 - 1 . 5 4 I0 1 0 . 9 0 . 9 1 0 . 4 7 - 1 . 6 4 86 8 7 . 1 0 . 9 9 0 . 7 9 - 1 . 2 2 7 6 7 6 . 2 1 . 0 0 Y e a r s 1 9 7 3 - 7 6 14 1 9 . 3 0 . 7 2 0 . 4 1 - 1 . 1 9 7 1 2 . 9 0 . 5 4 0 . 2 4 - 1 . 0 7 80 9 0 . 7 0 . 8 8 0 . 7 0 - 1 . 1 0 73 7 7 . 8 0 . 9 4 Y e a r s 1 9 7 7 - 8 0 18 2 1 . 2 0 . 8 5 0 . 5 2 - 1 . 3 2 13 1 4 . 6 0 . 8 9 0 . 5 0 - 1 . 4 8 79 9 4 . 2 0 . 8 4 0 . 6 6 - 1 . 0 5 66 7 9 . 6 0 . 8 3 Y e a r s 1 9 8 1 - 8 6 34 3 5 . 5 0 . 9 6 0 . 6 6 - 1 . 3 4 2 6 2 5 . 0 1 . 0 4 0 . 6 8 - 1 . 5 2 128 1 5 2 . 0 0 . 8 4 0 . 7 0 - 1 . 0 0 102 1 2 7 0 . 8 0 Y e a r s 1 9 7 7 - 8 6 168 2 0 6 . 6 0 . 8 1 ' A b b r e v i a t i o n s : O b s . , o b s e r v e d c a s e s ; E x p . , e x p e c t e d c a s e s ; S M R , s t a n d a r d i z e d m o r t a l i t y r a t i o ( O b s . / E x p . ) ; CI, c o n f i d e n c e i n t e r v a l (by e x a c t m e t h o d ) . b D u x b u r y , K i n g s t o n , M a r s h f i e l d , P l y m o u t h a n d S c i t u a t e . c C a r v e r , D u x b u r y , K i n g s t o n , P l y m p t o n a n d P l y m o u t h . a 27 t o w n s , i n c l u d i n g a l l t h o s e in t h e o t h e r t w o g r o u p s .
interesting fact emerges upon which Rothman et al. did not comment. If we add a fourth group of three columns to Table 2 for Plymouth County less the five towns close to Plymouth, a marked deficit appears after 1977. For the period 1977-86, 168 leukemias were observed, with 207 expected. The deficit of 39 is over twice the standard deviation of 2"~~'= 14, and therefore significant (Wilson 1991). In a nationwide study of leukemias near nuclear power plants, carried out at a country level, Jablon et al. (1990) also noticed the deficit of leukemias in Plymouth County.
Morris and Knori (1990) performed a case-control study of leukemias near Plymouth, using a complex score of closeness to Pilgrim as a surrogate for ex- posure level. Table 3 shows the data for cases diag- nosed between 1978 and 1986. Since these are the same cases already discussed, a similar difference between close to Plymouth and far from Plymouth is expected. A statistically significant difference is in- deed found. Since the previous data and reports al- ready suggested an effect of the same magnitude as found in this study, it is hard to understand the state- ment on page (vi) of the summary of Morris and Knori, "These (earlier) findings are somewhat incon- sistent with those of this investigation."
Morris and Knori further subdivided the data into the periods 1978 to 1981, 1982 and 1983, and 1984 to 1986, and find an effect only in the first two. This is surprising, because our simple calculation in Table 2 shows an e f f e c t persisting in 1984-86. Moreover, the Pilgrim plant only began operating after 1973. If it is hypothesized that the radiation from the plant immediately after startup caused leukemias, they would be expected to continue to occur from 1978 through 1993; and there is no valid reason for excluding the years 1984 to 1986 in this analysis. To make such an exclusion without a valid reason makes the statistical calculations invalid.
Even if it is accepted that there is an association between leukemias and something in Plymouth, a causal connection can only be accepted if there is a cause. The reported release of radioactivity materials from Pilgrim were never enough to cause measurable r a d i a t i o n l e v e l s a b o v e the n a t u r a l b a c k g r o u n d radiation level and could not therefore have caused measurable cancer increase above background can- cer levels. This is a robust conclusion and is inde- pendent of any particular relationship that is assumed between radiation dose and leukemia incidence. Anyone suggesting that Pilgrim was the cause of any of these leukemias must therefore postulate unreported
128 Shihab-B1din et al.
Table 3. Results of matched case-control analyses: Estimated relative risks' ofleukemia by exposure level; both sexes combined; cases 1978-1986.
Exposure Score Cases Controls O.R. (CI)
low (<.030) 18 56 1.00 (0)
medium (.030-.199) 50 106 1.97 (0.99, 3.95)
high (.2+) 37 46 3.89 (1.74, 8.68)
Total 105 208
chi square trend - 11.38 p-O.O01
aOdds ratios presented are controlled for age, sex, vital status, year of death, socioeconomic status, smoking status, occupation and industry
(Table 2 of Morris and Knori, 1990)
and unmeasured release of radioactivity far exceed- ing the reported levels. Indeed, an examination of the BEIR V report (BEIR 1990), suggests that the ex- posure must be 200 rein to each individual to quad- ruple the leukemia rate. If such unreported releases occurred (and that is very doubtful), they should be stopped. But they would not be stopped by the DPH recommendation to reduce the regulatory limit from its present value of 25 mrem. They must also postu- late another reason for leukemia to be decreased overall (independent of location), so that the releases appear to leave the number of leukemias near Plymouth unchanged, while reducing them further away.
In this example, Dr. Sydney Cobb should be praised for raising the question and postulating an explana- tion, even though this explanation was subsequently shown to be invalid (see also peele 1988). However, the report by Morris and Knori was publicly released by the Massachusetts Department of Health in a press conference and television appearances by the Deputy Commissioner of Health (not the authors) just after his budget was cut. The budget was quickly restored. We must also be aware that another large power plant exists nearby, contrary to one of Stornglass' claims that the only industrial facility near Plymouth is the Pilgrim Nuclear Power Plant. This is the Canal Station, which is fossil fuelled (see Fig. 4). The releases from the Canal Station are of a different type of material, but there is as much reason for attribut-
ing the increase in leukomias to them as to Pilgrim. A little further away is another large coal-burning power plant at Somerset. This is upwind. It is well known that coal-burning plants emit radioactive material. The Somerset plant spews more long-lived radioactivity over the counties around Plymouth than does the Pilgrim plant (see, for example, Tables 5-6 and 5-7 of Wilson etal. 1981).
DID THE CHERNOBYL ACCIDENT INCREASE U.S. MORTALITY?
Two reports by Gould (1986; 1988) have boon widely publicized. In the first of these reports, Gould e t a l . (1986) endeavor to see whether increases in overall mortality, total cancer mortality, and changes in fetal or infant mortality can be related, firstly to the presence of nuclear power plants in the state, and secondly to the radioactivity releases from these power plants. As an exploratory study, this is ap- propriate; but the words imply that the study is more than exploration. We shall assume that the arithmetic calculations are correct, and discuss whether or not they make their case. A statement such as "it is clear that emissions in the nuclear counties have an ad- verse effect on mortality particularly among the very young and very old" implies causality. We believe that neither this statement, nor the title "Nuclear emissions take their toll" is close to being justified.
Gould ot al. first compare Infant Mortality Ratio (IMR), Total Mortality Ratio (TMR), and Cancer
Risk of radiation
ATLANTIC
OCEAN
129PILGRIM I
SOMERSET PLANT
\
\
Plymouth Carver WarehamCANAL STATION
Fig. 4. Map of coastal area around Plymouth.
Mortality Ratio (CMR) for nuclear states and non- nuclear states both for the years 1965-69 and 1975- 82. They suggest, reasonably, that effects of nuclear plants would not be present in the earlier period. These are summarized in their Tables 3 and 4. They then note that the infant mortality ratio has fallen less in nuclear states (-3.95% annual rate) than in non- nuclear states (-4.33%) although the infant mortality ratio was still less in 1975-82 in nuclear than non- nuclear states. This is also true of total mortality. Gould et al. claim that cancer mortality increases in the nuclear states more than in the non-nuclear states and is larger in both time periods. They claim, and
we have not checked, that these differences are statis- tically significant.
Gould et al. do note that "there is no clearly defined tendency evident in Table 2 of Gould et al. among each of the so-called nuclear states to have increases in mortality that exceed those of the na- tion" (Gould et ai.1986, p. 5, first column). Another way of saying the same thing would be to say that the infant mortality declines are not distributed about the mean in a statistical manner and this, therefore, calls into question their use of the statistical criteria based solely on the number of persons and cases. One crude way of correcting for this would be to use the ob-
130 S h i h a b - E l d i n e t al.
served fluctuations in these parameters among nuclear states and the observed fluctuation in non-nuclear states instead of the square root of the number of cases. Then the statistical s i g n i f i c a n c e probably vanishes. Thus, the only valid conclusion from the data that make up their Tables 3 and 4 is that while the data are consistent with the assumption made, they are very far from proving it.
Presumably because they recognize this, Gould et al. go on to look in closer detail at counties within 30 miles (50 kin) of a nuclear power plant. Again a slight difference is found. It is just significant (the probability that it is due to chance is less than one in 20), but Gould et al. do not ask how consistent this difference is among the various counties and we must again ask whether there are other causes of fluctuation than the square root of the number of cases. Thus the statement "it is clear that emissions in the nuclear counties have an adverse effect on mortality" is patently false.
Gould has been selective in his choice of items to consider. Just one illustrates a fluctuation in the op- posite d i r e c t i o n from G o u l d ' s argument. BWRs release more radioactive xenon than do PWRs (as noted in Gould's Table 5). Yet the increase in cancer mortality from 1965-69 to 1975-82 (1.140) is less than that for PWRs (1.230) and less than the increase for non-nuclear counties.
In the report, Gould et al. mention the radioactive noble gas releases, but do not discuss them or use them in a correlation. Yet, in any assumed relation of health effects to nuclear power plants, the releases must be more directly related to the health effects than the mere existence of the power plant itself.
Even if consistency and statistical significance were clear, all the other issues in Hill's list would have to be addressed. There may be a real correlation between one of the public health parameters and nuclear power plant location, but it is not necessarily a causal correlation.
If, for example, we compare the number of nuclear power plants in the country with expectation of life in that country, it is obvious that the expectation is higher in the U.S. with its many power plants than in Africa which has none. A priori, this increase of life expectancy near nuclear plants is as likely to be a direct causal relationship as the one Gould et al. propose. Few people believe that the nuclear power plants are a direct cause of the longer life expecta- tion, however, and attribute the causal relationship to nutrition and good health care. These are related to prosperity, just as nuclear power plants are related
to prosperity, and prosperity is closer to being the true cause.
As one delves more deeply, Gould's case becomes even weaker. Although not explicitly stated by Gould, it seems that he is endeavoring to attribute the cause of mortality to an assumed radiation dose to human organs. Ideally, therefore, one would correlate can- cer incidence with radiation dose. This information is hard to get, but one can imagine using human exposure, and calculate the dose to various human organs from the exposure. Radioactivity releases have been measured, and we know how to calculate ex- posure from releases. It is then easy to see that the radiation exposure will in all cases be much less than the natural background and less than the fluctuation and changes in natural background. Unless Gould et al. are prepared to claim and substantiate that the radioactivity releases have been grossly understated, or that we do not know how to calculate exposure from release, any case for causality stops at once.
Having shown that the statistical case Gould et al. present is weak and inconsistent, and that it's not plausible based upon the comparison of dose and background dose, we now complete the picture by suggesting a number of other possible causes for the effects which are much more plausible than radia- tion.
1. For infant mortality, fetal mortality, and total mortality, Tables 4 and 5 of Gould et al. show that the rates in non-nuclear counties and states are now close to those in nuclear counties. This could be due to medical care catching up in rural states.
2. The larger cancer rates in nuclear states can be due to general industrialization.
In the second report, Gould (1988) was even less specific. He noticed that 33.06% of the 1986 deaths occurred in the U.S. during the months of May to August 1986 compared to 31.97% in earlier years. The difference claimed is small (although statistical- ly significant). It might have any of a number of causes. Gould chose to suggest iodine releases from Chernobyl Nuclear Power Plant.
Taking Gould's specific suggestion of the cause first, we note that this suggestion satisfies almost none of Hill's requirements. The only one satisfied is temporality; the suggested cause does precede the effect.
Taking just one other requirement, we note that the iodine doses and doses from other r a d i o n u c l i d e s around the world from the Chernobyl plant release have been measured. The average first year dose to the U.S. was about 1.3 mrem compared with 60 mrem average in Italy and 40 rem for the 24 000 between
Risk of radiation 131
Table 4. Consequences of a linear biological gradient in Gould's predictions.
United States
ist year dose
1.3 mrem(Gould)
Factor to multiply by
if effect proportional~ increase to dose
1.09 9
Italy 60 mrem i 5.2 420
Persons 3-15 k m from the plant
(not including Pripyat)
40 rein I 2770 277,000
* all in i w e e k before evacuation. I Calculated here
3 and 15 km from the power plant (excluding Pripyat) (Goldman et al. 1987). The difference of the 1986 mortality in the US (33.06%) and the 1985 mortality (31.97%) is about 3%. If this was due to radioactivity from Chernobyl, and we assume linearity with dose, there would have to be a 415% (5.2 times the natural rate) effect in Italy and 2770 times bigger (2770 times the natural rate) in the area immediately d o w n w i n d of the Chernobyl power plant. As shown in Table 4, these have not been seen. Thus, the claim fails com- pletely on the question of "existence of a biological gradient." This argument by itself should be enough to discredit the whole discussion. However, it was not enough to stop the Wall Street Journal dignifying Gould's claim by saying, in a column, that it had caused scientific controversy.
A Seattle newspaper was better (News Tribune 1987). It discussed a part of this claim--that cancers in the state of Washington were caused by Cher- n o b y l n a n d clearly made the above point. Starzyk (1987) noted that mortality only rose 2% in summer 1986, not 9% as was alleged. This was not an unusual increase. Moreover, five traditional medical causes for summer increases have been identified: infec- tious disease, arteriosclerosis, chronic lung disease, suicide, and diabetes.
However, a more direct refutation of Dr. Gould's claim came from a Los Angeles Times reporter (Steinbrook 1988) who noted that Gould had used incomplete numbers. The 33.06% that Gould had stated as the fraction of U.S. deaths between May and August 1986 was incorrect. A more precise number is 32.2%, which is "identical to the data for the summer of 1984, and consistent with normal seasonal mortality patterns. The 1985 rate was 31.6%."
Another study (Brancker 1988) found no effect in Canada, although the effect on Canada should have
been similar to that on the U.S. if Gould et al. were correct. In Canada, deaths from infectious diseases remained steady, while death rates among 25-34 y olds and among infants fell.
THE PORTSMOUTH SHIPYARD PROBLEM
In 1977, a Boston physician became concerned that there was an unusual number of cases of leukemia among workers from the Portsmouth Naval Base and suspected that radiation might be the cause. With the help of reporters from the Boston Globe, he searched through over 100 000 death certificates. He con- cluded that there were 22 leukemia deaths, whereas 5 should be expected using ordinary death rates. In a later scientific report (Najarian and Colton 1978), he changed this to 20 cases of leukemia and other neoplasms of lymphatic and hematopoietic tissue with 10 expected. Dividing these into cases among nuclear workers and non-nuclear workers on the basis of whether the worker wore a radiation badge, the difference in cases between the two groups is 10 with 2.9 expected from the numbers in the groups (Table 5). Later it appeared that of the ten nuclear cases, two had no radiation exposure. The effect was getting smaller as the data collection improved. Finally, G r e e n b e r g et al. (1985) s h o w e d that there was considerable under-reporting and misreporting of cases.
Najarian's observation was published in the medi- cal literature (Najarian and Colton 1978), as is ap- propriate, even for case reports where statistical relevance has yet to be determined. But, he also publicized his findings in the press (Boston Globe 1978) in a way to arouse anxiety rather than infor- mation, and in Congress in a way that aroused disapproval, even of liberal representatives. Con- gress requested a study by the National Institute for
132 Shihab-Eldin et at.
Table 5. Observed and expected cancer deaths among nuclear and non-nuclear workers by type of c a n c e r .
Nuclear Non-Nuclear
Malignancy O E O/E O E O/E
Leukemia 6 i.i 5.62 2 2.8 0.71
Other neoplasms of lymphatic and
haematopoletlc tissues 4 1.8 2.26 6 4.3 1.41 All other malignant 46 28.6 1.61 80 72.6 i.i0 neoplasms
T o t a l 56 3 1 . 5 1 . 7 8 88 7 9 . 7 1 . 1 0
(from Table II of Najarian and Colton, 1978) O - Observed cases E - Expected cases
Occupational Safety and Health (NIOSH). A detailed study was made (Rinsky et al. 1981) which found no statistically significant increase of leukemia among the shipyard workers. No effect was found in a sub- sequent case-control study either (Stern et al. 1986). A number of possible sources of bias were dis- cussed in a later paper by Greenberg et al. (1985). These include:
1. The healthy worker effect. Workers are more healthy than the average member of the population, so that comparing the deaths with those expected can understate the effect.
2. Selection bias--which could occur in the selec- tion of cases.
3. Measurement bias--which could result from a misclassification of the occupational exposure of those who died.
A more recent follow-up (Rinsky et al. 1988) found a slight increase of lung cancer among the workers that was not statistically apparent in the first study. Many questions still arise. Can the increase be at- tributed to the Portsmouth shipyard7 If it can, what about the shipyard could have caused the effect? Ninety percent of lung cancers are attributable to cigarette smoking, and cigarette smoking history is not detailed on death certificates, so that corrections for variation are hard to make. Rinsky et al. con- eluded "This... suggests that radiation workers were more heavily exposed to asbestos and/or welding fumes than were other workers and that these exposures confounded the observed association between radia- tion and lung cancer."
Radiation per se is not known to be a major cause of lung cancer (although inhaled radon gas is), so that the original suggestion that radiation releases caused
the cancers is not biologically plausible. Asbestos exposure does cause lung cancer, especially syner- gistically with cigarette smoking, and asbestos is common around ships and shipyards, so that asbestos may be a likely cause of the increase. This raises a question; why did Najarian immediately claim radia- tion as a cause of lung cancer when there were other, more plausible, causes?
Najarian has not accepted the criticisms implied in the NIOSH reports, nor those explicitly made by Hamilton (1983). His last comment there suggests a reason for the concern which led to the article. "One wonders also how these risk estimates (if confirmed with other studies on similarly exposed people) might alter the thinking of those who are planning survival from nuclear war with similar product exposures."
After the Boston Globe article, there was testimony in Congress and the NIOSH investigation which cost over $I 000 000. When the results of this became known, Senator Kennedy, not known for his support of either military or civilian uses of radiation, p u b l i c l y condemned Dr. Najarian for unduly alarming shipyard workers and their families (Wermiell 1979). Other scientists were also critical (Hamilton 1983).
Cohen (1983) has discussed the way in which this case was discussed in the press. He noted that in 1977-8 there were 14 articles in the New York Times (several on the front page), mostly reiterating that there were a large number of excess cancers among the shipyard workers. In 1981, after the first NIOSH study was published, the New York Times published just one article.
Risk of radiation 133
LEUKEMIA AMONG THE HANFORD WORKERS In three papers, Mancuso, Stewart, and Kneale (1977) and Kneale, Mancuso, and Stewart (1981; 1984) claimed that there was an increase in leukemia and other cancers among those workers exposed to radiation (see also Stewart and Kneale 1991). They compared the estimated (occupational) radiation dose which had been accumulated for patients who died of cancer, with the radiation dose of those who died of other causes. The null hypothesis that these doses are the same was tested. They found that the mean radia- tion dose for those dying of cancer was 1.38 rad and that for those dying of other causes was 0.99 rad. The implication was that the increase of 0.39 rad over about 10 years was the cause of cancer. This held for eight categories of malignant cancers, namely: mul- tiple myeloma, pancreas cancer, brain tumors, kidney tumors, lung tumors, tumors of the large intestine, myeloid leukemia, and lymphomas. This increase was said to be statistically significant. (The probability is less than 0.05 that it could occur by chance.) From these data they derived very small doubling doses for these c a n c e r s .
Their work was reviewed by Gilbert and Marks (1979, 1980) Hutchinson et al. (1979), Hamilton (1980), BEIR (1980), Kleitman (1978), Mole (1977), Sanders (1978), and Speirs (1979), and more recently by Gilbert e t a l . (1989) who also studied mortality over an extended period 1945 to 1981. For example, Hutchinson et al. (1979) found a statistical bias in the estimation of doubling dose; and made several important corrections to the data for various associated variables; calendar year of exposure, interval be- tween beginning employment and exposure, interval between exposure and death, and age at exposure to age at death. When this was done, there wore two significant effects left; for myeloma and pancreas c a n c e r , but not for o t h e r c a n c e r s t h o u g h t to be radiogenic.
Kneale et al. (1984) grouped cancers into two groups; group A which are claimed to be cancers in tissues where previous studies had found that radia- tion produces cancers (radiosensitive tissues), and group B in tissues where radiation is not known to cause cancer (non-radiosensitiv¢ tissues). The ob- served number of cancers was smaller than expected at high doses for group B and more than expected at high doses for group A. Does this mean that radiation is sometimes good for you7 This unlikely conclusion is obviated by noting that there are several biases which can be collected together and are called the healthy worker effect. It is well known that employed people are healthier and have a lower mortality rate
than unemployed people. Employers tend to employ healthy workers and someone with a job eats better than someone without a job.
It was plausibly suggested (but without proof) that those who had high radiation doses were often professionals with higher income and probably better health. Then, it is the difference in the trend with dose between the A cancers and the B cancers that is important. Kneale ct al. related the reductions in group B with increased radiation, to a similar, more significant reduction in total death rate.
There may be another possible reason for finding spuriously significant results. The radiation exposure was measured by dosemcters and film badges, which were worn only at work, and therefore exclude most of the natural background exposures. If we omit radon exposure, and ignore any discussion of the lung can- cer that radon might produce, the average radiation exposure at sea level is about 100 mrcm, plus 95 mrem x-ray exposure (Table 7 below). In a typical ten-year period, this is 2 rem; comparable to the typical oc- cupational radiation exposure and greater than the 0.39 rem difference between cancer victims and others. Kneale et al. believe they made proper correction for this using the socioeconomic indices. In principle, the comparison of exposed with noncxposed workers corrects for this, if the background and medical ex- posures are the same in each group.
One obvious correlation exists. L a w y e r s and bureaucrats have often insisted on extra medical checks for radiation workers. One of us (RW) for example, was asked to take an extra chest x-ray for a summer job involving radiation. His film badge (deliberately worn during the x-ray) showed the highest reading for anyone in that laboratory. It is not possible to correct accurately for effects such as these now. But an estimate can be made that in the early days of Hanford, photofluorographic exposures of about 600 mrem per year were given (presumably to those working in radiation areas). This exceeds 15-fold the increase in radiation doses. In such cir- c u m s t a n c e s , it would seem mandatory to discuss whether these background environmental and medi- cal exposures are indeed correlated with the workers' exposure and can bias the data.
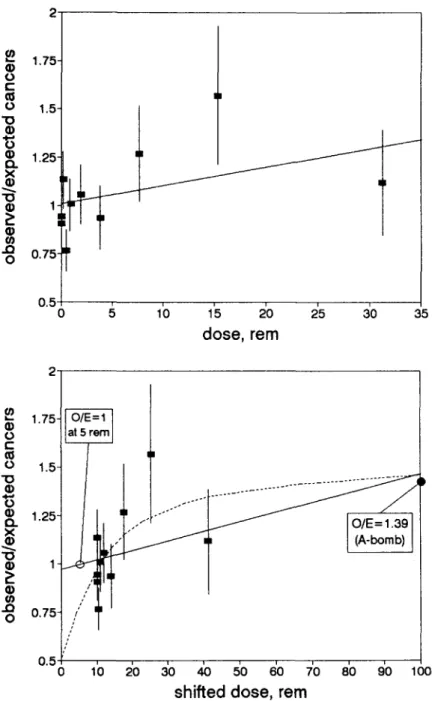
We plot their data in Figs. 5 and 6. Figures 5 a and b show the ratio O/E (observed cancers/expected cancers). The statistical uncertainty is also plotted. The computer-fitted line was calculated without con- sidering these error bars, and assuming that all points arc equally weighted--which is approximately true. Although this line goes through more than 2/3 of the error bars (which is all that is required of an adequate
134 S h i h a b - E l d i n et al. 1.5 19 ~ 1"375] 0 c 1.25]] I nO 1,12 19
-
l r
"10 0.875 I 19 P 0.75 ..Q 0 0 . 6 2 5 1 0.5t 0 5 1'0 i~ ~0 25 ~0 35 dose, rem 1.5 o) =- 1.25- (1) 0 t'- O5 0 1 "0 19 i "~ 0.75 Q. X 19 nO 19 0.5 P 19 ...0 0.25- 0 0 o ~lb
1'5
2'0 2'5 3'0 35 dose, rem Fig. 5a and b. C a n c e r s a m o n g H a n f o r d w o r k e r s : a) R a t i o o f t h e o b s e r v e d c a n c e r s of r a d i o s e n s i t i v e t i s s u e to e x p e c t e d v s . d o s e ; b) Ratio of the o b s e r v e d cancers of n o n - r a d i o s e n s i t i v e t i s s u e to e x p e c t e d vs. dose.fit), we can see clearly the suggestion of Kneale et al. that the data points rise faster at low doses (Fig. 5a). Figs. 6a and b plot the data corrected for latency and other factors. Again 6a shows a possible rapid increase at low doses. But on 6b, we replot the same data against total dose, and not merely the occupa- tional dose. The origin is shifted to 10 rem, being 5 rem extra medical x-rays and 5 rem lifetime en- vironmental background. Since the expected num-
bers come from people with similar environmental backgrounds, the fitted curve should go through (or at least close to) O/E = 1 at 5 rem. Also on the plot is a point with O/E = 1.39 + 0.04 from a fit to the data for all malignant neoplasms in atomic bomb sur- vivors (Shimuzu et al. 1988 Table 2A). The fitted line is not a bad fit to the data, but Kneale et al.'s rapid increase starting at 10 rem (shown in a dotted line) now seems less plausible because a simple plot would
Risk of radiation 135 2- o t.- o " 0 G)
g
O. x " 0 P lID .ID 0 1.75- 1.5- 1.25- 1 0.75 0.5 0 1'0 1'5 2'0 ;~5 3'0 35 dose, rem .= ® to t - o "10 G) "6 ~) n "10 a) P ..Q 0 1.75- 1.5- 1.25- 1 0.75 0.5 0 O/E = 1.39 (A-bomb)lb
2'0 3'0 45 50 ~0 7'0 80 ~'0 100shifted dose, rem
Fig. 6a and b. Ratio of observed cancers of radiosensitive tissue to expected after correction: a) versus additional data; b) with dose scale shifted.
imply that half of all cancers are caused by radiation. However, we should consider this dotted line as a postulate for further study. Are other data consistent with this line? We return to this when we consider variation of cancer rate with natural background in Fig. 13.
There is one more feature of the Mancuso, Stewart, and Kneale analysis that deserves mention. The differences in Figs. 5a and b between cancers of radiosensitive tissue and non-radiosensitive tissue used an old, inaccurate, ICRP c l a s s i f i c a t i o n . If
the effect is really due to radiation, this difference should increase when a more modern classification is used. Oral statements have been made at conferen- ces that the effect vanishes. This should be docu- mented.
The residual effect of pancreas cancer is shown in Fig. 7 where the Mancuso analysis (open circles) is compared to data among Japanese atomic bomb sur- vivors. It is hard to relate it to radiation because pancreas cancers are only weakly caused by radiation (Shimuzu et al. 1988 Table 2a). As shown in Fig. 7a,
136 Shihab-Eldin et al. 0 E 5- 4" 3 - 2- Mancuso st al.
Y
0 50 1 O0 150 200additional dose, rem
>2O0 250 300 350 400 450 500 5- 0 E Mancuso et al. 2- > 2 0 0 J = i l i Vo 5'0 250 3o0 350 400 45o 500
total dose, rem
Fig. 7a and b. Mortality from cancer of the pancreas among Japanese A-bomb survivors (open squares), among Hanford workers (filled circles), and according to Mancuso analysis. Points labeled 200 represents the average of all data above 200 rein from Cohen (1983).
the e f f e c t might be real but when the dose scale is shifted to give the total dose as in Fig. 7b, the dotted c u r v e b e c o m e s even less plausible.
DOES P L U T O N I U M FROM ROCKY FLATS CAUSE EXCESS C A N C E R ?
T h e R o c k y Flats facility, 15 miles (25 km) N W o f Denver, is used to m a c h i n e plutonium for manufac- ture o f U.S. nuclear weapons. As p l u t o n i u m metals are machined, fragments can catch fire and vaporize.
E x t r e m e care must be, and is, t h e r e f o r e , taken. How- ever, two fires b r o k e out in 1957 and 1969, and although they were c o n t a i n e d , plutonium was f o u n d to have c o n t a m i n a t e d the soil in regions SE o f the facility towards, and including, D e n v e r from an oil c l e a n u p in 1968. Fig. 8 shows the distribution o f this c o n t a m i n a t i o n .
Johnson (1981) and Chinn (1981) e x a m i n e d c a n c e r rates in these areas for the years 1969-1971, and f o u n d that total c a n c e r rates in the areas c l o s e s t to
Risk ofradiation 137
A
C A N C E R INCIDENCE IN R E L A T I O N T O R O C K Y FLATSO.
ImCilKat
II
. . . b ' o mcosx,, t0.:~
mCilKn• "t AREA
i •- , / J
t." I ~ nosy
J'..:,Z__.AREA
~ ~"%'N~I
FlitSplaM
""
/
~'..%%N%.%1,.,... AREA I ~ ~ [ ' 1 ~ " / (
~
~ - "
e l o e e o , e l e o o ~ • • _ _ _ • D E N V E R ~"==" mb - ~ . 1 " e o e I I b K•
8o. c~#sl ;
AREA IV
, o . .
/
/.
Ill
0 610
i
i
I
.SCALE:Miles
Fig. 8. Map of area around Denver and the Rocky Flats plant showing plutonium-in-soil isoconcentration areas.
the plant (area 1) were 24% higher for males and 10% higher for females than in areas of the Den- ver area further away. He attributed the increase to plutonium.
Plutonium is an alpha emitter, and the cancers should, therefore, arise close to where the plutonium is absorbed--the lung, if it is inhaled, and the liver and bone, if it is absorbed. One should expect more plutonium in the bodies of those with cancer than in others. Also, we should expect the trends to be found at other time periods.
C