Interactive and non-interactive pictures in multimedia learning
environments: Effects on learning outcomes and learning efficiency
Thorsten Rasch
*
, Wolfgang Schnotz
Department of General and Educational Psychology, University of Koblenz-Landau, Campus Landau, Thomas-Nast-Strasse 44, 76829 Landau, Germany
Abstract
New technologies enable flexible combinations of text and interactive or non-interactive pictures. The aim of the present study was to investigate (a) whether adding pictures to texts is generally beneficial for learning or whether it can also have detrimental effects, (b) how interactivity of pictures affects learning, (c) whether the visualization format of pictures affects the structure of the learner’s mental model, and (d) whether the visualization format modifies the effects of interactivity. One hundred university students were randomly assigned to five groups. In four groups, a text about the different daytimes and days on the earth was combined with interactive or non-interactive pictures of different visualization formats. In the fifth group, the text was presented without pictures. According to the results, adding pictures to text was neither beneficial nor harmful for learning. In terms of learning efficiency, however, learning fromtext onlywasmoresuccessful than learning from text and pictures. Interactivity was beneficial for one learning task, but not for the other task. The visualization format affected participants’ interaction with pictures, but not the learning outcomes; however this effect was not influenced by interactivity. Implications for multimedia design and for further research are pointed out.
Ó2009 Elsevier Ltd. All rights reserved.
Keywords:Multimedia learning; Interactivity; Animation; Learning efficiency; Learning from text; Learning from pictures
1. Introduction
A recent development in multimedia learning environments is the use of interactive animations. Whereas any element of an external representation can be animated, the most frequent usage of animation is the display of dynamic pictures. Animations that display dynamic pictures can serve various purposes: They can present an object from different perspec-tives and so enhance 3-D perception, convey procedural knowledge, and demonstrate the dynamics of phenomena. In interactive learning environments, learners can manipulate the characteristics of a picture’s dynamics by changing specific parameters such as speed or direction of movements (cf. Rieber, 1991). Animation is the cutting-edge of today’s multimedia learning environments and many media designers
seem to be convinced that animations are instructionally more powerful than static pictures. However, the empirical findings are mixed, and we are still at the beginning of understanding under which conditions and why animations in general, and specifically interactive animations, can (sometimes) enhance comprehension and learning more than static pictures (Lowe & Schnotz, 2008; Tversky, Morrison, & Betrancourt, 2002).
In the present article, we are analyzing the effects of interactive pictures on learning following three steps. First, we will analyze whether adding interactive or non-interactive pictures to texts is beneficial for learning or whether it can also have detrimental effects on learning outcomes and learning efficiency (cf.Mayer, 1997, 2001, 2005; Sweller, 1999, 2005; Verhoeven & Graesser, 2008). Second, we will investigate whether and in what respect learning with interactive pictures differs from learning with non-interactive pictures (cf.Kinzer & Verhoeven, 2008). Third, we will analyze whether the format of visualization used in pictures affects the structure of the mental models that are constructed in the mind of the
* Corresponding author. Tel.:þ49 6341 990223. E-mail address:[email protected](T. Rasch).
0959-4752/$ - see front matterÓ2009 Elsevier Ltd. All rights reserved. doi:10.1016/j.learninstruc.2009.02.008
learners and whether this format modifies the effects of interactivity.
In what follows, a theoretical framework for analyzing how adding interactive or non-interactive pictures to text can affect the process of learning, how interactivity of pictures will influence this process and which role is played by the visu-alization format in learning from text and pictures is presented. Specific hypotheses about the effects of adding pictures to texts, about the effects of interactivity and about the effects of the visualization format are formulated. Then a learning experiment, in which the hypotheses were empirically tested, is presented. Finally, the findings in the light of the theoretical framework and in the light of other related research are discussed.
1.1. Theoretical framework 1.1.1. Adding pictures to text
Interactive animations in learning environments are usually combined with texts that describe or explain what is displayed in the animation. In this case, learning with interactive animation is an instance of multimedia learning. Although numerous studies have reported that students learn better from text and pictures than from text alone (Mayer, 1997, 2001), recent research has demonstrated that this so-called multi-media effect is not universal for static pictures, and it is even more unclear under which conditions adding an animation to a text will be beneficial for learning (Lowe & Schnotz, 2008; Segers & Verhoeven, 2009). Research in the framework of cognitive load theory has shown that if one source of infor-mation is fully intelligible in isolation for the learners, then unnecessarily processing an additional source of information without an additional benefit for understanding is only a waste of time and energy.Sweller and Chandler (1994)have called this ‘‘the redundancy effect’’. It occurs when students, who were not presented with redundant information, perform better after learning than students who were presented with redun-dant information. It follows that if a picture merely reiterates the information of the text, it is possible that the picture will hinder rather than enhance learning. Learning can then be enhanced by eliminating the redundant picture (Sweller, 2005).
Cognitive load theory makes a distinction between three kinds of cognitive load: intrinsic, extraneous, and germane load (see Paas, Tuovinen, Tabbers, & Van Gerven, 2003). Whereas the intrinsic load is due to the nature of the learning task, and the extraneous load is due to the format of instruc-tion, the germane load is due to the development of cognitive schemata (i.e., learning), which is also assumed to require working memory capacity (Sweller, van Merrie¨nboer, & Paas, 1998; cf. Kalyuga, 2009). The negative effect of redundancy on learning is often considered as an extraneous overload on working memory capacity, but can be interpreted more consistently as a result of wasting time and energy for pro-cessing information without a benefit in terms of deeper comprehension (Schnotz & Ku¨rschner, 2007). Interactive animations might impose additional requirements on the
individual, because manipulating the animation needs further working memory resources, which are no longer available for understanding the learning content (Sweller, 2005).
Besides redundancy, there might also be a trade-off between processing of text and processing of pictures as a possible reason why the multimedia effect does not apply under all conditions. For example, if pictures have been added to a text, the text is not necessarily processed as deeply any more as it had been processed without pictures. It is possible that the pictures replace the text to some extent in the process of comprehension and learning. In this case, the learner will use the pictures (at least partially) instead of the text, and the text will be processed less intensively than if it had been presented alone (Schnotz & Bannert, 1999).
A further reason why the multimedia effect does not always apply can be found in the meta-cognitive aspects of picture comprehension. Learners often underestimate the information content of pictures. They assume that a short look is sufficient to grasp the essential information and do not notice that they do not sufficiently understand the subject matter displayed in the picture. It might therefore be possible that learners show lower performance after reading a text with pictures than after reading the same text without pictures. (cf.Mokros & Tinker, 1987; Pettersson, 1994; Weidenmann, 1989).
1.1.2. Interactive animated pictures
Whereas static pictures include only structural (visuo-spatial) information, animated pictures entail structural as well as temporal information. This seems to make animations a good candidate for supporting the construction of dynamic mental models. However, presenting more information does not imply that learners will indeed grasp more information from animated pictures (Schnotz & Lowe, 2008). Whether animations are effective for learning seems to depend among others on the relation between perceptual and cognitive pro-cessing in mental model construction. Humans possess perceptual schemata that allow them to recognize complex dynamic patterns in their natural environment. For example, we can easily distinguish walking, trotting and galloping when horses are moving and we immediately perceive that a person limps because his/her foot is hurt.
Animation can trigger dynamic perceptual schemata based on our everyday experience such as, for example, schemata about natural biological movements. Thus, animations allow directly activating such perceptual schemata, which is not as easily possible with static pictures (Schwan & Riempp, 2004; Tversky, Heiser, Mackenzie, Lozano, & Morrison, 2008). With regard to understanding scientific content on a cognitive level, however, requirements of processing may be fundamentally different. Many studies in which animation did not turn out beneficial compared to static pictures were dealing with rela-tively abstract, scientific or technical content rather than concrete scenarios from everyday life (Lowe, 1996; Tversky et al., 2002). Thus, animations help constructing dynamic mental models. Due to their fleeting nature, however, anima-tions do not allow analyzing specific states that occur within the flow of dynamic events. It is well known that working
memory is limited in capacity and in duration when dealing with novel information. It can combine, contrast or manipulate no more than four information elements at one time (cf. Miller, 1956), and without rehearsal information in working memory is lost within about 20 s (Peterson & Peterson, 1959). Because there is quick loss of information in working memory, only very limited processing can be devoted to the single states within the animation. Animations are, therefore, possibly not beneficial if the learner is expected to compare different states within a dynamic event. Instead, displaying the corresponding states simultaneously with static pictures would provide a much better basis for this kind of requirements (Betrancourt, 2005; Schnotz & Lowe, 2008).
Within computer-based learning environments, animations can also allow the interaction between the learner and the animation. Interactive animations can permit the learner, for example, to manipulate the direction of movement, the speed of movement or to generate multiple snapshots of an object along its trajectory. On the one hand, interactive animations can be expected to be beneficial for learning under different aspects. They enable learners to adapt a dynamic display to the constraints of their perceptual and cognitive processing by speeding up or slowing down the rate of display. They also allow testing of hypotheses about processes under specific conditions by manipulating parameters accordingly, which stimulates deeper cognitive processing of the subject matter. Sometimes, interactive animations enable learners to perform cognitive processes by external support, which had otherwise been impossible for these learners, or they simply facilitate a process which would otherwise require high amounts of working memory capacity and would therefore be very difficult.
Schnotz and Rasch (2005) have distinguished two basic functions of interactive animations within the framework of cognitive load. If the animations reduce the cognitive load of tasks in order to allow cognitive processing that would otherwise be impossible, then animations have an enabling function. If they reduce the cognitive load of tasks that could otherwise be solved only with high mental effort, then animations have a facilitating function (cf.Amadieu, van Gog, Paas, Tricot, & Marine´, 2009; Ayres & Paas, 2007; Mayer, 2001; Sweller & Chandler, 1994; Sweller et al., 1998). On the other hand, manipulation of an interactive animation needs additional cognitive resources for decisions about which manipulation should be executed and additional search processes for the corresponding control panels, which requires additional atten-tion processes and working memory capacity. In other words, interactive animation can also impose additional cognitive load, which may ruin the advantages of interactivity.
1.1.3. Visualization format
When media designers visualize a specific subject matter by a static or an animated picture, they can frequently choose between different visualization formats. Two visualizations of different formats are considered asinformationally equivalent if all information that can be taken from the one visualization can also be taken from the other visualization (Larkin & Simon, 1987). Because static pictures include only structural
(visuo-spatial) information whereas animated pictures entail structural as well as temporal information, static pictures and animations cannot be considered as informationally equiva-lent. However, it is possible to develop informationally equivalent static pictures with different visualization formats, and it is possible to develop informationally equivalent animations with different visualization formats.
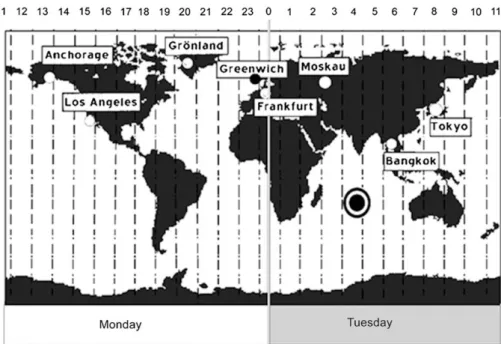
Let us assume, for example, that learners should understand why there exist different daytimes and different days simul-taneously on the earth. One possibility of visualization is shown in Fig. 1. In this picture, the earth is presented as a rectangle moving across a time axis like a kind of flying carpet. We call this kind of visualization carpet pictures. Another possibility of visualization is shown inFig. 2. In this picture, the earth is presented as a circle (or sphere) seen from the North Pole rotating counter-clockwise in a hull of different time states. We will call this kind of visualization circle pictures. The two pictures inFigs. 1 and 2can be considered as being informationally equivalent with regard to time differences between the depicted cities and with regard to different days on the earth. However, they can nevertheless differ in theircomputational efficiency, when extracting some specific information from one representation may be easier than extracting it from the other representation.
Schnotz and Bannert (2003) reported evidence that the structure of the visualization is mapped onto the structure of the mental model, which in turn affects the computational efficiency of the model for specific learning tasks. Accord-ingly, one kind of picture may be more effective to solve some tasks whereas another kind of picture is better suited to solve another task, even if the pictures contain the same information, and the same difference can be expected between the corre-sponding mental models (Schnotz & Ku¨rschner, 2008). By the same token, one can assume that interactive animations with different visualization formats can also be informationally equivalent, but different with regard to their computational efficiency. If the structure of a dynamic visualization is map-ped onto the structure of a corresponding dynamic mental model, which in turn affects the computational efficiency of the model for specific tasks, one animation may be more effective to solve some tasks whereas another animation may be better suited to solve other tasks, even if the animations contain the same information, and the same difference can be expected between the corresponding mental models.
As an example, imagine that individuals are expected to answer two kinds of tasks after learning, which we will call ‘‘time-difference task’’ and ‘‘circumnavigation task’’. With time-difference task, learners are asked about time differences between specific cities. Example questions are ‘‘What is the time and which day is in Anchorage if it is Tuesday two o’clock p.m. in Tokyo?’’ or ‘‘At which time and which day does a traveler arrive in Anchorage after an 8-hour flight, after he/she left Tokyo at two o’clock p.m.?’’ With circumnaviga-tion task, learners are asked to imagine traveling round the world as, for example, ‘‘Why did Magellan’s sailors believe that they arrived on a Wednesday after circumnavigating round the world, although it was already Thursday?’’
Although both kinds of questions can be answered with both kinds of visualization shown inFigs. 1 and 2, the visualizations differ in their computational efficiency of the two different tasks. On the one hand, carpet pictures seem to be well suited to answering time difference questions, because the (horizontal) spatial difference between two cities corresponds directly to their temporal difference. This does not apply to circle pictures: In a circle picture, small spatial differences can nevertheless be associated with high temporal differences (namely, if the date line is between the two locations). On the other hand, circle pictures seem to be well suited to answering circumnavigation questions, because traveling around the earth can be simulated as
a continuous circumnavigation. This does not apply to carpet pictures: In a carpet picture, the continuous movement of a circumnavigation around the earth has to be envisioned as a discontinuous movement, because the carpet has to be left on the right hand (or left hand) side and simultaneously re-entered at the opposite side.
1.2. Research questions and hypotheses 1.2.1. Effects of adding pictures to text
Our first research question was simply a replication of previous research on the effects on adding pictures to text, but
Fig. 1. Example of a non-interactive carpet picture.
included both non-interactive and interactive pictures. If the multimedia principle applies in both cases, adding pictures (whether interactive or non-interactive) should be beneficial for learning, which leads toHypothesis 1a: Students will learn better from text with interactive or non-interactive pictures than from text alone.
If the redundancy principle applied in both cases, adding interactive or non-interactive pictures (which reiterate what has been described in the text) should be harmful for learning, which leads to the alternative Hypothesis 1b: Students will learn better from text alone than from text with interactive or non-interactive pictures.
Both hypotheses are assumed to be generalizable for different visualization formats.
1.2.2. Effects of interactivity
Our second question was whether the effects of adding interactive pictures differ from the effects of adding non-interactive pictures. On the one hand, non-interactive pictures can stimulate more elaborated cognitive processing, because they can have an enabling function or facilitating function for the learner. Accordingly, one can assume that interactive pictures create additional germane load that results in better learning, which leads toHypothesis 2a: Interactive pictures will result in better learning than non-interactive pictures.
On the other hand, interactive pictures require additional cognitive resources, which are no longer available for learning. Insofar, as one can assume that interactive pictures create additional extraneous load which hampers learning, then the alternative Hypothesis 2b can be stated: Interactive pictures result in lower learning than non-interactive pictures. Both hypotheses are assumed to be generalizable for different visualization formats.
1.2.3. Effects of visualization format
Our third research question was whether the relation between the visualization format and the structure of the emerging mental model that has been found with non-inter-active pictures can also be found with internon-inter-active pictures. As mentioned above, the different visualization formats are assumed to have specific advantages and disadvantages for different kinds of tasks. In the case of the visualization formats presented in Figs. 1 and 2, this results in the following Hypothesis 3: There will be an interaction between visualiza-tion format and kind of task with regard to learning. Mental models based on carpet pictures will be more adequate for answering time difference questions than mental models based on circle pictures, whereas mental models based on circle pictures will be more adequate for answering circumnaviga-tion quescircumnaviga-tions than carpet pictures.
1.2.4. Learning outcome and learning efficiency
The hypotheses about the effects of adding pictures to text or adding interactivity to pictures mentioned above focus only on the results of learning. The underlying question is whether these instructional devices will stimulate more elaborated cognitive processing and therefore result in better learning
outcomes. However, one can also ask whether the investment of time and energy due to additional cognitive processing is well-balanced with the additional learning gains. It should be noted that the above-mentioned redundancy effect stressed by cognitive load theory emphasizes time as an aspect of learning. If a learner is unnecessarily processing an additional source of information without an additional benefit for understanding, he/she wastes time and energy. However, this is not necessarily harmful for learning outcomes. What is likely to be reduced by unnecessary information processing is the efficiency of learning, that is, the gain of knowledge or expertise per learning time. As long as learning efficiency is higher than zero, additional elaborative processing will always further increase learning outcomes. However, the increase can be so small that the additional effort invested in the learning process does not pay off well. We will therefore analyze learning in the following not only in terms of learning outcome, but also in terms of learning efficiency, that is, learning outcome per learning time.
2. Method
2.1. Design and procedure
The experiment followed a 222 design, with the first two factors as between subjects factors and the last factor as within subjects factor. There was also a control group. Thus, there were four experimental conditions and one control condition. The between subjects factors were Interactivity (interactive pictures vs. non-interactive pictures) and Visuali-zation Format(carpet pictures vs. circle pictures). The within subjects factor was Task (time-difference task vs. circum-navigation task). The control group received a text without any visualization. The experiment consisted of a pretest phase, a practice phase, a learning phase, and a posttest phase.
In thepretest phase, the participants were tested for general cognitive ability and for domain-specific prior knowledge.
In the practice phase, participants made themselves familiar with the handling of the learning environment. For this purpose a topic was presented that was unrelated to that used in the experiment. The practice phase served to reduce extraneous cognitive load caused by an unfamiliar learning environment as far as possible.
In the following learning phase, participants received a sequence of 10 questions in order to provide an orientation about the subsequent learning tasks. Five of these questions were related to time differences between different places on the earth such as, for example, ‘‘What is the time in Tokyo, if it is 3 o’clock p.m. in Moscow?’’. The remaining five ques-tions addressed time and date changes related to circumnavi-gations of the earth such as, for example, ‘‘Why did Magellan’s sailors believe that they arrived on a Wednesday after circumnavigating round the world, although it was already Thursday?’’ The students were informed that they would be finally tested for their comprehension with questions similar to the orientation questions. The ten questions were presented one by one on top of the screen. After the
participants had answered a question with the help of the learning, the next question appeared, which had to be answered in the same way, and so forth. Participants did not receive feedback whether their answers were correct in order to avoid a too strong task-oriented limitation of their explor-atory activities. They had unlimited learning time. Learning times as well as the interactive behavior of the participants were automatically recorded by the hypertext system. Besides, the participants could take notes on a sheet of paper, but they were informed that this option was only provided for learning support and would not be available in the posttest.
In thepost-test phase, participants were asked to apply their acquired knowledge in a knowledge test.
2.2. Participants
Participants were 100 university students from the psychology and education department. Of them, 59 students were females. Their mean age was 22.4 years (SD¼1.6). The students were paid 8 Euros for their participation. Participants were randomly assigned to five groups of same size (20 per group). The learning aim was the same in all groups, that is, participants should understand why there exist different daytimes and different days simultaneously on the earth. Participants did not have specific prior knowledge about this topic. The five groups received different variants of the learning material.
2.3. Measures
2.3.1. General cognitive ability
Participants were tested for general cognitive ability with the Intelligenz-Struktur-Test 70 (Amthauer, 1973), a highly standardized German intelligence test. The participants received scores for cognitive ability based on their test results. 2.3.2. Prior knowledge test
Prior domain-specific knowledge was estimated with a paper and pencil test that required the participants to answer five essay-type questions about concepts related to time phenomena on the earth, namely ‘‘local time’’, ‘‘zone time’’, ‘‘time differences between time zones’’, ‘‘simultaneous days’’, and ‘‘date line’’. The number of correct propositions across all questions was determined for each participant and considered as his/her prior knowledge score. Inter-rater agreement for prior knowledge was .84.
2.3.3. Knowledge test (learning outcome)
After learning, participants were asked to apply their acquired knowledge in a test consisting of 32 multiple-choice questions without further access to the learning material or their notes. The test included 16 time-difference questions (time-difference task) and 16 circumnavigation questions (circumnavigation task). There was no time limit imposed for answering the test questions. Example questions for each type of task have been given in Section 1.1.3. For each type of task, the number of correctly answered items was computed for each participant and
considered as his/her learning outcome score. Cronbach’sawas .72 for the time-difference questions and .68 for the circumnav-igation questions. It should be noted that not all students read all (hyper)text passages, which reduces consistency.
2.3.4. Learning efficiency
Learning efficiency was determined for each participant through the number of his/her correctly answered items in the Knowledge test divided by his/her learning time in minutes. 2.4. Learning material
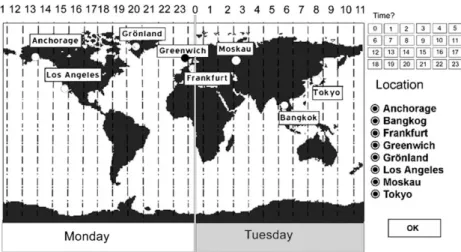
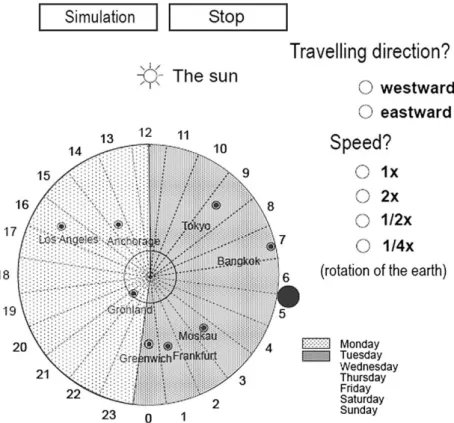
The learning material was a hypertext that included 22 cards (paragraphs) with 2750 words about time and date differences on the earth and about the results of circumnavigations around the earth. In the four experimental groups, different kinds of pictures were added to the hypertext. In the control group, the hypertext was presented without pictures. The learning material was pre-sented on a computer screen. The pictures were either interactive or non-interactive, and they used different visualization formats. The carpet picture shown above inFig. 1and the circle picture shown inFig. 2are examples of non-interactive pictures; there was no possibility for the learner to modify the picture by inter-action.Figs. 3 and 4present two examples of informationally equivalent interactive pictures called ‘‘manipulation pictures’’. Both interactive and non-interactive pictures enable learners to investigate a high number of different time states: a learner can define specific day-times for specific cities, and after clicking on the OK-button, the earth (carpet or circle) moves into the corre-sponding time state.Figs. 5 and 6present two other examples of informationally equivalent interactive pictures called ‘‘simula-tion pictures’’. These pictures simulate the earth’s rota‘‘simula-tion. The learner can choose between different directions and speeds a traveler could circumnavigate around the earth (symbolized by a black dot moving in western or eastern direction). After pressing the SIMULATION-button, the carpet earth starts moving along the time line or the circular earth starts rotating and the traveler’s dot starts moving on the earth.
3. Results
3.1. Initial analysis
There were no differences with regard to intelligence or prior knowledge between the five groups,F(4, 95)¼1.11,p¼.36, and F(4,95)¼1.29,p¼.28, respectively. Furthermore, there were no significant correlations between the participants’ general cogni-tive ability or prior knowledge and learning outcomes,r<.20. Accordingly, differences in participants’ prerequisites could be disregarded in the following analyses.
3.2. Learning outcomes and learning efficiency
Means and standard deviations of learning outcomes and learning efficiency scores within the five groups are presented in Table 1. A 5(group)2(tasks) ANOVA with the second factor as within subjects factor for learning outcomes revealed
no main effect for group, F(4, 95)¼1.22, p¼.307, but an interaction of group with task, F(4, 95)¼6.89, p<.001, partialh2¼.23. There was a significant main effect of group in the time-difference task,F(4, 95)¼3.72,p¼.007, partial h2¼.13, but no significant main effect of group in the circumnavigation task,F(4, 95)¼1.59, not significant (n.s.).
The results of the respective ANOVA for learning effi-ciency revealed a highly significant main effect for group,F(4, 95)¼4.36,p¼.003, partialh2¼.16, and there was also an interaction of group with task, F(4, 95)¼2.88, p¼.027, partial h2¼.11. There was a significant main effect for the time-difference task, F(4, 95)¼4.55, p¼.002, partial
h2¼.16, and for circumnavigation task, F(4, 95)¼4.02, p¼.005, partialh2¼.14.
3.3. Effects of adding pictures to text
To test Hypotheses 1a and 1b, the learning outcomes after learning from text only (control group) with the outcomes after learning from text and pictures were compared by planned contrasts. There was neither a significant difference for the time-difference task, F(1, 95)¼2.23, n.s., nor a significant difference for circumnavigation task, F(1, 95)¼.87, n.s. In other words, we found neither support for
Fig. 4. Example of an interactive circle picture (manipulation type). Fig. 3. Example of an interactive carpet picture (manipulation type).
a multimedia effect (Hypothesis 1a) nor support for a redun-dancy effect (Hypothesis 1b).
For learning efficiency, however, the respective planned contrasts revealed highly significant effects. Learning efficiency was considerably higher with learning from text only than with learning from text and pictures for the time-difference task,F(1, 95)¼17.41,p<.001, partialh2¼.15, as well as for the circum-navigation task,F(1, 95)¼15.27,p<.001, partialh2¼.14.
Accordingly, learning from text and pictures was neither beneficial nor harmful for learning outcomes. However, participants learned by far more efficiently without pictures, because processing pictures required more time without being
beneficial for the learning outcomes. In other words, the learning outcomes that had already been achieved by learning from text could not be considerably improved by additional pictures, as the multimedia effect would suggest. In terms of learning efficiency, learning from text only was even more successful than learning from text and pictures.
3.4. Effects of interactivity and visualization format
The 2(interactivity)2(visualization format)2(tasks) ANOVA, with the last factor being an within subjects factor, for learning outcomes revealed a nonsignificant effect for
Fig. 5. Example of an interactive carpet picture (simulation type).
interactivity,F(1, 76)¼2.62, n.s. The main effect for visual-ization format was also nonsignificant, F(1, 76)¼.29, n.s. However, there was a highly significant interaction Inter-activityTasks,F(1, 76)¼17.69,p<.001, partialh2¼.19, and a highly significant interaction Visualization For-matTasks, F(1, 76)¼11.48, p¼.001, partial h2¼.13.
More specifically, participants with interactive pictures performed significantly better on the time-difference task than participants with non-interactive pictures, F(1, 76)¼12.07, p¼.001, partial h2¼.13, whereas no significant difference was found with regard to the circumnavigation task between participants with non-interactive pictures and participants with interactive pictures, F(1, 76)¼.47, n.s. In other words, the results of the time-difference task supported Hypothesis 2a, whereas the results of circumnavigation task supported neither Hypothesis 2a nor Hypothesis 2b.
The highly significant interaction between Interactivity and Tasks mentioned above supported Hypothesis 3, which assumed that participants with carpet pictures will perform better with the time-difference task, whereas participants with circle pictures will perform better with the circumnavigation task. The interaction InteractivityVisualization For-matTask was not significant, F(1, 76)¼.88, n.s. In other words, the interaction Visualization FormatTask according
to Hypothesis 3 seems to be the same for interactive pictures and non-interactive pictures. By the same token, the effects of interactivity on the time-difference task and circumnavigation task seem to be not affected by the visualization format.
It was also found that the possibilities for interaction were used in different ways depending on the visualization format. An ANOVA with the Visualization Format as between subjects factor and Frequency of Interaction with manipulation pictures (Figs. 3 and 4) and simulation pictures (Figs. 5 and 6) as within subjects factor revealed a significant interaction Visu-alizationFrequency of Interaction,F(1, 38)¼5.02,p¼.03, partial h2¼.12. Participants with carpet pictures used the possibilities of manipulations 3.20 times on the average (SD¼4.77), whereas those with circle pictures used this possibility on the average only 1.50 times (SD¼2.42). On the contrary, participants with circle pictures used the possibilities of simulations 20.80 times on the average (SD¼34.00), whereas those with carpet pictures used this possibility only 5.40 times (SD¼5.38). Although the possibilities for manipulations and for simulations were exactly the same, carpet pictures were used more frequently for manipulations than circle pictures, whereas circle pictures were used more frequently for simulations than carpet pictures.
The 2(interactivity)2(visualization format)2(tasks) ANOVA, with the last factor being within subjects factor, for learning efficiency did not reveal any main effect of inter-activity,F(1, 76)¼.06, n.s. The main effect for visualization format was also nonsignificant, F(1, 76)¼.26, n.s. However, there was a highly significant interaction InteractivityTasks, F(1, 76)¼16.21, p<.001, partialh2¼.18, and a significant interaction Visualization FormatTasks, F(1, 76)¼5.38, p¼.023, partial h2¼.07. Participants with interactive pictures learned more efficiently with regard to time-differ-ence questions than participants with non-interactive pictures, but the corresponding contrast did not reach statistical significance, F(1, 76)¼1.05, n.s. Participants with non-interactive pictures learned more efficiently with regard to circumnavigation task than participants with interactive pictures, but again the corresponding contrast did not reach statistical significance, F(1, 76)¼1.56, n.s. Thus, the differ-ences in learning efficiency reflected to a large extent the differences in learning outcomes.
The highly significant interaction between visualization format and tasks mentioned above showed that participants with carpet pictures learned more efficiently with regard to time-difference questions, whereas participants with circle pictures learned more efficiently with regard to the circum-navigation task. That is, the differences in learning efficiency reflected again the differences in learning outcomes. The interaction InteractivityVisualization FormatTask was not significant, F(1, 76)¼.87, n.s. In other words, the inter-action Visualization FormatTask with regard to learning efficiency seems to be the same for interactive pictures and non-interactive pictures. By the same token, the effects of interactivity on the efficiency for the time-difference task and on the efficiency for circumnavigation task seem to be not affected by the visualization format.
Table 1
Means (and SD) of learning outcomes and learning efficiency scores as a function of condition. Condition N Time-difference task Circumnavigation task M(SD) M(SD) Learning outcomes
Text with carpet pictures
Non-interactive 20 7.45 (2.58) 9.10 (2.53) Interactive 20 9.35 (2.91) 9.00 (3.11)
Total 40 8.40 (2.88) 9.05 (2.80)
Text with circle pictures
Non-interactive 20 6.45 (2.37) 10.75 (2.83) Interactive 20 8.85 (3.17) 10.00 (2.34) Total 40 7.65 (3.02) 10.38 (2.59) Text with non-interactive
pictures (summarized)
40 6.95 (2.50) 9.93 (2.78) Text with interactive
pictures (summarized)
40 9.10 (3.01) 9.50 (2.76) Text with pictures (summarized) 80 8.03 (2.96) 9.71 (2.76) Text only 20 9.10 (3.28) 10.35 (2.76) Learning efficiency
Text with carpet pictures
Non-interactive 20 0.256 (0.155) 0.322 (0.206) Interactive 20 0.301 (0.185) 0.296 (0.199) Total 40 0.278 (0.170) 0.309 (0.200) Text with circle pictures
Non-interactive 20 0.218 (0.146) 0.358 (0.227) Interactive 20 0.247 (0.152) 0.274 (0.158) Total 40 0.232 (0.148) 0.316 (0.198) Text with non-interactive
pictures (summarized)
40 0.237 (0.150) 0.340 (0.215) Text with interactive
pictures (summarized)
40 0.274 (0.170) 0.285 (0.178) Text with pictures (summarized) 80 0.255 (0.160) 0.312 (0.198) Text only 20 0.569 (0.591) 0.616 (0.569)
4. Discussion
4.1. Effects of adding pictures to text
Do students learn better from text and pictures than from text alone, as suggested by the multimedia principle (Mayer, 2001)? Our results did not support this assumption. Partici-pants, on average, did not perform significantly better after learning from text and pictures than after learning from text alone. However, participants did not perform worse either after learning from text and pictures than after learning from text alone, as would be suggested by the redundancy principle of Sweller (1999, 2005), which would entail that learners no longer need pictures as a learning aid. In other words, adding pictures to text did not result in higher learning outcome, but it was also not harmful for performance. A different pattern of results emerged, when we analyzed learning efficiency: Participants learned significantly more efficiently, when they didnotuse text and pictures, but usedonly text. In other words, processing of pictures required more time without being beneficial for learning outcomes.
The fact that we found neither a multimedia effect nor a redundancy effect for learning outcomes, but a significantly higher efficiency of learningwithout pictures might be due to the setting of self-paced learning used in this experiment. Participants could read the text or observe the pictures at will, and there were no limitations with regard to learning time. We assume that there are two possible reasons for this result pattern.
First, if text and pictures are presented, pictures can replace text to some extent. In this case, students process the text combined with pictures less intensively and, as a result, construct a less elaborated mental representation than they would do when reading the text without pictures. If no pictures are available, students have to read the text more carefully in order to understand the subject matter, and will construct a carefully elaborated propositional representation as well as a carefully elaborated mental model. In other words, although pictures can on the one hand be beneficial for learning they can, on the other hand, also gull the learner into a too super-ficial text processing, when they replace the text as an infor-mation source to some extent. Relations of replacement between text and pictures have been reported bySchnotz and Bannert (1999).
Second, if text and pictures are presented and if students have sufficient learning prerequisites, it is possible that the pictures just illustrate what the learner has constructed already in his/her mind based on the text. In this case, the pictures only confirm the learner’s result of text comprehension without adding further information to it. The pictures are indeed redundant for the learner, because they only convey informa-tion that is already known, and processing them requires time and energy without the reward of deeper understanding. This is not harmful for learning outcomes as long as there are no limitations for learning time, because a reduced learning efficiency can be compensated by longer learning times. As soon as learning time is limited, however, reduced learning
efficiency would also reduce learning outcomes (cf. Paas & Kester, 2006; Paas, Renkl, & Sweller, 2003, 2004; Scheiter, Gerjets, Vollmann, & Catrambone, 2009; Schnotz & Ku¨rschner, 2007; Sweller, 2005).
4.2. Effects of interactivity
Do students learn better from interactive pictures than from non-interactive pictures? According to our overall results, the answer is ‘‘no’’. Students do not generally have higher learning outcomes after learning from interactive pictures, but the significant interaction between task and interactivity suggests that there are differences with regard to the type of learning outcome measured. Participants with interactive pictures performed significantly better with time-difference questions than those with non-interactive pictures, whereas no significant difference was found with circumnavigation ques-tions. In other words, interactivity turned out to be beneficial only for answering time-difference questions, but not for circumnavigation questions. A corresponding interaction was also found for learning efficiency. As the lack of an interaction between task, interactivity, and visualization format suggests, these effects of interactivity were not affected by the visuali-zation format.
We suspect that the different kinds of interactive pictures had different functions for the learning of the participants. Manip-ulation pictures might have had primarily an enabling function, namely they enlarged the set of possible cognitive processes and, thus, allowed the learner to perform more processing than he/she had been able to do with static pictures. Learners would not be able to create in their working memory dozens of different time states on the earth from a static picture, but manipulation pictures enable them to do so. In this way, learners could repeatedly extract information about a large set of time differences on the earth. Because answering time-difference questions required knowledge about time coordinates of various cities in the world, manipulation pictures were helpful for answering time-difference questions later on.
Simulation pictures, on the contrary, seem to have had primarily a facilitating function (provided that the participants were able to run corresponding mental simulations also by themselves). Simulation pictures provided external perceptual support for mental simulations and, thus, made these mental simulations easier. As answering circumnavigation questions required mental simulations of the earth rotation and simula-tions of circumnavigating around the earth, simulation pictures affected primarily performance with these circumnavigation questions. If learners have relatively low prior knowledge or cognitive abilities to perform the corresponding mental simulations on their own without external support, such simulation pictures can have a supplantation function (Salo-mon, 1994) for the corresponding cognitive process that is beneficial for learning (Schnotz, Boeckheler, & Grzondziel, 1999; Segers & Verhoeven, 2009; Sweller & Chandler, 1994; Van Gog, Ericsson, Rikers, & Paas, 2005). However, if learners have higher prior knowledge and sufficient cognitive abilities to perform the corresponding mental simulation on
their own, facilitation can also have a negative effect on learning, because unneeded support prevents learners from performing more demanding cognitive processes. The facili-tating function may be beneficial for performing the corre-sponding mental simulation, but is not necessarily beneficial for learning (Schnotz & Rasch, 2005). Furthermore, there is a danger of perceptually supported dynamic mental repre-sentations in working memory without sufficiently clear conceptual support, which might create an illusion of under-standing (cf.Glenberg, Wilkinson, & Epstein, 1982).
4.3. Effects of visualization format
Do students construct different kinds of mental models depending on the visualization format of pictures and, thus, show different performance with different tasks? Is the effect of the visualization format the same for interactive and for non-interactive pictures? According to our results, the answer is ‘‘yes’’ in both cases. On the one hand, participants per-formed better in answering time-difference questions after learning with carpet pictures than circle pictures. On the other hand, participants performed better in answering circumnavi-gation questions after learning with circle pictures than carpet pictures. The significant interaction supports the assumption that the format of visualization affects the structure of the emerging mental model in picture comprehension, as described by Schnotz and Bannert (2003) in their theory of text and picture comprehension (cf.Schnotz, 2005). According to this theory, learning from pictures includes selection of information from a picture and organizing this information into coherent perceptual structures. Further selection processes focus on thematically relevant parts of these structures that are conveyed via a process of analog structure mapping onto the mental model, which results from the comprehension process. Thus, the findings correspond to the assumption that the structure of visualization influences the effectiveness of mental models for specific tasks due to a process of structure mapping between visualization and mental models. Accord-ingly, different formats of visualizations result in different structures of mental models, which have different computa-tional efficiencies for different tasks. It follows that presenting graphics is not always beneficial for the acquisition of knowledge. Whereas task-appropriate graphics may support learning, task-inappropriate graphics may interfere with mental model construction. The lack of a significant interac-tion between task, interactivity, and visualizainterac-tion format suggests that the effect of the visualization format on task-specific learning outcomes is the same for interactive pictures and non-interactive pictures.
Does the visualization format modify the effects of inter-active pictures? According to the nonsignificant interaction between task, interactivity, and visualization format the answer should be ‘‘no’’. Interactive pictures turned out to be very beneficial for answering time-difference questions not only when participants had learned with carpet pictures, but also when they had learned with circle pictures. One possible explanation could be that learners who read off information
about the different time coordinates of different cities from manipulation pictures encode this information in a proposi-tional format regardless of the kind of visualization format. If the precise propositional encoding of time coordinates is the most important issue in answering time-difference questions, then the enabling function of interactive (manipulation) pictures would indeed apply for both kinds of visualization format. The relative weight of propositional representations and mental models in solving learning tasks is an issue that has not received sufficient attention yet within this research topic. With regard to circumnavigation questions, on the one hand, participants with interactive circle pictures showed somewhat (but not significantly) lower performance than participants with non-interactive circle pictures. When interactive pictures allow simulations and when external simulations facilitate internal, mental simulations, lower performance resulting from inter-active pictures could be considered as a negative facilitating effect. Whereas the effect was not significant here,Schnotz and Rasch (2005)reported a significant negative facilitation effect for circle pictures. On the other hand, there was practically no difference between interactive and non-interactive carpet pictures with regard to circumnavigation questions. A further aspect of how the visualization format could modify the effects of interactive pictures is the kind of interaction chosen by the learner. As mentioned above, learners with carpet pictures used the manipulation options more frequently than learners with circle pictures, whereas learners with circle pictures used the simulation options more frequently than learners with carpet pictures. This implies that the different visualization formats might also include different affordance structures for interact-ing with the visualization (cf.Gibson, 1979). Insofar, it seems that differential effects on animation with regard to visualiza-tion formats and learning tasks are still a reasonable possibility, which deserves further research.
References
Amadieu, F., van Gog, T., Paas, F., Tricot, A., & Marine´, C. (2009). Effects of prior knowledge and concept-map structure on disorientation, cognitive load, and learning.Learning and Instruction, 19(5), 376e386.
Amthauer, R. (1973). Intelligenz-Struktur-Test 70 (IST-70) [Intelligence-Structure-Test 70]. Go¨ttingen, Germany: Hogrefe.
Ayres, P., & Paas, F. (2007). Making instructional animations more effective: A cognitive load approach.Applied Cognitive Psychology, 21, 695e700.
Betrancourt, M. (2005). The animation and interactivity principles in multi-media learning. In R. E. Mayer (Ed.),The Cambridge handbook of multi-media learning(pp. 287e296). New York: Cambridge University Press.
Emerging topics in cognitive load research: Using learner and information characteristics in the design of powerful learning environments. (2006). [Special issue]. In F. Paas, & L. Kester (Eds.), Applied Cognitive Psychology, 20(pp. 281e285).
Gibson, J. J. (1979).The ecological approach to visual perception. Boston, MA: Houghton Mifflin.
Glenberg, A. M., Wilkinson, A. C., & Epstein, W. (1982). The illusion of knowing: Failure in the self-assessment of comprehension.Memory and Cognition, 10, 597e602.
Kalyuga, S. (2009). Knowledge elaboration: A cognitive load perspective. Learning and Instruction, 19(5), 402e410.
Kinzer, C., & Verhoeven, L. (2008).Interactive literacy education. Mahwah, NJ: Erlbaum.
Larkin, J. H., & Simon, H. A. (1987). Why a diagram is (sometimes) worth ten thousand words.Cognitive Science, 11, 65e99.
Lowe, R. K. (1996). Background knowledge and the construction of a situa-tional representation from a diagram.European Journal of Psychology of Education, 11, 377e397.
Lowe, R. K., & Schnotz, W. (Eds.). (2008).Learning with animation. Research implications for design. New York: Cambridge University Press. Mayer, R. E. (1997). Multimedia learning: Are we asking the right questions?
Educational Psychologist, 32, 1e19.
Mayer, R. E. (2001).Multimedia learning. New York: Cambridge University Press.
Mayer, R. E. (2005). The Cambridge handbook of multimedia learning. Cambridge, UK: Cambridge University Press.
Miller, G. A. (1956). The magical number seven, plus or minus two: Some limits on our capacity for processing information.Psychological Review, 63, 81e97.
Mokros, J. R., & Tinker, R. F. (1987). The impact of microcomputer based labs on children’s ability to interpret graphs.Journal of Research in Science Teaching, 24, 369e383.
Paas, F., Renkl, A., & Sweller, J. (2003). Cognitive load theory and instruc-tional design: recent developments.Educational Psychologist, 38, 1e4.
Paas, F., Renkl, A., & Sweller, J. (Eds.). (2004).Advances in cognitive load theory: Methodology and instructional design. (pp. 1e2) [Special issue].
Instructional Science: Vol. 32.
Paas, F., Tuovinen, J., Tabbers, H., & Van Gerven, P. W. M. (2003). Cognitive load measurement as a means to advance cognitive load theory. Educa-tional Psychologist, 38, 63e71.
Peterson, L., & Peterson, M. (1959). Short-term retention of individual verbal items.Journal of Experimental Psychology, 58, 193e198.
Pettersson, R. (1994). Visual Literacy und Infologie [Visual literacy and infology]. In B. Weidenmann (Ed.),Wissenserwerb mit Bildern: Instruk-tionale Bilder in Printmedien, Film/Video und Computerprogrammen(pp. 215e235). Bern: Huber.
Rieber, L. P. (1991). Animation, incidental learning, and continuing motiva-tion.Journal of Educational Psychology, 83, 318e328.
Salomon, G. (1994).Interaction of media, cognition, and learning. Hillsdale, NJ: Erlbaum.
Scheiter, K., Gerjets, P., Vollmann, B., & Catrambone, R. (2009). The impact of learner characteristics on information utilization strategies, cognitive load experienced, and performance in hypermedia learning.Learning and Instruction, 19(5), 387e401.
Schnotz, W. (2005). An integrated model of multimedia learning. In R. E. Mayer (Ed.),The Cambridge handbook of multimedia learning(pp. 49e69). New York: Cambridge University Press.
Schnotz, W., & Bannert, M. (1999). Einflu¨sse der Visualisierungsform auf die Konstruktion mentaler Modelle beim Bild- und Textverstehen [Influences of the visualization format on the construction of mental models during picture and text comprehension].Zeitschrift fu¨r experimentelle Psycholo-gie, 46, 216e235.
Schnotz, W., & Bannert, M. (2003). Construction and interference in learning from multiple representations.Learning and Instruction, 13, 141e156.
Schnotz, W., Boeckheler, J., & Grzondziel, H. (1999). Individual and co-operative learning with interactive animated pictures.European Journal of Psychology of Education, 14, 245e265.
Schnotz, W., & Ku¨rschner, C. (2007). A reconsideration of cognitive load theory.Educational Psychology Review, 19, 469e508.
Schnotz, W., & Ku¨rschner, C. (2008). External and internal representations in the acquisition and use of knowledge: visualization effects on mental model construction.Instructional Science, 36, 175e190.
Schnotz, W., & Lowe, R. K. (2008). A unified view of learning from animated and static graphics. In R. K. Lowe, & W. Schnotz (Eds.),Learning with animation. Research implications for design(pp. 304e356). New York:
Cambridge University Press.
Schnotz, W., & Rasch, T. (2005). Enabling, facilitating, and inhibiting effects of animations in multimedia learning: Why reduction of cognitive load can have negative results on learning.Educational Technology: Research and Development, 53, 47e58.
Schwan, S., & Riempp, R. (2004). The cognitive benefits of interactive videos: Learning to tie nautical knots.Learning and Instruction, 14, 293e305.
Segers, E., & Verhoeven, L. (2009). Learning in a sheltered internet environ-ment: The use of WebQuests.Learning and Instruction, 19(5), 423e432.
Sweller, J. (1999). Instructional design in technical areas. Camberwell, Australia: ACER Press.
Sweller, J. (2005). Implications of cognitive load theory for multimedia learning. In R. E. Mayer (Ed.),The Cambridge handbook of multimedia learning(pp. 19e30). New York: Cambridge University Press.
Sweller, J., & Chandler, P. (1994). Why some material is difficult to learn. Cognition and Instruction, 12, 185e223.
Sweller, J., van Merrie¨nboer, J. J. G., & Paas, F. (1998). Cognitive archi-tecture and instructional design. Educational Psychological Review, 10, 251e296.
Tversky, B., Heiser, J., Mackenzie, R., Lozano, S., & Morrison, J. (2008). Enriching animations. In R. K. Lowe, & W. Schnotz (Eds.),Learning with animation. Research implications for design(pp. 263e285). New York:
Cambridge University Press.
Tversky, B., Morrison, J. B., & Betrancourt, M. (2002). Animation: Can it facilitate? International Journal of Human-Computer Studies, 57, 247e
262.
Van Gog, T., Ericsson, K. A., Rikers, R. M. J. P., & Paas, F. (2005). Instruc-tional design for advanced learners: Establishing connections between the theoretical frameworks of cognitive load and deliberate practice. Educa-tional Technology, Research & Development, 53, 73e81.
Verhoeven, L., & Graesser, A. (2008). Cognitive and linguistic factors in interactive knowledge construction.Discourse Processes, 45, 289e297.
Weidenmann, B. (1989). When good pictures fail: An information-processing approach to the effects of illustrations. In H. Mandl, & J. R. Levin (Eds.), Knowledge acquisition from text and pictures(pp. 157e170). Amsterdam: