MULTIVARIATE DATA VISUALIZATION IN SOCIAL
SPACE
Karin Juurikas Tallinn University of Technology Kopli 101, 11712 Tallinn, Estonia
Ants Torim Tallinn University of Technology
Raja 15, 12618 Tallinn, Estonia Leo Võhandu Tallinn University of Technology
Raja 15, 12618 Tallinn, Estonia
ABSTRACT
We present a method for analysis of social-economical data that is based on the theory of monotone systems. Our method is based on a computationally simple weight function th at describes objects “typicality” for a data table. We apply that method to analyze social-economical data about Estonian islan d Hiiumaa and show that we can detect both typical settlements and notable outliers with our method. Use of two slightly different weight functions allows us to create novel two-dimensional conformity plot visualization for multivariate data.
KEYWORDS
Visualization, monotone systems, data mining
1.
INTRODUCTION
We propose a novel two-dimensional conformity plot visualization for multivariate data that is based on the technique of monotone systems called scale of conformity. This method involves finding a weight for every object that represents objects “typicality” for a data table. As sim ilar objects have similar weights, it is possible to find groups of objects. Our approach is illustrated by analysis of social-economical data about one Estonian county – an island of th e Baltic Sea Hiiu maa (relatively isolated territory). We do not u se geographical information in our analysis unlike spatial data mining techniques that are described for example in [Koperski et al, 1998].
The theory of the monotone systems was devel oped in Tallinn University of Technology Institute of Informatics [Mullat, 1976] and is widely used to find internal structure of the data [Võhandu and Võhandu, 2003], [Kuusik et al, 2004], [Kuusik and Lind. 2003], [Kuusik and Lind. 2004].
2.
BODY OF PAPER
2.1 Overview of the Method
We describe here a scal e of con formity approach that is one of the simplest monotone systems methods [Võhandu, 1989]. It is also computationally fast method where only one pass through data table is needed. We find a weight called conformity for each object in a data table. Conform ity for an obje ct is calculated by a transformation where instead of th e attributes value we use its frequ ency in the d ata table (so-called frequency transformation). For every row in the data table we calculate the sum of all attribu te-value frequencies. This sum is th e conformity weight for that ro w. Intuitively conformity describes objects “typicality” for entire data table (system). If we include frequencies of missing and negative values (zeros in binary data table) in our conformity calculation then we are using weight function π01. If we don’t include frequencies of zero values (we are using only frequencies of ones in binary data table) calculation then we are using weight function π1.
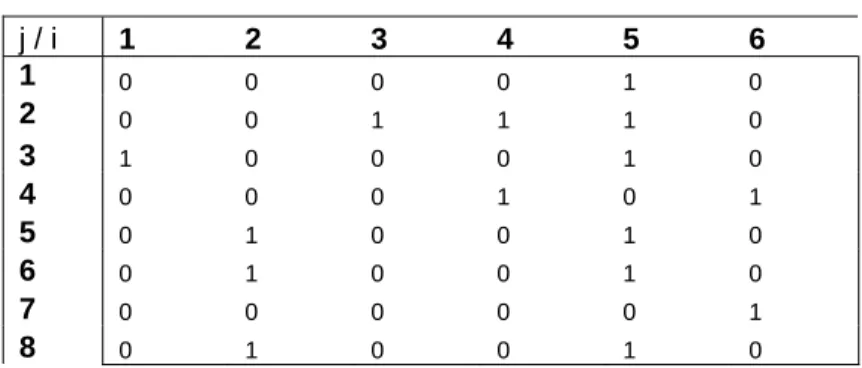
For example let us consider following data table:
Table 1. j * i binary data table
j / i 1 2 3 4 5 6 1 0 0 0 0 1 0 2 0 0 1 1 1 0 3 1 0 0 0 1 0 4 0 0 0 1 0 1 5 0 1 0 0 1 0 6 0 1 0 0 1 0 7 0 0 0 0 0 1 8 0 1 0 0 1 0
After calculating frequencies and weights we get:
Table 2. Weights and frequencies for the previous table, rows are sorted after π01
j / i 1 2 3 4 5 6
π
01(j)
π
1(j)
1 0 0 0 0 1 0 37 6 5 0 1 0 0 1 0 35 9 6 0 1 0 0 1 0 35 9 8 0 1 0 0 1 0 35 9 3 1 0 0 0 1 0 31 7 7 0 0 0 0 0 1 29 2 2 0 0 1 1 1 0 27 9 4 0 0 0 1 0 1 25 4 f (i, 0) 7 5 7 6 2 6 f (i, 1) 1 3 1 2 6 2Such ordering of the data table makes it possible to detect frequent itemsets visually in it. For ex ample itemset {i3=0, i4=0, i5=1, i6=0} with support 5 ( first 5 rows) is clearly visible from our sorted table.
2.2 Our Data
Hiiumaa is an island of the Baltic Sea with territory of ca 1 000 km² and population of ca 11 000 inhabitants. Our data table contains settlements (184) and their demographic and economic characteristics (or some activities or values) (226). It is available from [Juurikas and Torim, 2006].
Data in our table is binary. Most attributes are binary by nature like existence of a port or of a school. Each numerical attribute was replaced by several attributes that represent an interval. For example number of children in a village is represen ted by four binary attributes children<10, children10-50, children50-100, children>100. Ones in data table represent presence of certain feature or value located within interval.
Data table about Hiiumaa is sparse – only 4.7% of values are ones. When using weight function π01 on sparse data table mostly empty r ows tend to have highest weights. In this article we propo se using both weight functions - π01 and π1 - for data mining and visualization.
2.3 Data Analysis Using the Scale of Conformity
2.3.1 Analysis of Data Using Weight-Function π01
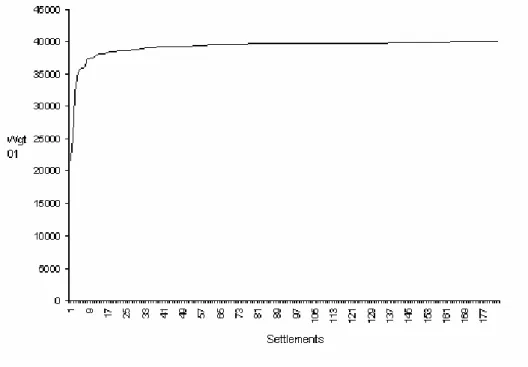
We find weights for each settlement and sort settlements by weight. Rapid growth of weight in suc h weight sequence allows us to d elimit special settlement groups. Settlements with highest weights – m ost typical settlements – belong to the special group of interest.
Figure 1. Settlements and their weight π01, sorted in ascending order
We then find common attributes for identified settlement groups. For small d ata tables like ours it i s possible to detect common attributes visually from sorted data table. For larger tables automated methods for mining frequent itemsets or association rules may be necessary.
We can see from Figure 1.that small number of settlements (ca ten) h ave notably lower weights than others (< 36000). Th ese are larg e settlements and administrative centers. They have economic activities, administrative importance and better social characteristics (more habitants, more children etc.). Their lower weights are caused by having lots of characteristics that are atypical for more common, smaller settlements.
Group of 27 settlements with highest π01 (most typical settlements) has following common attributes: population between 10 to 50, number elderly and children between 1 to 10 and presence of workers. Four of those settlements have summerhouses There are no other social-economic activities or features.
2.3.2 Composite View from both Weight Functions
We now add weight function π1 into our analysis. When weight function π01 is calculated on sparse data, high frequencies of zeros tend to dominate. Weight function π1 is calculated using only frequencies of ones. So objects are “typical” (have a high wei ght) when they have lots of common characteristics and having uncommon characteristics does not reduce objects weight. That will give us a somewhat different ordering. As the functions bring forth different aspects, combining weights of both weight-functions into a si ngle scatter plot (Figure 2.) gives us a good overview.
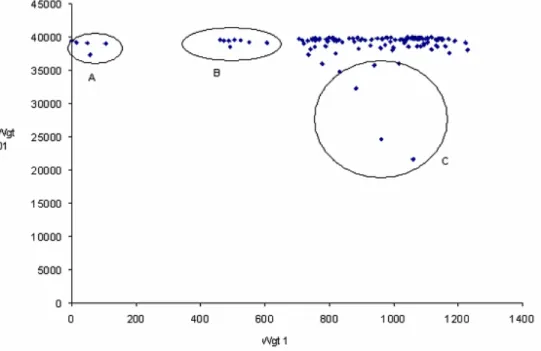
Figure 2. Conformity plot. Settlements weights by functions π01 and π1
This method can be used for any discrete data table regardless of number of attributes (dimensions). Our proposed conformity plot visualization is similar to clustering visualizations like Kohonen nets and nonlinear projection visualizations like Sammon plots [Hoffman and Grinstein, 2002]. Our visualization displays clusters and outliers. Furthermore: both axes in our visualization have intuitive meaning as they show objects typicality for data table. Most typical objects are located in the upper right corner of the plot.
Some easy-to-detect outlier groups are:
A: The most non-typical villages, people do not live there and villages have no social characteristics. But they have som e economic activities, like harbor, custom, border guard, s ummer-café, etc, which are supervised from other (central) places.
B: The second clearly differentiated settlements group, has weaker social characteristics (no children in villages), than usual for Hiiumaa. They have also small harbors, coastal fishing, summer-cafés, sights etc. There are no private enterprises.
C: Large settlements and administrative centers mentioned in section 2.2.1.
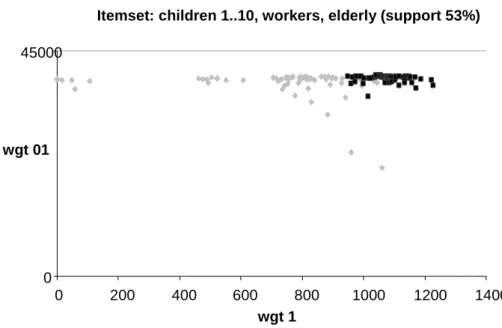
Structure and semantics of t he main group are harder to a nalyze. Combining conformity plot with information from frequent itemsets or association rules is one promising way to provide semantic information about visual clusters. For exa mple frequent itemset containing villages with workers, elderly and 1 to 10 children (black) splits main group into two halves:
Itemset: children 1..10, workers, elderly (support 53%) 0 45000 0 200 400 600 800 1000 1200 1400 wgt 1 wgt 01
Figure 3. Objects covered by a frequent itemset (black). Objects not covered by itemset are grey
3.
CONCLUSION
Application of monotone systems theory for analysis of social data was successful. We were able to describe typical settlements and some notable outliers. The main result of the work was presentation of new effective analysis method for regional economics and economic geography. We are gathering information about another Estonian island, Saaremaa. Comparison of the results should be interesting. Our proposed conformity plot visualization is applicable not only to social data but to all discrete data tables. Our current data table was small but because of its linear com putational complexity our approac h should also be pract ical for analysis of very large data tables.
REFERENCES
Hoffman, P. E. and Grinstein , G. G., 2002 . A Survey of Visualizations for High-Dimensional Data Minin g. In
Information Visualization in Data Mining and Knowledge Discovery. Academic Press, pp 47-82
Juurikas,K. and Torim, A., 2006. Data table. http://staff.ttu.ee/~torim/Hiiumaa.xls; http://staff.ttu.ee/~torim/Hiiumaa.csv Koperski, K. et al, 1998 Mining Knowledge in Geographical Data. In Communications of ACM.
Kuusik, R. et al, 2004. Pattern Mining as a Clique Extracting Task. Posters. Tenth International Conference IPMU 2004 Information Processing and Management of Uncertainty on Knowledge- Based Systems. Perugia, Italy , ISBN 88 -87242-54-2, pp. 19-20.
Kuusik,R. and Lind, G, 2003 . An Approach of Data Mining Using Monotone S ystems. Proceedings of th e Fifth International Conference on Enterprise Information Systems. Angers, France. Vol. 2, pp. 482-485.
Kuusik, R. and Lind, 2004. G. New frequ ency pattern algorithm for data mining. Proceedings of th e 13th Turkish Symposium on Artificial Intelligence and Neural Networks. Foca, Izmir, Turkey, ISBN 975-441-213-8, pp. 47-54. Mullat, I., 1976. Extremal Monotonic Systems. Automation and Remote Control No 5
Võhandu, L., 1989. Fast Methods in Exploratory Data Analysis. In Transactions of TTU, No 705, pp. 3-13