ISSN 2338-7920 (O) / 2338-2619 (P) Did Global Financial Crisis Impact the Islamic Banking Efficiencies?
Evidence from Malaysian Islamic Banks Abdus Samad
Professor of Economics Department of Finance and Economics
Utah Valley University-USA
Abstract: First, this paper investigated the loan and deposit efficiencies of Malaysian Islamic banks during 2008-2013 applying the non-parametric technique, Data Envelopment Analysis (DEA), and found that the average technical efficiency (TE) of loan financing was 83%, 88%, 87%, 95%, 100%, and 94% and the average technical efficiency for deposit mobilizations was 87%, 94%, 94%, 96%, 92%, and 96%. Only four banks in 2008, two bank in 2009, three banks in 2010, two banks in 2011-2013 are both technically and scale efficient in loan production. On the other hand, only four banks in 2008 and 2009, five banks in 2010 and 2011, three banks in 2012, and five banks in 2013 are both technical and scale efficient in deposit mobilizations. Second, the paper compares the efficiencies of Islamic banks between the global financial crisis (GFC) and the post global financial crisis (PGFC) in determining whether the efficiencies of banks between the GFCP and PGFCP are stable. Both parametric and non-parametric tests found no significant difference in the efficiencies between the two periods suggesting that the efficiencies of the Malaysian Islamic banks were stable.
Keywords: Malaysia, Islamic Bank Efficiency, Comparison, DEA. JEL Classification: G21; G22.
Introduction
The Global Financial Crisis had serious impact on the world economy, banking sector in particular. The U.S. housing market collapsed, unemployment exceeded over 10 percent, and the growth rate of the economy was negative. The most devastating effect was seen in the financial sector.
In the banking sector, one hundred forty banks went bust in 2009 and 157 banks were wiped out in 2010 (Time: January 2012). Such a large scale bank failure has never occurred in the financial history of the United States since the Great Depression (Samad, 2013).
During the same period (2009-2013), there is a phenomenon growth of Islamic Banking. The deposits and assets of Islamic banks grew globally. According to the Ernest &
Young firm‘s estimates ―Islamic banking asset grew at an annual rate of 17.6% between 2009
and 2013 and will grow by an average of 19.7% to 2018‖ (Economist: September 13th
-19th, 2014). Paul Koster, Chief Executive of DFSA said the Islamic finance industry is set to grow from $700 billion to $4 trillion by 2013, and despite the global financial crisis (GFC), Islamic banking is still projected to grow by 15-20 percent annually (Koster, 2009).
Given Ernest & Young‘s claim that ―Islamic banking asset grew at an annual rate of 17.6% between 2009 and 2913‖ when there were large bank failures in the U.S. and around the world, the study of the efficiencies of Malaysian Islamic banks during the global financial crisis period and the post global financial period is an important contribution in the banking literature.
The exploration of efficiency of banks is important from both microeconomic and Macroeconomic points of view (Berger and Mester, 1997). From a microeconomic perspective,
the study of bank efficiency is important due to the increase in competition in the banking sector. The competition in the Malaysian banking industry is enhanced not only due to the entering of foreign banks but also due the increase in the number domestic banks. The growing economy of Malaysia opens the door of more conventional and Islamic banks. As a result, competition among banks in Malaysia is enhanced.
From a macroeconomic point of view, the efficiency of banks affects the structure and stability of the whole financial system (Rossi et al. 2009). The inefficiency of banks increases the cost of intermediation and harms the allocation of funds and the profitability of bank leading bank failure (Samad, 2014). The increased efficiency in deposit mobilizations and loans advancing is the to successful entrepreneur for enhancing the economic growth of a country (Schumpeter, 1911).
The efficiency of the productivity of banks including Islamic banks is of great interest to public authorities supervising and regulating banks, bank managements and bank depositors and borrowers. Each of them is interested to know the productive efficiency of banks. In a competitive market environment, bank depositors and borrowers are certainly interested to know the efficiency status of individual bank before they deposit their hard earned savings. The borrowers of bank move to the banks which are more efficient in advancing loans.
The study of the efficiency of Malaysian Islamic banks is important for several reasons. First, there are not enough studies of the efficiency of Islamic banks in Malaysia. Sufian and
Majid (2006) found: ―empirical work on Islamic banks efficiency, particularly in Malaysia is still in its infancy‖ (p. 4).
Second, Islamic banking is a dominant feature in the Malaysian banking industry. The growth of Islamic banks in Malaysia is phenomenal. The number of Islamic banks is almost the same as the number of conventional banks. There are sixteen Islamic banks competing with twenty seven conventional banks. Competition is strong and growing. Third, Malaysia is financial hub of Islamic banking in the Southeast Asia. Islamic banks provide a variety of financial products, including Murabaha, Ijara, Mudaraba, Musharaka, Al Salam and Istitsna'a, restricted and unrestricted investment accounts which have been appropriately modified to comply with Shari‘a principle.
A literature survey shows that there is no empirical study on the comparative efficiency of Malaysian Islamic banks between the Global Financial Crisis period (GFCP) and the post Global Financial Crisis (PGFC). The study, thus, provides an important contribution to the banking literature informing the status of efficiency of the Islamic banks of Malaysia.
This paper is organized as: Section 2 outlines the unique characteristics of Islamic bank. Section 3 outlines a short survey of literature. Section 4 describes data, methodology, and the variable of models. Empirical results and conclusions follow in Section 5.
Islamic Banking and its Product Features
Islamic bank is a different breed of financial institution. Islamic bank is an institution whose aims and business operations are guided by the Islamic religion rule called Shariah. The features of Islamic financial institutions/ banks (IFI) are derived from it. In Islam, there is no separation of religion and everyday business-economic or/and state-political activities. First, all activities including the banking business are guided by the Quran and the Shariah law. Islam prohibits firms including Islamic banks not to finance the activities that are harmful and repugnant to the shariah law.
Second, the most unique feature of Islamic banking is the avoidance of riba (usury) in all financial transactions. This is because, the Quran, the Divine book of Islam strongly
prohibits riba in business transactions. The Quran says: …‖whereas Allah permitted trading and
define what riba is1. At present, riba is interpreted as interest. The present scholars of Shariah agreed that the predetermined fixed rate of return is not permitted in Islamic banking business transactions.
The prohibition of interest in business gives rise to the development of unique financial products by the Islamic banks. Such as (i) Musharakah (ii) Muderabah (iii) Murabahah (iv) Bai
Baithaman Ajil‘ (v) bai al-salam (vi) Ijarah (vii) Istisna.
There are two types of the financing contracts of Islamic banks. They are equity type and debt type contracts. Musharakah‘ (partnership) and ‗Mudarabah‘(trust financing) are equity type contracts (Hamwi and Aylward (1999).
Musharakha is a partnership and joint venture contract between the Islamic bank and the investor where both parties provide capital and manage funds and projects. Profits or losses accruing from the venture are distributed based on the proportion of capital and pre-determined agreement. The key features of this contract are: (i) Profit and loss sharing (PLS). Both parties share profits or loss. Unlike conventional bank equity contracts where banks do not bear the risk of financing investments, Islamic banks share the risk of investment.
(ii) Unlike conventional banks‘ equity contracts where banks enjoy the fixed rate of return from investments, even when there are losses for the project, there is no predetermined rate of returns on investments for Islamic banks. Thus, PLS, avoiding of fixed interest, is a key feature of Islamic financing. Justice requires that both share the risk of business.
Mudarabah is a trust financing contract between Islamic banks and investors where Islamic banks provide all funds for a project and investors provide physical labor, intellectual, and management skills. Profits from the projects are distributed based on a pre-agreed (ratio) arrangement. However, in cases of losses, banks, the provider of fund (called rab al maal), will bear the losses of fund and investor will bear the loss of his labor. The key feature of this contract is that there is no predetermined fixed rate of returns for bank; and both parties share the risk of investment.
The key features of the Musharakha and Muderaba contract are: (i) Profit and loss sharing (PLS). Both parties share profits or losses. Unlike conventional bank equity contracts where banks do not bear the risk of financing investments, Islamic banks share the risk of
investment. (ii) Unlike conventional banks‘ equity contracts where banks enjoy the fixed rate of
return from investments, even when there are losses for the project, there is no predetermined rate of returns on investments for Islamic banks. Thus, PLS, avoiding of fixed interest, is a key feature of Islamic financing. Justice requires that both share the risk of business.
Murabaha financing is a debt type contract. Murabaha mode of financing is based on a
‗mark-up‘ arrangement in which goods or assets are purchased by the bank on behalf of a client, and are sold to the client at a price equal to the cost of the item(s) plus a profit margin. Under the Murabaha financing contract, a client wishing to buy goods or assets approaches an Islamic bank to buy them on his behalf. The Islamic bank then buys the product at the current market price and adds a profit margin to it, and then re-sells the product to the client. The key feature is that there is no fixed interest involved, although the critiques of Islamic banks do not admit it.
They call it a ―back door for interest-based financing‖ (Chong and Liu, 2009).
Bai Baithaman Ajil’ is a variant of the Murabah (cost plus) financing contract. The difference is that the delivery of goods is immediate but the payment of goods is deferred. The payment may be made at installment. However, the price of the product is agreed to both parties at the time of the sale but should not include charges for the deferred payment.
Bai al-salaam is a forward sale contract where an entrepreneur sells some specific goods to the Islamic bank at a price agreed upon and paid at the time of contract but the delivery of goods is deferred for the future.
1
[Umar b. al-Khattab said, “There are three thing:. If God’sMessenger had explained them clearly, it would have been dearer to me than the world and what it contains: (These are) kalalah, riba, and khilafah.” (Sunan Ibn Majah, Book of Inheritance, Vol. 4, #2727;
Al-Ijera is a lease financing contract and is similar to a conventional bank lease contract. Under this contract, the Islamic bank purchases an asset for a customer and then leases it out to him for a fixed period at a fixed rental charge agreed upon at the time of purchase. A key difference with conventional bank leases is that the lessor i.e. Islamic bank retains the risk of property ownership. Note that Shariah permits fixed rental charges for the use of asset/property services.
Istisna is a financing contract under which a manufacturer or a producer produces specific goods for future delivery at a predetermined price.
The key feature of Bai Baithaman Ajil’, bai al-salam, Ijarah, and Istisna2 is that financing is fully securitized and asset based. Unlike conventional banks, Islamic banks own the ownership of the goods until full payment is made.
On the liability side, deposit accounts of Islamic banks are classified into three major categories. They are: (i) Al wadiah demand deposits (ii) Mudarabah/Al Wadiah saving deposits (iii) Muderabah investment deposits.
Al Wadiah demand deposits are current deposits and are similar to conventional banks‘ current deposits that provide the guarantee of the safety of deposits and the payment of money
on demand. However, the key difference with conventional banks‘ demand deposits is that the
depositors of Al Wadiah deposit contract are not entitled to fixed rate of return for their deposits. That is, depositors are not eligible to any share of profits. However, banks, at their discretion, may give a part of their profits, called hibah, to depositors for attracting deposits.
Mudarabah saving deposits of the Islamic bank are similar to conventional banks‘
saving deposits. The key feature of this account is the guarantee of safety and payment. Since this is a fixed deposit, banks guarantee the payments of some profits, if they are, to depositors, but banks do promise any fixed rate or amount.
Unlike the Al Wadiah demand deposits and the Mudarabah/Al Wadiah saving deposits, Muderabah investment deposit is a profit and loss sharing deposit. Muderabah investment depositors share the risk of investing their funds with banks for investment. Depositors get profits or losses based on agreements.
Usually the rate of returns is higher than of Al Wadiah demand deposits and Mudarabah/Al Wadiah saving deposits. The key feature of this liability contract is that Islamic
banks neither guarantee the safety of depositors‘ capital nor any return on deposits. In this
sense, Islamic banks‘, Muderabah investment deposits are more risky than those of conventional banks‘ fixed deposits. Second, the profits and losses sharing under this contract (Muderabah
investment deposit) are not symmetric. Under this contract, banks share profits but share no losses. Depositors bear all losses ((Chong and Liu, 2009).
To sum, whether the key features of Islamic banks such as the profit and loss (PLS) modes of business in financing and deposit mobilizations, fully securitized financing and the control of ownership of assets (when financed) which provide Islamic banks insulated from the global financial shock needs to be empirically explored.
Survey of Literature
The empirical research on bank efficiency in the banking sector of the U.S. Europe is wide and extensive. Some of the important studies included Berger and Humphry (1992), DeYoung and Whalen (1994), Barr and Siems (1994), and Wheelock and Wilson (1994). They found the banks that failed were below the efficient frontier.
Both DeYound (1977) and Peristiani (1996) found that the productive efficient banks had less nonperformance loans.
2
Andries and Cocris (2010) analyzed the efficiency of banks for Romania, Czech Republic and Hungry during 2000-2006 and found that banks in these countries were low level of efficiency. The main factors for the low level of efficiency were asset quality, bank size, inflation rate, and the form of ownership.
There has been an increased interest on the empirical studies of Islamic banks‘ efficiency and performance. One of the earliest studies of the efficiency of Islamic banking includes Samad (1999). He examined the comparative efficiency of Islamic bank vis-à-vis conventional banks of Malaysia. He found that the managerial efficiency of Bank Islam Malaysia was lower than that of the conventional banks.
El-gamal and Inanoglu (2004) estimated the comparative cost efficiency of the Turkish banks for the period 1990-2000 using DEA method. They found that the Islamic banks were
more efficient and their efficiency was explained by Islamic banks‘ asset-based financing. Samad (2004) compared the performance of Islamic bank and conventional commercial banks of Bahrain with respect to (a) profitability (b) liquidity (c) capital management. Eleven financial ratios were compared for the period 1991-2001 and found that there was no significant difference in profitability and liquidity performance between the Islamic banks and the conventional banks of Bahrain.
Sufian and Majid (2006) investigated the comparative efficiency of the foreign and domestic banks of Malaysia during 2001-2005. They found that banks‘ scale inefficiency dominated pure technical efficiency during the period. They also found that foreign banks had higher technical efficiency than the domestic banks. They did not examine the efficiency of the Islamic banks of Malaysia.
Sufian (2009) examined the determinants of the efficiency of the banks of Malaysia using DEA method. He found the technical efficiency declined abruptly during the East Asian crisis. However, his study did not incorporate the efficiency of the Islamic banks of Malaysia.
Chong and Liu (2009) examined Malaysian Islamic banks and found that the profit and loss sharing mode of finance was minimum. The growth of Islamic banking was largely driven by the Islamic resurgence rather than by advantage of the profit and loss sharing mode of production.
Onour and Abdullah (2011) examined the efficiency of the twelve Islamic banks of Sudan using DEA during the period 2007-2008. They found that only two banks obtained the technical and scale efficiency and while the smallest bank in group (private ownership) attained the pure technical efficiency but not the scale efficiency.
Samad (2013) investigated the efficiency of Islamic banks using the time varying Stochastic Frontier function on the Islamic banks of 16 countries. Mean efficiencies between the pre global financial crisis and the post global crisis were estimated 39 and 38 percent respectively and the difference was not statistically significant.
Fayed (2013) compared the profitability, liquidity, credit risk, and solvency performance of three Egyptian Islamic banks with six conventional banks during 2008-2010 and
found superiority of the conventional banks‘ performance over Islamic banks.
The survey of literature shows that no studies investigated the comparative efficiencies of the Islamic banks of Malaysia during the global financial crisis and the post global crisis. This study is, thus, an important contribution to the banking literature.
Data and methodology
Data
Data for estimating loan and deposit efficiencies for the period 2008-2014 are obtained
the Website if each bank‘s annual reports. These variables were (i) fixed capital (FK) (ii) labor
cost (wage), (iii) interest expenses (INTEX), (iv) deposit (DEPOSIT), and (v) loans. The descriptive statistics for variables are provided in Table 1 in the Appendix.
Methodology
Data Envelope Analysis (DEA)
This study applied the DEA, non-parametric method, with the variable returns to scale assumption in measuring input-output technical efficiency of the Malaysian Islamic banks. DEA is widely used in the measure of industrial efficiency since the method was originally developed by Charness, Cooper, and Rhodes (1978). The original model assumed that the DMUs were operating at their optimum scale and under the constant returns to scale (CRS). Later the DEA model was modified by Banker, Charness, and Cooper (1984) and introduced the variable returns to scale (VRS) efficiency instead of CRS. The introduction of VRS implies that a firm may have increasing returns to scale (IRS) or decreasing returns to scale (DRS) or constant returns to scale (CRS) in efficiency. Thus, the introduction of VRS allows the breakdown of efficiency into (1) technical efficiencies (TE) and (2) scale efficiencies (SE).
Technical efficiency (TE) of a DMU is the maximum (optimum) amount of output produced by the use of minimum inputs. In other words, TE can be achieved when the DMU produces a given level of outputs with the least amount of inputs. TE efficiency relates to producing outputs without wasting inputsand that cannot be deviated from the optimum scale (scale efficiency).
On the other hand, a DMU is said to be scale efficient (SE) when its size of operation is optimal so that any modification of its size will make the DMU less efficient. Kirigia and Asbu
(2013) classified TE into pure TE (PTE) and SE where the SE is defined as ―a measure of the
extent to which a health decision making unit deviates from the optimum scale (defined as the region in which there are constant returns to scale in the relationship between inputs and outputs).
Following Charness, Cooper, and Rhodes (1978), the technical efficiency (TE) of a DMU (a bank) can be expressed as a maximum ratio of total sum of weighted outputs to the total sum of weighted inputs. In other words,
TE=
.
Assuming that there are N banks (j=1, 2, 3 …N), each bank with X inputs and producing Y
output. Each bank‘s input and output can be represented by vectors (xj ) and (yj), respectively. Let banks‘ XN input matric and the YN output of be denoted as – X and – Y. The efficiency is then min ( ) subject to ( ) (1) u,y
Where u is a (Y x 1) vector of output weight and v is a (X x 1) vector of input weights. In other words, and v are output and input multiplier.
Using duality, in fact the most DEA programs use the dual form, the equation (1) and can be expressed as:
min ø (2)
ø,λ
Subject to øxj–Xλ 0, Yλ yi, λ 0, where λ is a semi positive vectors and ø is a real
variable, scalar, representing the value of efficiency score for each DMU. The range of ø lies between 0 and 1.
Input-Output Controversy and model selection
In a single production firm such as coal mine, inputs and outputs are easy to find. The output is the amount of coal and the inputs are labor and capital. However, in the multiproduct firms such as bank which produces series of services and uses vector of inputs, deciding inputs
and outputs are controversial. Which are bank‘s inputs and which are bank‘s outputs are a
debatable issue for a long time.
Based on production approach (Benston, 1965), a bank is a producer of services for the bank account holders and it produces deposit accounts and loan services with labor and capital. In this sense, the number of deposit account or deposits can be used as output. Depositors‘ income which is equivalent to interest paid to depositors is am import factor for mobilizing total deposits.
Under the intermediation approach, bank is a financial intermediary which collects deposits from the savers and channels funds to borrowers. In this sense, loans and advances are the outputs of a bank and inputs are labor, capital and deposits.
Based on the production and intermediary approach discussed above, this paper estimates the following two models using DEA method with variable returns to scale assumption for each bank during 2008-2013.
Model A: Depositj = X1 + X2 + X3
Where X1-= Capital costs, X2 = Interest expenses, X3 = Labor cost Model B = Loansj = X1+ X2 + X3
Where X1-= Fixed capital, X2 = Deposit, X3 = Labor cost Parametric and Non-Parametric Tests
The efficiency of the entire period 2008-2013 is divided onto two samples. Sample 1 consists of the efficiency of banks during the global financial crisis period (GFC). 2008-2010 is considered as the global financial crisis (GFC) period. Sample 2 considers the efficiency of banks during 2011-2013 as the post GFC period.
Whether the efficiency level of the Islamic banks between the global financial crisis period and the post global financial crisis period remains stable is determined using parametric tests and non-parametric test. Parametric tests include t-test, ANOVA (Analysis of Variance) F-test, and Walch-F test. On the other hand non-parametric tests include Wilcoxon/Mann-Whitney test, Kruskal-Wallis test.
Whether to apply the parametric test or the non-parametric or the both test is determined by whether the variables, efficiency level, in the sample set of GFC period and PGFC period is normally distributed. Parametric test is appropriate if the variables (efficiency) of both sample periods are normally distributed. On the other hand, both parametric and non-parametric tests are applied if the variable of one sample is normally distributed and the other is not.
Jarque Bera test is applied to determine whether the efficiency score of the DMU in the two samples (GFCP and PGFCP) is normally distributed. The failure to reject the null hypothesis of normal distribution at a probability less than 0.10 confirms that the variable is normally distributed. Otherwise, the variable is not normally distributed.
Once the variable (efficiency) is determined, whether normally distributed, two hypothesizes—null hypothesis and alternative hypothesis—will be tested in determining whether the efficiencies of the Islamic banks between the two periods, are stable. Null hypothesis, H0: µGFC = µpostGFC. Where µGFC = mean efficiency of the global crisis period and
µtpostGFC =mean efficiency of the post global crisis period.
Alternative hypothesis, Ha :µGFC ≠ µpostGFC : There is a difference in the efficiency level
If the null hypothesis (H0: µeGFC = µtpostGFC) that there no difference in the efficiencies of
Islamic banks between the GFC and post GFC is rejected, it can be concluded that the efficiency level of the Islamic banks is not stable i.e. global financial crisis had has impacted on the efficiencies Malaysian Islamic banks. On the other hand, if the null hypothesis cannot be rejected, it can be concluded that the efficiencies of Islamic banks are the same between the two periods which suggest that the global financial shock has had no impact on the efficiencies of Islamic banks. The efficiencies of the Islamic banks are stable.
Empirical Results
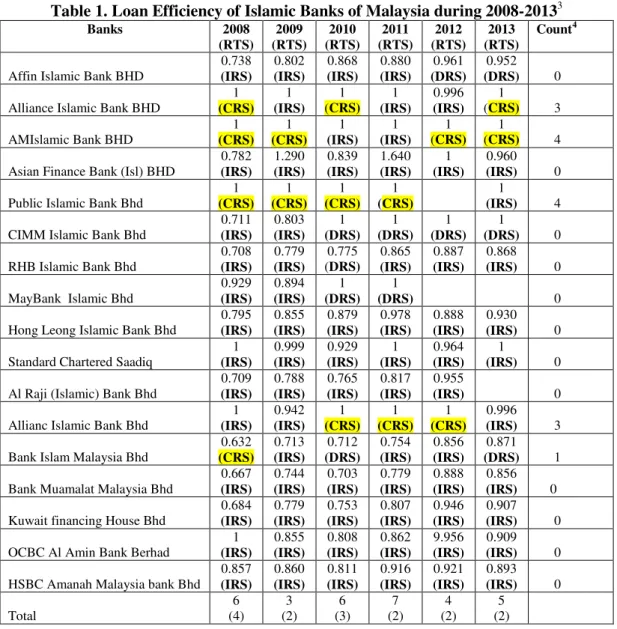
The loans and deposits efficiency of each Islamic bank during 2008-2013 are presented in Table 1 and Table 2.
Table 1. Loan Efficiency of Islamic Banks of Malaysia during 2008-20133
Banks 2008 (RTS) 2009 (RTS) 2010 (RTS) 2011 (RTS) 2012 (RTS) 2013 (RTS) Count4
Affin Islamic Bank BHD
0.738 (IRS) 0.802 (IRS) 0.868 (IRS) 0.880 (IRS) 0.961 (DRS) 0.952 (DRS) 0
Alliance Islamic Bank BHD
1 (CRS) 1 (IRS) 1 (CRS) 1 (IRS) 0.996 (IRS) 1 (CRS) 3 AMIslamic Bank BHD 1 (CRS) 1 (CRS) 1 (IRS) 1 (IRS) 1 (CRS) 1 (CRS) 4 Asian Finance Bank (Isl) BHD
0.782 (IRS) 1.290 (IRS) 0.839 (IRS) 1.640 (IRS) 1 (IRS) 0.960 (IRS) 0
Public Islamic Bank Bhd
1 (CRS) 1 (CRS) 1 (CRS) 1 (CRS) 1 (IRS) 4
CIMM Islamic Bank Bhd
0.711 (IRS) 0.803 (IRS) 1 (DRS) 1 (DRS) 1 (DRS) 1 (DRS) 0 RHB Islamic Bank Bhd 0.708 (IRS) 0.779 (IRS) 0.775 (DRS) 0.865 (IRS) 0.887 (IRS) 0.868 (IRS) 0 MayBank Islamic Bhd 0.929 (IRS) 0.894 (IRS) 1 (DRS) 1 (DRS) 0
Hong Leong Islamic Bank Bhd
0.795 (IRS) 0.855 (IRS) 0.879 (IRS) 0.978 (IRS) 0.888 (IRS) 0.930 (IRS) 0
Standard Chartered Saadiq
1 (IRS) 0.999 (IRS) 0.929 (IRS) 1 (IRS) 0.964 (IRS) 1 (IRS) 0
Al Raji (Islamic) Bank Bhd
0.709 (IRS) 0.788 (IRS) 0.765 (IRS) 0.817 (IRS) 0.955 (IRS) 0
Allianc Islamic Bank Bhd
1 (IRS) 0.942 (IRS) 1 (CRS) 1 (CRS) 1 (CRS) 0.996 (IRS) 3
Bank Islam Malaysia Bhd
0.632 (CRS) 0.713 (IRS) 0.712 (DRS) 0.754 (IRS) 0.856 (IRS) 0.871 (DRS) 1
Bank Muamalat Malaysia Bhd
0.667 (IRS) 0.744 (IRS) 0.703 (IRS) 0.779 (IRS) 0.888 (IRS) 0.856 (IRS) 0
Kuwait financing House Bhd
0.684 (IRS) 0.779 (IRS) 0.753 (IRS) 0.807 (IRS) 0.946 (IRS) 0.907 (IRS) 0
OCBC Al Amin Bank Berhad
1 (IRS) 0.855 (IRS) 0.808 (IRS) 0.862 (IRS) 9.956 (IRS) 0.909 (IRS) 0
HSBC Amanah Malaysia bank Bhd
0.857 (IRS) 0.860 (IRS) 0.811 (IRS) 0.916 (IRS) 0.921 (IRS) 0.893 (IRS) 0 Total 6 (4) 3 (2) 6 (3) 7 (2) 4 (2) 5 (2) 3
RTS in the parenthesis = returns to scale of the bank. CRS= Constant returns to scale, DRS = Decreasing returns to scale, IRS= Increasing returns to scale.
4
Results of loan technical efficiency, Table 1, show six banks in 2008, three banks in 2009, six banks in 2010, seven in banks 2011, four banks in 2012, and five banks in 2013 are technically efficient i.e. they do not waste resource. On the other hand, results of scale efficiency show only four banks in 2008, three banks in 2010, and two banks in 2009 and 2011-2013 were scale efficient. They operate on the CRS.
The banks that are both technical and scale efficient are Alliance Islamic Banks, AMIslamic banks berhad, Public Islamic Bank, and Bank Islam Malaysia. Alliance Islamic banks and AMIslamic banks were in the efficient frontier four times in six years. Public Islamic banks and Bank Islam Malaysia were in the efficient frontier three times and one time respectively. The rest of banks were not operating in the efficient frontier.
Table 2. Deposit Efficiency of Islamic Banks of Malaysia during 2008-20135
Banks 2008 (RTS) 2009 (RTS) 2010 (RTS) 2011 (RTS) 2012 (RTS) 2013 (RTS) Count6
Affin Islamic Bank BHD
0.90 (IRS) 1 (CRS) 1 (CRS) 1 (CRS) 0.895 (DRS) 0.901 (DRS) 3
Alliance Islamic Bank BHD
1 (CRS) 1 (CRS) 1 (CRS) 1 (CRS) 1 (IRS) 1 (CRS) 5 AMIslamic Bank BHD 1 (CRS) 1 (CRS) 1 (IRS) 1 (CRS) 1 (CRS) 1 (CRS) 5
Asian Finance Bank (Isl) BHD
0.851 (IRS) 0.737 (IRS) 1 (IRS) 1 (IRS) 1 (IRS) 1 (IRS) 0
Public Islamic Bank Bhd
0.939 (IRS) 1 (IRS) 0.877 (IRS) 0.898 (IRS) 0.967 (IRS) 0
CIMM Islamic Bank Bhd
0.753 (IRS) 0.981 (DRS) 1 (DRS) 1 (DRS) 1 (CRS) 1 (DRS) 1 RHB Islamic Bank Bhd 0.778 (IRS) 0.933 (DRS) 0.902 (DRS) 0.973 (DRS) 0.914 (DRS) 1 (CRS) 1 MayBank Islamic Bhd 0.880 (IRS) 0.860 (DRS) 1 (DRS) 1 (DRS) 0
Hong Leong Islamic Bank Bhd
0.787 (IRS) 0.947 (DRS) 0.950 (DRS) 1 (CRS) 0.993 (DRS) 1 (CRS) 2
Standard Chartered Saadiq
1 (CRS) 0.988 (IRS) 0.892 (CRS) 1 (DRS) 0.884 (IRS) 1 (IRS) 2
Al Raji (Islamic) Bank Bhd
0.795 (IRS) 0.898 (DRS) 0.842 (DRS) 0.860 (DRS) 0.865 (IRS) 0
Allianc Islamic Bank Bhd
1 (CRS) 0.976 (IRS) 1 (CRS) 1 (CRS) 1 (CRS) 0.999 (IRS) 3
Bank Islam Malaysia Bhd
0.764 (IRS) 1 (DRS) 0.937 (DRS) 0.944 (DRS) 0.930 (IRS) 1 (CRS) 1
Bank Muamalat Malaysia Bhd
0.762 (IRS) 0.981 (DRS) 0.921 (DRS) 0.942 (DRS) 0.852 (DRS) 0.867 (DRS) 0
Kuwait financing House Bhd
0.749 (IRS) 0.863 (DRS) 0.821 (DRS) 0.855 (DRS) 0.799 (IRS) 0.869 (IRS) 0
OCBC Al Amin Bank Berhad
1 (IRS) 1 (CRS) 1 (CRS) 0.963 (DRS) 0.814 (DRS) 0.921 (IRS) 2
HSBC Amanah Malaysia bank Bhd
0.940 (IRS) 0.952 (IRS) 0.881 (DRS) 0.939 (DRS) 0.874 (DRS) 0.931 (IRS) 0 5 (4) 6 (4) 8 (5) 9 (5) 5 (3) 8 (5) 5
RTS in the parenthesis = returns to scale of the bank. CRS= Constant returns to scale, DRS = Decreasing returns to scale, IRS= Increasing returns to scale.
6
Results of deposit technical efficiency, Table 2, show five banks in 2008, six banks in 2009, eight banks in 2010, eleven in banks 2011, five banks in 2012, and eight banks in 2013 are technically efficient i.e. they did not waste resources. On the other hand, results of scale efficiency show only four banks in 2008 and 2009, five banks in 2010 and 2011, and three banks in 2012 and five banks in 2013 were scale efficient. They operate on the CRS.
The banks that are both technical and scale efficient are Affin Islamic Bank, Alliance Islamic Banks, AMIslamic banks berhad, Hong Leon Islamic bank and Standard Chartered Saadiq Bank, Bank Islam Malaysia, and OCBC Al Amin Bank. Alliance Islamic banks and AMIslamic banks were on the efficient frontier five times in six years. Affin Islamic Bank was on the efficiency frontier three times during the study period. Hong Leon bank and OCBC Al Amin Bank were on the efficient frontier two times in six years. Other banks were not operating in the efficient frontier.
Descriptive statistics of loans and deposit efficiencies of the Islamic banks of Malaysia are provided in Table 3 and Table 4.
Table 3. Descriptive Statistics of the Loan Efficiency of Islamic banks
2008 2009 2010 201111 2012 2013 Mean 0.836000 0.888412 0.873059 0.958706 1.0047867 0.942800 Median 0.795000 0.855000 0.868000 0.978000 0.961000 0.952000 Maximum 1.000000 1.290000 1.000000 1.640000 9.956000 1.000000 Minimum 0.632000 0.713000 0.703000 0.754000 0.856000 0.856000 Std. Dev. 0.142760 0.140804 0.111715 0.196837 2.326557 0.055370 Skewness 0.070519 1.316227 -0.052522 2.481181 3.471718 -0.244135 Kurtosis 1.338657 4.817349 1.512528 9.705763 13.06000 1.509504 Jarque-Bera 1.969132 7.248071 1.575056 49.29454 93.38430 1.537491 Probability 0.373601 0.026675 0.454968 0.000000 0.000000 0.463594 Sum 14.21200 15.10300 14.84200 16.29800 23.21800 14.14200 Sum Sq. Dev. 0.326086 0.317212 0.199685 0.619916 75.78018 0.042922 Observations 17 17 17 17 15 15
Table 4. Descriptive Statistics of the Deposit Efficiency of Islamic banks
2008 2009 2010 2011 2012 2013 Mean 0.876353 0.948000 0.942529 0.963176 0.921333 0.963667 Median 0.880000 0.981000 0.950000 1.000000 0.914000 1.000000 Maximum 1.000000 1.000000 1.000000 1.000000 1.000000 1.000000 Minimum 0.749000 0.737000 0.821000 0.855000 0.799000 0.867000 Std. Dev. 0.102178 0.072032 0.063307 0.050185 0.073193 0.051368 Skewness 0.053953 -1.692064 -0.510878 -1.132305 -0.179740 -0.917737 Kurtosis 1.356945 5.303276 1.859410 2.989437 1.640421 2.231402 Jarque-Bera 1.920485 11.86983 1.660994 3.632735 1.236051 2.474817 Probability 0.382800 0.002645 0.435833 0.162615 0.539008 0.290135 Sum 14.89800 16.11600 16.02300 16.37400 13.82000 14.45500 Sum Sq. Dev. 0.167044 0.083018 0.064124 0.040296 0.075001 0.036941 Observations 17 17 17 17 15 15
The examination of Table 3 shows that the mean loan efficiency increases over the years 2008-20013 except in 2013. The average loan efficiency during 2008-2013 was 0.83., 0.88, 0.87, 0.95, 1.0, and 0.94 respectively. This indicates that the average wastage of input resources for banks was 17 percent, 12 percent, 13 percent, 5 percent, 0 percent, 4 percent respectively. Banks could easily maximize loan financing without using these resources.
Similarly, the mean deposit efficiency, Table 4, shows that it increases during 2008-2013 except in 2012. The average deposit efficiency during 2008-2008-2013 was 0.87, 0.94, 0.94, 0.96, 0.92, and 0.96 respectively. This indicates that the average wastage of input resources of Islamic banks was 13 percent, 6 percent, 6 percent, 4 percent, 8 percent, 4 percent respectively. Banks could easily maximize loan financing without using these resources.
Efficiencies of Islamic banks are divided between the global financial crisis period 2008-2010(GFC) and the post global financial crisis period 2011-2013 (PGFC) for determining whether efficiencies are stable. Descriptive statistics of the efficiencies between the GFC and the PGFC are presented in Table 5 and Table 6
Table 5. Descriptive Statistics of Loan Efficiency during the Global Financial Crisis and the Post Global Crisis
Variables During GFC Efficiency Post GFC Efficiency
Mean 2.597471 3.156353 Median 2.529000 2.793000 Maximum 3.000000 11.72700 Minimum 2.057000 1.000000 Std. Dev. 0.336928 2.284848 Skewness -0.159506 3.318321 Kurtosis 1.571183 13.21472 Jarque-Bera 1.518161 105.1065 Probability 0.468097 0.000000 Sum 44.15700 53.65800 Sum Sq. Dev. 1.816332 83.52851 Observations 17 17
Table 6. Descriptive Statistics of Deposits Efficiency during the Global Financial Crisis and the Post Global Crisis
Variables During GFC Efficiency Post GFC Efficiency
Mean 2.766882 2.626412 Median 2.740000 2.874000 Maximum 3.000000 3.000000 Minimum 2.433000 1.000000 Std. Dev. 0.173971 0.565915 Skewness -0.122115 -1.816672 Kurtosis 2.054387 5.259020 Jarque-Bera 0.675630 12.96559 Probability 0.713327 0.001530 Sum 47.03700 44.64900 Sum Sq. Dev. 0.484252 5.124148 Observations 17 17
The important point to notice in Table 5 is that the data of loan efficiency variable of banks during the global financial crisis is normally distributed. This is evidenced from the probability 0.468 associated with the Jarque Bera statistics 1.518. On the other hand, the efficiency of the post global financial crisis is not normally distributed. The null hypothesis of normal distribution is rejected and is evidenced by the probability 0.000 associated with the Jarque Bera statistics 105.105.
The normal distribution of efficiency variable during the GFC period and its non-normal distribution during the post GFC period suggests the application of parametric tests and non-parametric tests for determining the equality of efficiency between the two periods.
Similarly, the important point to notice in Table 6 is that the data of deposit efficiency of the Islamic banks during the global financial crisis is normally distributed. This is evidenced from the probability 0.7133 associated with the Jarque Bera statistics 0.6756. On the other hand, the efficiency variable of banks during the post global financial crisis is not normally distributed. The null hypothesis of normal distribution is rejected and is evidenced by the probability 0.0015 associated with the Jarque Bera statistics 12.965.
The normal distribution of deposit efficiency during the GFC period and the non-normal distribution during the post GFC period suggests the application of parametric tests and non-parametric tests for determining the equality of efficiency between the two periods.
Results of the parametric tests and non-parametric tests are provided in Table 7 and Table 8.
Table 7. Parametric Test Results of the Null Hypothesis
Parametric Tests: H0: μGFC = μpGFC
ANOVA F-test t-test Welch F-test*
Variable df Values Probability df Values Probability df Values Probability
Loan eff (1, 32) 0.99 0.32 32 -0.99 0.32 (1,16.69) 0.99 0.32
Deposit eff
(1,32) 0.95 0.33 32 0.97 0.33 (1,18.99) 0.95 0.34
*Test allows for unequal cell variances
The results of all parametric tests for loan and deposit efficiency fail to reject the null hypothesis of the equality mean efficiency between the global financial crisis and the post global financial crisis period. The failure to reject the null hypothesis suggests that the efficiencies of Islamic banks are the same between the global financial crisis and the post global financial crisis. It also suggests that the global financial shock has had no impact on the efficiencies of Islamic banks. The efficiencies of the Islamic banks are stable.
Table 8. Non-Parametric Test Results of the Null Hypothesis
Non Parametric Tests: H0: MedianGFC = MedianpGFC
Wilcoxon/Mann-Whitney Median Chi-square Kruskal-Wallis
Variable df Values Probability df Values Probability df Values Probability
Loan eff 0.79 0.42 1 1.05 0.30 1 0.65 0.41
Deposit eff
0.34 0.73 1 1.05 0.30 1 0.13 0.71
The results of all non-parametric tests for loan and deposit efficiency fail to reject the null hypothesis of the equality mean efficiency between the global financial crisis and the post global financial crisis period. The failure to reject the null hypothesis suggests that the efficiencies of Islamic banks are the same between the global financial crisis and the post global financial crisis. It also suggests that the global financial shock has had no impact on the
efficiencies of Islamic banks. The efficiencies of the Islamic banks are stable. Global financial crisis did have impacted the efficiencies of the Islamic banks of Malaysia.
Conclusions
DEA is applied in estimating the technical and scale efficiencies for the Islamic of Malaysia during 2008-2013. The results of the DEA estimate showed that the average technical efficiency of loan financing was 83 percent , 88 percent , 87 percent, 95 percent, 100 percent and 94 percent in 2008, 2009, 2010, 2011, 2012 and 2013 respectively (Table 3).
The average technical efficiency for deposit mobilizations was 87 percent, 94 percent, 94 percent , 96 percent, 92 percent, and 96 percent in 2008, 2009, 2010, 2011, and 2013 respectively (Table 4).
Results of loan technical efficiency, Table 1, show that six banks in 2008, three banks in 2009, six banks in 2010, seven in banks 2011, four banks in 2012, and five banks in 2013 are technically efficient i.e. they do not waste resource. On the other hand, results of scale efficiency show that only four banks in 2008, three banks in 2010, and two banks in 2009 and 2011-2013 were scale efficient. They operate on the CRS.
Results of deposit technical efficiency, Table 2, show that five banks in 2008, six banks in 2009, eight banks in 2010, eleven in banks 2011, five banks in 2012, and eight banks in 2013 are technically efficient i.e. they did not waste resources. On the other hand, results of scale efficiency show only four banks in 2008 and 2009, five banks in 2010 and 2011, and three banks in 2012 and five banks in 2013 were scale efficient. They operate on the CRS.
Parametric and non-parametric tests were applied in determining whether the efficiencies of the Islamic banks of Malaysia were significantly different during the global financial crisis period and the post global financial crisis period. The results of parametric and nonparametric tests for both loan and deposit efficiency showed no significant differences. There were no differences in the efficiencies of the Islamic banks of Malaysia between the global financial crisis (2008-2010) and the post global financial crisis (2011-2013). The failure to reject the null hypothesis confirmed this result. The failure to reject the null hypothesis of the equality of the mean and median of efficiencies between the global financial crisis and the post global financial crisis period suggests that the efficiencies of the Islamic banks of Malaysia are stable. The global financial crisis had no impact on the technical efficiencies of the Islamic banks of Malaysia.
References
Andries, Alin., Vasile Cocris. 2010. A comparative analysis of the efficiency of Romanian Banks, Romanian Journal of Economic Forecasting, 4, 54-75.
Apps, Peter. 2008. ―Global Financial Centers Battle for Islamic Markets‖, International Herald Tribune, July 25.
Barr, R., and T. Siems. 1994. Predicting bank failure using DEA to quantify managerial quality, Federal Reserve Bank, Dallas, Financial Industries Studies Working Paper No. 1-94. Berger, A., and L. Mester. 1997. Inside the black Box: What explains the differences in the
efficiencies of Financial Institutions, Journal of Banking and Finance, 21, 895-947. Berger, A.N., and D.B. Humphry. 1992. Measurement and Efficiency issues in commercial
banking, Output measurement in the service Sectors, National bureau of Economic Research, Chicago University Press, Chicago, IL, pp.245-279
Chong, Beng Soon., and Ming-Hua Liu. 2009. Islamic Banking: Interest free or Interest based? Pacific-Basin Finance Journal, 17, 125-144.
DeYoung, R.,and G. Whalen. 1994. Is a consolidated Banking industry an efficient banking industry? Office of the Controller of the Currency, Quarterly Journal, 13 (3), 10-21 Economist: September 13th -19th, 2014
El-gamal .,and Inanoglu. 2004. Islamic banking in Turkey: Boon or Bane for the financial Sector: Proceedings of the firth Harvard University forum on Islamic Finance, Cambridge: Center for Middle Eastern Studies, Harvard University.
Kirigia, Joses M., and Eyob Z Asbu. 2013. Technical and Scale efficiency of public community hospital in Eritea: An Exploratory study, Health Economic Review, 3(6), 1-17.
Koster, paul. 2009. http://WWW. Business247.ae/
ticles/2009/4/pages/18042009/04192009_5ae5bf647 f4e46428e694dc436d437b6.aspx
Onour, A Ibrahim., and Abdelgadir M.A. Abdullah. 2011. Efficiency of Islamic banks in Sudan: A non-parametric Approach, Journal of Islamic Economic, Banking and Finance, 7(4), 79-92.
Rossi, S., M. Schwaiger, and G. Winkler. 2005. Managerial behavior and cost/profit efficiency in the banking sector of Central and Eastern European countries, Working Paper 96, Oesterreichische National bank
Samad, A (1999).―Relative Performance of Conventional banking vis-à-vis Islamic Bank in
Malaysia.‖ IIUM Journal of Economics and Management, Vol. 7 No.1, pp 1-25.
Samad, A. (2004) ―Bahrain Commercial Bank‘s Performance during 1994-2001‖, Credit and financial Management Review, 10(1), 30-40.
Samad, Abdus. 2013. Are Islamic Banks Immune from Global Financial Crisis: Evidences from 16-Cross-Country Islamic Banks", Global Journal of Management and Business Research, 13-C (8), 1-6.
Schumpeter, Joseph A .1911. The Theory of Economic Development, Harvard University Press, Cambridge, MA
Sufian, Fadzlan. 2009. Determinants of bank efficiency during unstable macroeconomic environment: Empirical evidence from Malaysia, Research in International Business and Finance, 23, 54-77.
Sufian, Fadzlan., and M.Z. Abdul Majid. 2006. Bank ownership, Characteristics and Performance: A Comparative analysis of Domestice and Foreign Islamic Banks in Malaysia, Journal of King Abdul Aziz University –Islamic Economics, 21 (2), 3-38. Wheelock, D.C., and P.W. Wilson. 1994. Explaining bank failures: Deposit Insurance,
regulation, and Efficiency, Review of Economics and Statistics, 77, 689-700. Appendix
Table 1. Descriptive Statistics of Inputs and outputs7 Fixed Capital (FX) FK2008 FK2009 FK2010 FK2011 FK2012 FK2013 Mean 90647.72 136516.0 94464.90 93817.96 39334.58 33820.62 Median 5349.243 7500.000 7822.000 5662.000 11734.00 6642.500 Maximum 1156318. 1907143. 1160265. 1170183. 222240.0 209278.0 Minimum 176.0000 464.0000 578.0000 417.0000 235.0000 146.0000 Std. Dev. 276669.4 457554.2 278412.1 281957.1 65625.29 60474.40 Interest Expenses (INTEX)
INTEX2008 INTEX2009 INTEX2010 INTEX2011 INTEX2012 INTEX2013 Mean 413836.5 649960.4 355639.2 439183.3 176264.1 195421.6 Median 43054.00 165113.0 111139.0 152363.0 58430.00 57076.00 Maximum 5012989. 4528635. 3160604. 3654518. 1196288. 1308113. Minimum 6604.000 27288.00 8358.000 9594.000 9957.000 1016.000 Std. Dev. 1193114. 1203876. 750951.3 869315.9 298116.5 337067.8 Wages (WAG)
WAG2008 WAG2009 WAG2010 WAG2011 WAG2012 WAG2013 Mean 37820.58 46431.19 193529.7 220731.7 83127.44 88120.35 Median 9281.000 19123.25 43249.00 59852.00 65148.00 69048.00 Maximum 212863.0 224561.0 2184302. 2546570. 386129.0 438850.0 Minimum 614.0000 1010.000 677.0000 799.0000 1608.000 10297.00 Std. Dev. 56247.94 57393.81 522802.4 605292.1 100234.1 110872.3 Deposits
DEP2008 DEP2009 DEP2010 DEP2011 DEP2012 DEP2013 Mean 9551287. 11077900 17113306 20100695 15453935 18471228 Median 4306094. 4431772. 4027754. 5496732. 5377039. 8853076. Maximum 55768861 64131506 1.75E+08 2.01E+08 70984469 83017613 Minimum 34498.65 48334.11 15306.73 20029.94 181688.0 201872.0 Std. Dev. 13398271 15758539 41494349 47568326 18329346 21655959
7
Loans and Advances
LOAN2008 LOAN2009 LOAN2010 LOAN2011 LOAN2012 LOAN2013 Mean 8128836. 10260044 14835495 18936355 13915779 16564054 Median 4242329. 4833591. 4138867. 5298429. 8483879. 9175173. Maximum 52574320 56947831 1.51E+08 1.82E+08 61308071 86135734 Minimum 249827.7 1911270. 2331.000 4561.000 148059.0 182405.0 Std. Dev. 12486782 14025794 35682146 43966797 15508633 20649469