Cleveland State University
EngagedScholarship@CSU
ETD Archive2014
Looking and Liking: Applying Information
Processing to Facebook Ads
Jennie A. Ford
Cleveland State University
Follow this and additional works at:https://engagedscholarship.csuohio.edu/etdarchive Part of theCommunication Commons
How does access to this work benefit you? Let us know!
This Thesis is brought to you for free and open access by EngagedScholarship@CSU. It has been accepted for inclusion in ETD Archive by an authorized administrator of EngagedScholarship@CSU. For more information, please [email protected].
Recommended Citation
Ford, Jennie A., "Looking and Liking: Applying Information Processing to Facebook Ads" (2014).ETD Archive. 378. https://engagedscholarship.csuohio.edu/etdarchive/378
LOOKING AND LIKING: APPLYING INFORMATION PROCESSING TO FACEBOOK ADS
JENNIE A. FORD
Bachelor of Arts in Communication Cleveland State University
May 2012
Submitted in partial fulfillment of requirements for the degree
MASTER OF ARTS IN APPLIED COMMUNICATION THEORY & METHODOLOGY at the
CLEVELAND STATE UNIVERSITY May 2014
ii
We hereby approve this thesis for JENNIE A. FORD
Candidate for the Master of Arts in Applied Communication Theory & Methodology degree for the
School of Communication
and the CLEVELAND STATE UNIVERSITY College of Graduate Studies
CHERYL BRACKEN
________________________________________________________________ Thesis Chairperson
School of Communication - April 22, 2014
GARY PETTEY
_________________________________________________________________ Thesis Committee Member
School Of Communication - April 22, 2014
ANUP KUMAR
_________________________________________________________________ Thesis Committee Member
School of Communication - April 22, 2014
iii
Dedication
This thesis is dedicated to my mother, Marsha, my husband, Lee and my children, Braxtyn, Ryenne, and Lauryn. Thank you for your endless love, support and encouragement.
iv
Acknowledgement
I would like to thank my committee members who were more than generous with their expertise and invaluable time. A special thanks to Dr. Cheryl Bracken, my committee chairperson for her endless hours of reflection, reading, encouragement and most of all patience throughout this process. A big thank you to Dr. Gary Pettey and Dr. Anup Kumar for agreeing to serve on my committee. And finally, a special thanks goes to Dr. Paul Skalski, who began as my committee chairperson, believed in me and encouraged me to pursue social media research. He is no longer with us, but is up in the heavens looking down. Rock on P$!
v
LOOKING AND LIKING: APPLYING INFORMATION PROCESSING TO FACEBOOK ADS
JENNIE A. FORD
ABSTRACT
This study applied the Limited Capacity Model (Lang, 2000) to understand how
individuals’ process their Facebook pages. It is an eye tracking study that collected data from students at a Midwestern university to analyze how individuals process, encode, store and retrieve posts from their Facebook pages, specifically suggested/sponsored posts that are integrated into their newsfeed and targeted to them based on known information. The individuals explored their Facebook pages and were asked to recall the brands or advertisements they were first exposed to on their page. The results from eye tracking were used to analyze how they oriented to and whether they attended to the targeted message. The data collected from this study lays a foundation for how these types of messages are processed for future marketing initiatives and which factors to consider when strategically targeting an audience via a Facebook suggested/ sponsored post. This study found that individuals who liked the brand in their Facebook
suggested/sponsored post were able to recall and recognize the brand more than individuals who disliked the brand in their Facebook suggested/sponsored post.
vi TABLE OF CONTENTS ABSTRACT…...………..……… v LIST OF FIGURES ………..……… ix LIST OF TABLES ………...……….……… x CHAPTER I. INTRODUCTION……… .. 1 Evolution of News……….. 3 News on Facebook……… 3
II. LITERATURE REVIEW………. … … 6
Macro Structure of News….……….……… 6
Advertising in Newspaper……….……….8
Advertising in Digital News………….……… 9
Facebook………..……… 10
Who Uses Facebook……… 11
Macro Structure of Facebook………11
News Reading Behavior………12
Advertising on Facebook………. 13
Marketing Information for Facebook……….. 15
Limited Capacity Model………16
Cognition……… 17 Encoding ……… 18 Storage……… 19 Retrieval……… 19 Hypothesis 1……… 20 Hypothesis 2………..… 20 Target Marketing………..… 20
Sponsored/Suggested Facebook Posts……… 21
Suggested Posts……… 22 Research Question 1……….……… 24 Product Integration……… 25 Application of LCM on FB……… 26 Hypothesis 3……… 26 Research Question 2………. 26 1. Facebook Usage……….. 27 Research Question 3……… 28
vii Research Question 4……… 28 2. Summary of Hypotheses ……… 28 III. METHOD……… 29 Design………...… 29 Stimulus………...……… 29 Eye-Tracking Hardware/Software………...… 30 Participants……… 30 Independent Variables………...… 30 Dependent Variables……….… 32 Procedure………..… 33 IV. RESULTS……….…… 35 News Usage ……… 35 Advertising ……….. 35
Absence of Facebook Suggested/ Sponsored Post…………... 36
Facebook For News Consumption ……… 38
Advertising on Facebook ……… 38
Facebook Usage………. 39
Recall and Recognition ……… 39
Results of Hypotheses and Research Questions ……….. 40
Hypothesis 1………... 40 Research Question 1………... 42 Research Question 2……….…...…… 42 Research Question 3……… 43 Research Question 4……… 45 Hypothesis 2………... 45 Hypothesis 3………. 47 Additional Analyses ………. 48 Gaze Analysis ……….. 48
Factors That Could Influence Overall Recall Three-way …… 49
ANOVA Conclusion………. 50
V. DISCUSSION……….. 52
Project Summary and Findings……….. 52
The Limited Capacity Model………..………… 55
Eye-Tracking as a Valuable Method ……….. 56
Suggestions for Advertisers………. 56
Limitations………... 58
Future Research………... 59
viii
VI. BIBLIOGRAPHY………. 61
ix
LIST OF FIGURES
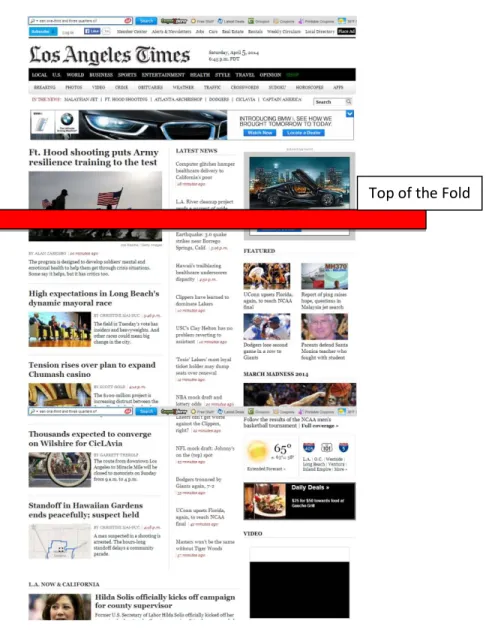
FIGURE 1 Example of Print Newspaper Above the Fold……..………. 8
FIGURE 2 Example of Digital Newspaper Above the Fold……… 10
FIGURE 3 Example of Facebook Page Above the Fold……….……… 12
FIGURE 4 Poynter Research Findings……….. 13
FIGURE 5 Suggested/ Sponsored Set-up……….……… 23
FIGURE 6 Sponsored Post………..……… . 24
FIGURE 7 Suggested Post………....…… 25
FIGURE 8 Means of Recall and Recognition……….. 40
x
LIST OF TABLES
TABLE 1: Correlation Table of Facebook Usage and Type of Post………...… 37 TABLE 2: ANOVA Table: Fixation, Typology of Post ……… 41 TABLE 3: ANOVA Table: Attitude Toward Embedded Post and Overall …… 43
Recall Score
TABLE 4: Correlation Table of Facebook Usage and Overall Recall Score….. 44 TABLE 5: ANOVA Table: Reading Behavior and Overall Recall Score ……. 45 TABLE 6: Correlation Table of Attitude Toward Brand and Overall Recall…. 46
Score
TABLE 7: ANOVA Table: Relationship with Brand and Overall Recall Score... 48 TABLE 8: Results of t-tests and Descriptive Statistics of Gaze and ………… 49
Fixation by Recall
TABLE 9: Three-way ANOVA Table: Reading Behavior, Typology of Post… 50 And Fixation with Overall Recall Score
1
CHAPTER I INTRODUCTION
Facebook, an expanding realm in social media, continues to grow at astounding rates. Recently, the presence of advertising has penetrated into what once was strictly a site for communication and connections with friends, acquaintances and family.
Facebook, which began as a medium for college students to connect with other college students on campus via the internet, today contains or presents the profiles of not only college students but their parents, grandparents, kids and even animals. It now serves both as a venue for keeping others updated on page holder’s daily lives and a unique venue for businesses to interact and develop relationships with their customers (Prosio, 2013).
Social media marketing is intriguing due to its overwhelming growth and
benefactors. One facet of Facebook to consider is its evolution: How it has developed and where it is going. One purpose of this study is to examine how digital presentation of information in news has evolved from print to digital presentations and still integrates product placement. Not only are Facebook executives integrating ads for products, but the technology also allows the programmers to utilize profile information and previous shopping behavior saved in cookies to target individuals with products and services.
2
Further, these targeted ads are often linked to “friends” in order to build creditability and influence an individual even more.
The Limited Capacity Model (Lang, 2006) offers a theoretical and methodological framework for how people process mediated messages. This may allow us to better understand how product integration and targeted marketing messages on Facebook influence attention and memory of brands in an effort to determine overall effectiveness of social media advertising. According to Lang’s (2000) Limited Capacity Information Processing Model, the viewer, the medium and the content all influence how cognitive resources are allocated when processing a mediated message. The medium “controls for automatic allocation of processing resources by eliciting orienting responses in viewers” (Lang, Borse, & Wise, 2002, p.217). The structural features of television-- including cuts, edits, movements and flashes of light and sound-- elicit orienting responses (Lang,
Greenwald, Bradley & Hamm, 1993). The structural features of radio including voice changes and sound effects are known to elicit orienting responses as well (Potter, Lang & Bolls 1999). The newspaper itself, both in print and digital, elicit orienting responses through structural features such as layout and placement of stories and advertisements. Images are used to draw individuals into the story and headlines are meant to entice individuals to read the full article. The macro structure of news is used to layout news stories and delineates which news stories are of higher importance and therefore worth orienting to.
3
Evolution of News
Since the early 20th century, newspaper circulation has been on the decline. Recently, 24 of the 25 largest newspapers reported record declines in circulation (Vukanovic, 2011). Due to this decline in financial resources, social media (especially Facebook) has provided a framework for traditional media sectors to alter their format to fit.Since news seems to continue to be an ever-evolving technique of information dissemination, it’s fair to suggest that the newspaper is evolving into a digital, multi-vocal format. Digital presentations allow media users the ability to select personalized information, to interact, and to share information with others. Research has found that people use social media sites to interact with brands in an effort to (1) obtain information about potential purchases, (2) be introduced to new products and (3) have their mind changed about a brand (Powers, Advincula, Austin, Graiko & Snyder, 2012). However, individuals may no longer need to search for products and services as the products are now finding them via social media with targeted marketing (Vukanovic, 2011).
Advertisements began with the onset of newspapers and continue to follow suit with the placement of news.
News on Facebook
The Pew Research Center informs the public about the issues, attitudes and trends shaping America and the world. They conduct public opinion polling, demographic research, media content analysis and other empirical social science research (Mitchell, 2013). In a recent study, Mitchell (2013) found approximately 47 percent of adult Facebook users get news from this medium and about 34 percent of young people (18-29
4
year-olds) consume news from Facebook. The findings suggest that individuals do not go to Facebook for news consumption but to see what friends are up to (77%), to chat with friends (49%) and for personal updates (26%). Nevertheless, the more time spent on Facebook, the more likely they consume news than those who do not spend a great deal of time on Facebook. News is shared by users and therefore distributed in newsfeeds; the longer an individual spends perusing newsfeeds, the higher the possibility for news exposure.
Facebook is revolutionizing the way news is consumed. Barnhurst and Nerone (2001) have best defined this new form of news disbursement as a multi-vocal format that encompasses the extension of media users sharing the voice of the news. It is no longer just news reporters and journalists reporting the news, now anybody could shape the dissemination and message of news. This new form is predicted to bring a demise to print newspaper due to a rejection of the larger public ideal and therefore a loss in reader’s loyalty. Facebook’s reach is global and instant; a post could reach across the world with such speed that it could spread news more quickly than ever before, something a printed newspaper will never be capable of:
A recent Economist special report on the news industry concluded that news was ‘returning to its roots as a social medium’- before the advent of the mass media. The Internet, it argued, is taking us back to the conversational culture of the coffeehouse, where news was exchanged and discussed in a lively atmosphere and then further distributed by pamphlet, letter and word of mouth (Newman, 2011, p. 55)
Facebook has become pivotal for driving traffic to news and harnessing the resources necessary for individuals to create news, comment on it, and distribute it throughout the world. “It has become the fastest-growing source of news traffic--, and in some genres
5
and for some websites--these referrals are beginning to rival search as a primary gateway to news” (Newman, 2011, p.55).
To understand how marketers’ initiatives are effective, this study will assess what individuals are looking at on their Facebook pages, how they interpret what they see and whether they can recall what they have seen on their Facebook page which is a specific focus of suggested/sponsored posts. The Limited Capacity Model is the model used to explicate this phenomenon suggesting that individuals are information processors with limited capacity and therefore only process a portion of what they see. Since Facebook is an ever-growing media platform that consists of multiple messages with a similar format to newspaper, I am interested in applying The Limited Capacity Model to individuals and their attention, storage and retrieval of Facebook messages, specifically the
suggested/sponsored posts on their personal Facebook newsfeeds.
The next section details the literature on the evolution of advertising in conjunction with news and The Limited Capacity Model as a theoretical resource for understanding information processing of advertising on Facebook. The remaining chapters provide detail about the methodology, results, and discussion.
6
CHAPTER II
REVIEW OF LITERATURE
Macro-Structural News
Journalists and news editors are consistently using macro structures to select stories to share with their audiences via television newscasts or in newspapers. The structures they use shape the public’s perception of important issues and how to think about the issue, as defined by McCombs in the use of agenda setting.
In choosing and displaying news, editors, newsroom staff, and broadcasters play an important part in shaping political reality. Readers learn not only about a given issue by also how much importance to attach to that issue from the amount of information in a news story and its position. In reflecting what candidates are saying during a campaign, the mass media may well determine the important issues that is, the media may set the “agenda” of the campaign (McCombs, 2003, p. 176).
Over time, audiences began to understand the form of news and the cues used to create interest and hold attention, as well as presentation styles of print and broadcast news.
A newspaper’s front-page (See Figure 1) usually has a directory to assist an individual in finding relevant news that the individual can associate meaning with. It is organized with main headlines on the cover above the top fold and sub-categories ranging from arts to sports neatly constructed within. Individuals know to find the “big” stories
7
on the cover and other stories (of less importance) tucked inside. This notion suggests that individuals begin looking at the cover of the newspaper first and disburse from there.
The top fold is considered the most desirable spot for the most important news. It's also the prime location for advertisers. Newspaper designers put a lot of thought into the content that is above the fold. A catchy headline and a compelling photo are key to grabbing a reader's attention.Above the fold can be used in website design. In this context, it represents content that can be seen without a user having to scroll down the page (Halbrooks, 2014, p. 4).
The consistent use of top fold presentation is vital to this study as the digital presentation of news and information has also adopted this style. For example, Facebook
suggested/sponsored posts, as well as all other Facebook advertisements are usually located toward the top of the page. However, when a media user scrolls, the content moves with an individual’s newsfeed since they are integrated. Facebook designed the page so that the right side advertisements do not scroll and are constantly on the right of an individual’s newsfeed. Facebook suggested/sponsored advertisements are placed throughout an individual’s newsfeed; however, this study is most interested in the use of the Facebook suggested/sponsored posts that are usually located in the second position on the top of the page.
8
Figure 1: Example of Print Newspaper above the Fold
Advertising in the Newspaper
Advertising began in newspapers in the early 18th century. When land and resources became scarce, a need for marketing what was available became necessary (Barnhurst & Nerone, 2001). Newspapers influenced the market revolution in three ways: 1) from an information standpoint, they spread news such as current prices and stock quotes, 2) promoted the sales of goods and services and 3) they marketed themselves as goods (Barnhurst & Nerone, 2001).
Advertising, sparse is the first colonial newspapers, had to come to occupy a large share of space by the time of the [American] revolution. On average, throughout the age of the four page newspaper, ads occupied between one-third and three quarters of total space, with the norm of about-half. At the beginning and the end of this period, printers and publishers isolated advertising at the end of the newspaper, on the back pages, with the most recent ads appearing just after the main original editorial material on pages 2 or 3 (Barnhurst & Nerone, 2001, p. 85).
Soon after ads began to appear on the front page and since then, this formula has dispersed into all forms of news including the most current version, digital news.
9
Advertising in Digital News
An online paper, also known as a web newspaper exists on the World Wide Web or Internet, either separately or as an online version of a printed periodical. In recent years, news has experienced an astounding change in venues of where consumption occurs. About half of Americans get news digitally, topping the numbers for newspapers and radio (Quinn & Adams, 2008). In recent years, online news media is the only
medium that has seen growth while television, newspapers, radio and other mediums have seen a decline. In 2010, online advertising outpaced newspaper advertising with more ad dollars going to online outlets than to newspapers. Digital news is now competing with social network sites for the attention of individuals, especially those under the age of 25. However, Mitchell (2013) suggests that all age demographics have experienced an increase in Internet news consumption. Individuals in their thirties are 30 percent more likely than those 18-24 to say they saw news or news headlines on
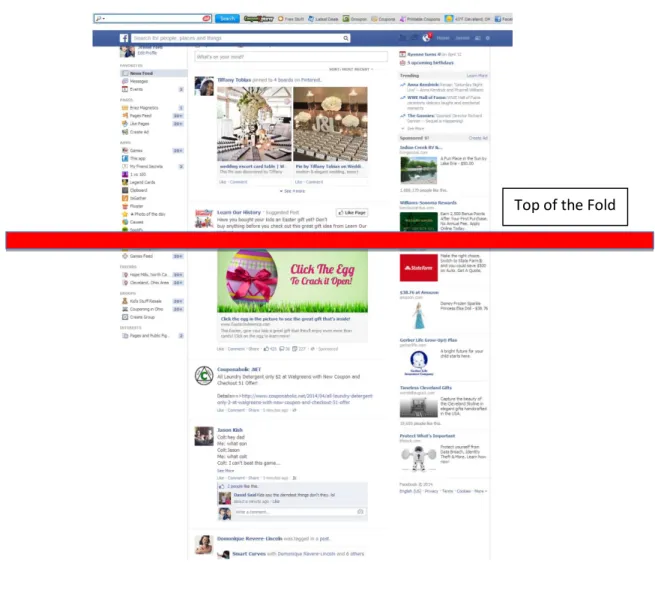
Facebook or another social networking site yesterday (Mitchell, 2013). Figure 2 illustrates what an online periodical looks like and what appears above the fold and thereafter.
10
Figure 2: Example of Digital Newspaper above the Fold
Facebook is by far one of the most popularly visited sites on the Internet. There are currently 128 million daily active users just in the United States, which only accounts for 17 percent of the total 728 million daily active users worldwide (Smith, 2013). When an audience is this large, it’s imperative that marketers find a way to strategically reach them and communicate their message to them effectively. This study suggests that they have implemented product integrated targeted messages to do so.
11
Who Uses Facebook
Generation Y millennia’s with approximately 93 percent logging on daily are the largest group (Shreffler, 2012). Millennia’s consist of those who are 15- 34 years old. These individuals currently make up 66 percent of Facebook users, which suggests that Facebook would be a potentially strong location to target them (Smith, 2013). Cohen (2010) suggests “Those who log on to the site every day amounted to nearly double those who watch television on a daily basis” (p.3). Cohen (2010) surveyed 535 individuals who reported an average age of 27 and an average income of $100,000. The results indicated that 63 percent of the survey respondents use social media to interact with brands. More than half of them say that Facebook — plus blogs and brand videos — impact their opinions of products (Cohen, 2010). A marketing opportunity this large is too big (not to mention potentially inexpensive) for companies to not explore.Social media represents a revolutionary new trend that should be of interest to companies operating in online space-or any space, the focus on both global and personal topics demonstrates how the future content will be increasingly bottom up and consumer driven (Vukanovic, 2011).
Macro-structure of Facebook
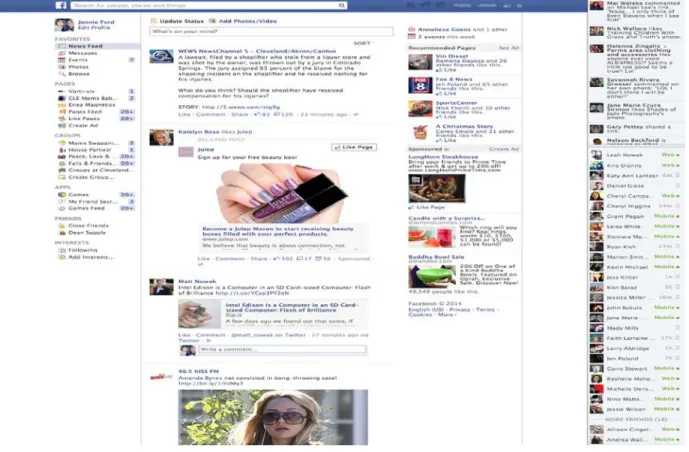
The macrostructure of Facebook or the visual structure of the website with little to no magnification is quite familiar. (See Figure 3) Navigation of tools on the right, the center also known as the newsfeed scrolls through “most recent” or “top stories” and on the right is a column of advertisements for which companies pay for impressions in either the right hand column or for integration into the newsfeed.
12
Figure 3: Example of Facebook Page Above the Fold
News Reading Behavior
Since 1990, Poynter Institute has been tracking how individuals orient to messages in the print newspaper and began tracking digital newspapers in 1999. There are four findings from the Poynter studies of reading print newspapers that can be applied to how individuals attend to their Facebook pages. The four reading behaviors are 1) photos attract attention 2) eyes follow a common pattern of navigation, 3) teasers accompanied by visuals receive far more attention than text only teasers and 4) images were viewed
13
more than text. In the 1999 digital newspaper, The Poynter studies found that online readers viewed text first, then headlines, briefs and cut lines. The photographs attracted more attention than graphics and reading was shallow but wide.
In 2003-2004, The Poynter Institute conducted another digital newspaper study and found that individual’s eyes fixated on the upper left of the page hovered in that area before reading left to right in the pattern of the letter F (See Figure 4) (Quinn & Adams, 2008). The result is that lower parts of the screen received modest viewing and ads in the top and left portions of the page received the most attention, and placement near popular editorial content helped attract eyes to the ad. This information can be applied to our understanding the structure of Facebook and the reasoning behind embedding ads into Facebook newsfeeds.
Figure 4:Poynter Research Findings
Advertising on Facebook
The number of Facebook users increased fivefold from August 2008 to January 2011. An increase in the size of the audience opened the door to advertising and Facebook revenue increased from $52 million in 2006 to $2 billion in 2010 (Vukanovic, 2011).
14
The rebirth of a stronger, highly connected and influential voice was adopted as a new dynamic of social marketing. Social marketing is described as the:
Design, implementation and control of programs calculated to influence the acceptability of social ideas and involving considerations of product planning, pricing, communication, distribution and marketing research and explicit use of marketing skills to help translate present social action efforts into more effectively designed and communicated programs that elicit desired audience response (Kotler & Zaltman, 1971, p.5).
Although social marketing had already been a coined term used to explain information dissemination, the growth of social media renewed interest in social marketing.
Recent technological advancement such as social network sites have fundamentally altered the ways most individuals conduct business, make buying decisions, communicate personally and professionally and spend leisure time, and this impact continues to grow and morph into almost every aspect of daily life (Hill & Moran, 2011). Young consumers tend to be more fickle, engage in more media multi-tasking, and are easily distracted and prone to navigate to stimulating sites (Hill & Moran, 2011). Lombard and Synder-Duch (2001) note that consumers have more control in obtaining product information with interactive advertising. Thus, interactive advertising may seem more personal than traditional advertising and thus more appealing to younger generations. As the cost of reaching consumers via social and web media drops dramatically, our markets are shifting from a one-size fits all model of mass appeal to one of unlimited variety for unique tastes (Vukanovic, 2011).
15
Marketing Information for Facebook
Johnson (2010) defines white space as “a place where a company might have room to maneuver in a crowded playing field” (p.2). Facebook is considered to have exponential potential in their marketing white space with the audience size ability and--more recently-- the ability to target specific individuals based on profile demographics or previous shopping behavior (Williams, 2011). Marketers believe that individuals who see a post in their newsfeed will positively correlate the advertised message due to their associative properties. However, this type of targeted message could possibly elicit a negative associative response when individuals are aware of the targeted message-taking place.
While social networks offer tremendous audience potential, there are still significant doubts about their effectiveness in marketing. Large investors with non-proven
expectations about their potential have fostered their early life, but this market situation will not last forever. Research about advertising effectiveness will be crucial. These Internet-based messages transmitted via social media could influence various aspects of consumer behavior including- awareness, information acquisition, opinions, attitudes, purchase behavior and post purchase communication and evaluation (Mangold & Faulds, 2009).
E-marketers are constantly looking for return on investment and a way to measure an advertisement's success or failure to present to their client because clients want to know how their marketing dollars are spent and if it’s worth it. Unfortunately, Facebook can only supply quantitative data in terms of clicks, views and engagement. It lacks the ability to state how much a customer is worth and whether their efforts on Facebook will
16
even have a return on investment. This notion has led marketers to default to tactics that are more easily and accurately measureable, regardless of their effectiveness. However, all is not completely lost; DEI Worldwide (2008) conducted a study on the impact of social media on consumer behavior and was able to provide the following interesting statistics:
• 70 percent of consumers have visited social media sites to get information; • 49 percent of these consumers made a purchase decision based on the information
they found through social media sites;
• 60 percent of people in the study said they are likely to use social media sites to pass along information to others online;
• 45 percent of people who searched for information via social media sites engaged in word of mouth compared to 36 percent who found information on a company or news site.
The Impact of Social Media on Consumer Behavior was conducted in 2008 prior to targeted marketing and product placement on Facebook. These concepts have
revolutionized consumer behavior and consumers are no longer searching for products on Facebook, the products are showing up in their newsfeed. This pivot in advertising is now relying on the retention of the brand if the user does not take an immediate action to “like” the page. The Limited Capacity Model is applied to the presentation of Facebook content to determine the level of information processing or retention that
suggested/sponsored posts reach for individuals that are exposed to these kinds of posts.
Limited Capacity Model
The Limited Capacity Model (Lang, 2006) offers a theoretical and methodological framework for how people process mediated messages, which may allow us to better understand how product integrated and targeted marketing messages on Facebook influence attention and memory. A base understanding of how individuals orient, attend
17
and process these messages will aid in explaining how these ad’s placements are most effective.
Cognition
The Limited Capacity Model has two assumptions 1) people are information processors and 2) a person’s ability to process information is limited (Lang, 2006). Information processing is conceived as a group of simultaneously occurring component processes that people perform on stimuli and on mental representation of stimuli that they construct (Lang, 2000). A significant gap exists between advertisers’ assessment of exposure and Internet users’ assessment of exposure. In order for the advertised message to be perceived and memorized, gaining and preferably holding viewer’s attention is required. Since attention is limited and selective, not all information exposed to on a web page can be understood (Lee & Ahn, 2012). Exposure does not guarantee a user’s
attention, an issue especially relevant to the internet, where ad avoidance occurs most frequently (Lee & Ahn, 2012). If an ad is noticed, the message may or may not remain in the consumer’s memory after cognitive processing. The exposure can be unconsciously processed and subsequently change the users affective state (Lee & Ahn, 2012). Since Internet users devote minimal cognitive resources to ad processing, ads are more likely to be processed unconsciously. Thus, memory measures may underestimate the effect of the ad (Lee & Ahn, 2012). For an advertising message to be most effective, consumer
attention and cognitive processing are equally important (Lee & Ahn, 2012). Some of these sub processes are automatic and some are controlled. Automatic processes happen without conscious volition on the part of the message recipient. Controlled processes are
18
those that people intend. This model proposes three sub processes of information processing (a) encoding (b) storage and (c) retrieval (Lang, 2000).
Encoding
This involves getting the message out of the environment (i.e. off the page or screen) and into a person’s brain. The first step to encoding a message is the message must engage at least one of the sensory receptors including eyes, ears, nose, mouth, and, skin (Lang, Lee, Chung & Borse, 2001). The mental representation of the message that is activated in working memory is not a veridical or precise representation of the message, but rather a representation that reflects both which specific bits of information any given person has selected for representation and the act of constructing a mental representation, this is influenced in turn by goals, knowledge, environment of the person receiving the message.Orienting to the visual stimulus of television is highly correlated with the internal processes of conscious attention and with memory for television content
(Thorson & Zhao, 1997). Sokolov (1963) noted that novel stimulation induced a variety of physiological changes in the body that collectively cued an orienting response (OR) (Bradley, Keil & Lang, 2012). Attention to a programming segment has often been found to predict memory of that segment (Wells, 1997). New media usage contributes to
decreasing attention paid to media messages, a problematic reality for marketers (Hill & Moran, 2011). Attention is limited and selective, therefore only a portion of the
information on a web page attracts the people’s attention (Lee & Ahn, 2012). Without attention, no further processing can occur to influence subsequent consumer decision-making. More attention leads to more opportunity to encode and store messages and a positive relationship between attention and memory has been found by a number of eye
19
tracking studies (Lee & Ahn, 2012). Once users pay attention to the message, their cognitive and affective processes are triggered. This results in changes in their behavior as well as in their psychological state, including memory, attitude and preference (Lee & Ahn, 2012). Limited capacity model proposes that attention is under the dual control of the audience member and the characteristics of the message. Audience members can purposefully allocate attention based on goals. Attention can also be reflexively elicited from audience members by features on the message (Bolls, Lang & Potter, 2001).
Storage
Associative network models conceptualize individual memories as being connected to other related memories by associations. When a memory is in use, it is activated. Activation can travel through associations, a process that renders related memories more active or available, than unrelated memories (Lang et al., 2001). The more a person links a new bit of information into this associative memory network, the better the information is stored. Some parts will be more thoroughly stored while other parts will only receive cursory storage (Lang et al., 2001). If a person is exposed to a mediated message then the message should automatically make it to the sensory store. The sensory store can hold more information than we can be aware of or attend to only a fraction of the information held in the sensory store moves up to active (Lang et al., 2001).
Retrieval
Many things influence how thoroughly a message is processed, that is how much of the information in the message is encoded, stored and ultimately retrievable (Lang et al., 2001). The process of reactivating a stored mental representation of some aspect of the
20
message is retrieval. The more thoroughly it was stored the more readily retrievable it is (Lang et al., 2001). Two reasons the message may not be processed include 1) recipient may choose to allocate fewer resources to the task than it requires the message may require more resources than the message recipient has available to allocate to the task (Lang et al., 2001).Humans are hardwired to allocate more attention to negative stimuli, which argues that individuals are more likely to remember bad things and people have a natural tendency to maximize pleasantness, suggesting people exhibit an approach response to positive stimuli and an avoidance response to negative stimuli. This information leads to my first Hypothesis:
H1: Participants who attend to embedded suggested/sponsored post should have higher overall recall scores than participants that did not attend to the embedded suggested/sponsored post.
The Limited Capacity Model suggests that depending on an individual’s allocation of attention to the stimuli (Facebook suggested/sponsored post) they will have a differing response than other individuals.
H2: An individual that likes the posted brand will elicit an appetive response and will have higher overall recall scores than an individual who dislikes the posted brand.
Target Marketing
The key principle to target marketing is to meet customers’ individual needs and to direct firms’ marketing efforts and attention to customers who they estimate will yield the most profit over their lifetime (Nguyen, Li & Chen 2012). An example of this is when Levi Straus used social media to offer location targeted specific deals. In one instance, direct interactions with just 400 consumers led to 1,600 people to turn up at one location
21
(Saravanakumar & SuganthaLakshmi, 2012). Researchers agree that the level of
involvement reflects the degree of personal relevance or importance of the message to an individual. If the message is personally relevant, a person is expected to process the information at a deeper level than if s/he were to find it not personally relevant (Anthony & Leavitt, 1984; Hopkins, Raymond & Mitra, 2004).
According to Wall Street Journal, Facebook has adopted a system to allow targeted advertising to specific networks of people with similar interests. This system lets
marketers target users based on the massive amounts of information people reveal on the site about themselves as well as previous shopping behavior which can be collected from the computer’s cookies. Eventually Facebook hopes to refine the system in such a way that it could predict what products and services an individual would be interested in prior to their search (Saravanakumar & SuganthaLakshmi, 2012).
Sponsored/ Suggested Facebook Posts
The options of targeting individuals, although both are paid, there two different methods with two different outcomes: sponsored and suggested. A sponsored post is best defined by Facebook as:
Sponsored Stories are built around user activity. Advertisers simply pay to
highlight an action that users have already taken on the social network or within a Facebook-connected app. That action is shown to a user’s friends, either in the sidebar or in News Feed. Sponsored Stories cannot be used to reach an audience that is not connected to the page or app through a friend. (Darwell, 2013, p. 4) The most common sponsored posts are “Page Like” but can include check-ins, offer claims, Likes on individual posts, or any custom Open Graph action. Companies could also promote when customers share their business with the company’s domain.
22
The goal of Sponsored Stories is to get more users to take the same action that a friend has. If a page wants Likes, it can show Page like Sponsored Stories. If a retailer wants more users to claim an offer, it can show Offer Claimed Sponsored Stories. If a company wants more sweepstakes entries in its custom Open Graph app, it can create Sponsored Stories about users “entering a sweepstakes” (Darwell, 2013, p. 8).
To clarify what a sponsored post is: it is a post that individuals will only see if they have a relationship with the brand or their friend on Facebook does. It is user generated that is shared based on a friend liking the page. A sponsored post will tell the individual that their friend likes the page and will offer the same opportunity to that individual based on the premise that that “you are who you hang out with” therefore if a friend likes the content, the individual should as well like the content.
Suggested Posts
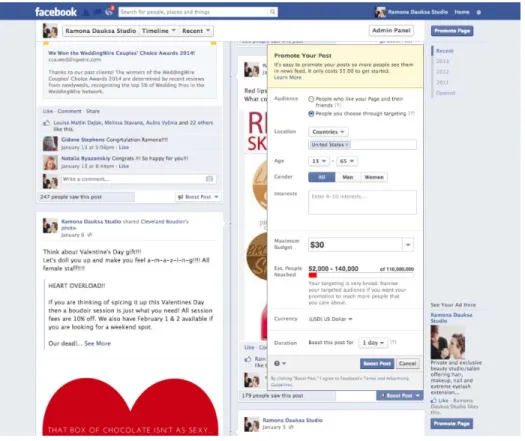
Unlike a sponsored post, a suggested post requires no user-generated actions to appear in a person’s newsfeed. It begins as a post on the fan page and gets extended reach through paid distribution among fans, friends of fans, or non-fans within newsfeed or the sidebar. Figure 5 demonstrates how a Facebook suggested post is set up. It has multiple targeting options including audience, people who like your page, and their friends, versus people you choose through targeting. In the targeting option, the marketer can select country, age, gender and even interests.
The newest tool for targeting individuals on Facebook is “Customizing your Audience.” This option lets marketers identify individuals’ email addresses, phone numbers, Facebook IDs, and App IDs. The marketer selects their budget and it will tell them their possible reach based upon that budget and the duration of the post. An
23
example of budget choices is a range from $15 to reach between 26,000-69,000 individuals to $400 to reach between 500,000 to 1,300,000 individuals on average (Facebook, 2014).
Figure 5: Suggested/ Sponsored Set-up
The image below, Figure 6 demonstrates a sponsored post. The second post on an individual’s newsfeed on a desktop computer is usually a suggested/sponsored post. This post not only suggests that the individual would like this product, but has furthered its influence by telling the individual that their friend likes this product. Figure 7, a suggested post is for Wendy Williams. The individual who received this post was targeted by profile information and the company paid for post distribution based on targeted information. Future research in this area could be conducted on different
24
mediums such as phones and tablets. Facebook suggests a page, post, game or application based on the medium that the individual is using.
R1: How does the type of post influence overall recall score?
Figure 6: Sponsored Post
25
Figure 7: Suggested Post
Product Integration
Product Integration refers broadly to the practice of the incorporation of a product or service into the content of a medium under some sort of arrangement (McCarty & Lowrey, 2003). The increase in the number of venues in which product integrations appear, as well as the total increase in number of integrations is likely due to a number of factors. These include (1) the growing dissatisfaction among marketers with the
performance of traditional advertising, (2) a growth in the infrastructure that facilitates product integrations, (3) perceptions of the success of previous brand mentions in particular venues and (4) increase in the production costs or various venues (McCarty & Lowrey, 2003). Product integrations are unlike traditional advertising. Friestad and Wright (1994) discuss consumers persuasion knowledge is relevant to considerations of how consumers might process product integration differently than traditional advertising. Some consumers view product integration as a persuasion attempt by marketers and when
26
consumers are confronted with a message that they perceive as a persuasive attempt, they will process the message differently (Petty & Cacioppo, 1984). Individuals may get distracted from the message, disengage from the communication and develop assessments of the persuasion effort and the company related to the communication.
Application of Limited Capacity Model to Product Integrated Targeted Messages on Facebook
Within this framework, product integrated and targeted messages can be
conceptualized as both positive and negative stimuli, exhibiting pleasant or unpleasant features either visually or structurally. The Limited Capacity Model suggests that individuals exposed to a pleasant message will elicit an appetitive response. If an individual likes the message since it is supplying information that is targeted to the individual within their frame, this should increase their appetitive response. If an individual dislikes the message since it is unsuccessfully targeted to them and finds the message to be intrusive within their frame, then their aversive response should increase. As a result of eliciting an appetitive response from positive stimuli, the individual should allocate more resources to the encoding, storage and retrieval of the message. Thus, the following Hypothesis is posited:
H3: Individuals with an existing relationship with the brand will have a higher overall recall score than individuals who did not report a relationship with the brand.
R2: How does attitude toward embedded posts influence the allocation of information processing resources (recognition, cued recall correct, cued recall incorrect, free recall)?
27
Facebook Usage
The way in which an individual processes information can be influenced by their use of the medium. Individuals that use social media more often are more likely to skim information and not process information in the way that somebody who rarely uses social media would start from the top and thoroughly read through information (Lee, 2011). Heavy media users are actually slower and less accurate in tests of processing ability and those who are lighter media users were in fact faster and more accurate at digesting information (Lee, 2011). Both those who scan and those who focus on media are equally susceptible to a canned message, but it depends on the form. Scanners are more likely to notice advertising on a web page where it's simultaneously competing against the content. They are unlikely to focus on a single thing for too long, so they anxiously look about the page, taking note of every element. Individuals have to encode, process, and store any given information at the same time and since the processing capability is limited, individuals have to make important decisions:
Because it is not possible for media users to encode and store all the information in the message, the viewer continuously (on a conscious or subconscious level) selects which information in the message to encode, process, and store (Lang et al., 2002, p. 216)
This notion suggests a better retention of the information by those who rarely use Facebook and slow down and focus on certain messages. According to The Limited Capacity Model, the allocation of resources (storage, encoding and retrieval) should correspond with certain demographic factors. It can be expected that recognition, cued recall and free recall are higher for those participants that have a lower usage of their Facebook account, which influences my next research question.
28
R3: How does Facebook usage influence overall recall score (recognition, cued recall correct, cued recall incorrect, free recall)?
R4: How does Facebook reading behavior influence overall recall score (recognition, cued recall correct, cued recall incorrect, free recall)?
Summary of Hypotheses
The three hypotheses used in this study accounted for sensory orienting responses, activation by association and appetitive versus aversive responses; all of which Lang (2000) suggest will report a higher recall from information processing resource consumption. Eye attention or fixation, tracks where the participant’s look at one individual location, Hypothesis 1 suggest that a participant will have a higher recall if they attend to the Facebook suggested/sponsored post. Hypothesis 2 suggests that a participant would have a higher recall if they like the Facebook suggested/sponsored post. Hypothesis 3 suggests that if a participant reports an existing relationship with the brand in their Facebook suggested/sponsored post then they too would have a higher recall.
29
CHAPTER III METHOD
Design
In a quasi-experiment, participants viewed their own Facebook pages and their eye movements were tracked. In order to analyze how an individual processes their Facebook page by applying The Limited Capacity Information Processing Model, a series of tools were utilized to test their overall retention of information.
Stimulus
Individuals viewed their own Facebook page in an ecologically reliable fashion – or as close as they normally would. Since this study is meant to understand the
effectiveness of product integrated targeted messages on Facebook, each individual was asked to log-on to their personal Facebook account and bring up their newsfeed. They were allocated no more than one minute to view their newsfeed since the Facebook suggested/sponsored post should be relatively close to the top. They were not informed of the purpose of the study to better facilitate an open approach to the study.
30
Eye Tracking Hardware/ Software
Eye-tracking hardware (Tobii X-30) and iMotion software were utilized to measure fixation duration (i.e. total duration of eye fixation on target stimuli) and gaze duration (i.e. total duration of eye gaze on target stimuli).
Participants
Participants of this study included 61 college students enrolled at Cleveland State University. Of the 61 participants, 5 did not have a Facebook account, 17 did not have a suggested/sponsored post on their account, 17 participants had a suggested post and 22 had a sponsored post resulting in 39 individual’s remaining for the final analysis. Of the eligible participants, there were 17 female participants (43.6%) and 22 male participants (56.4%). The average age was 22.67 years old (SD=5.46).
Independent Variables
Facebook Usage. Six questions were asked to measure individual’s depth in Facebook participation. These measures include Facebook adoption, Facebook general usage, Facebook recent usage, Facebook visitations, number of Facebook friends and how many businesses one follows of Facebook (See Appendix A for actual questions).
Attitude Towards Target Marketing on Facebook. One question that asked whether the individual would prefer ads to match their needs and interests or if they would prefer random ads. The exact question used was “Would you prefer random or ads that match your interests and needs?”
Attitude Towards Advertising. Three questions were asked to measure existing attitude towards advertising in general. Cronbach’s Alpha was .01; therefore the scale
31
was not used. Instead an independent item “I usually do not pay attention to advertisements.” was reverse coded and selected to measure attitude toward brand.
Attitude Towards Product Placement. Three questions were asked to measure existing attitude towards Facebook embedded ads with a Cronbach’s Alpha of .53. Due to a low Cronbach’s alpha score, only one item was reverse coded and selected: “I usually do not pay attention to advertisements embedded in my Facebook newsfeed.”
Attitude Towards Brand. Six semantic differentials assessing how the participant felt about the brand they saw on their Facebook newsfeed. Examples include “Dislike- Like, and “Positive- Negative.” Cronbach’s Alpha was .94
Attitude Towards Advertising. One open-ended question was asked to assess if the participants thought that advertising in general was positive or negative. Reponses were coded for “positiveness”.
Reading Behavior. The researcher watched recorded video of all participants and coded individuals 0-1 based on their reading behavior. Scanners had sporadic and increasingly quick eye movements all over the page (62%) and were coded as 0, while methodological readers began at the top, read left to write and top to bottom were coded as 1.
Relationship with brand. Participants were asked to self-report if they have an existing relationship with the brand that appeared in their suggested/sponsored post. Responses were coded for 0= no relationship and 1= known relationship.
Orientation. The Tobii Attention tool collected data on participant’s eye patterns. Orientation was measured by gaze. The data collected was continuous and ranged from 0
32
to 5464 milliseconds. The orientation variable was segmented to reflect even participants (n=13) in either low (0-1301 ms), medium (1302-1921 ms) or high (1922-5464 ms).
Attention. The Tobii Attention tool collected data on participant’s eye patterns. Attention was measured by fixation. The data was continuous and ranged from 0-3265 milliseconds. The attention variable was segmented to reflect even participants in each category of low (0- 134 ms), medium (135 -865 ms) or high (866 -3265 ms). The low category did not divide evenly due to multiple variables sharing the same amount of milliseconds, therefore there were low (n= 15), medium (n =11) and high (n=13).
Suggested/ Sponsored Post. As the experiment took place the researcher recorded the type of post. Facebook provided the type of post within the post. The difference between suggested and sponsored is how they are generated. A sponsored post is user generated and can only be seen by those who either have a relationship with the brand or are receiving the post because their Facebook friend has a relationship with the brand and has taken an action that has then generated the post. A suggested post occurs when a post is boosted i.e. paid to have a further reach. The individual is targeted based on profile information including demographics, interests, geographic location, relationship to brand or Facebook friend, or information obtained from IP cookies. It was coded for
“sponsoredness” of post where 0 = suggested and 1= sponsored.
Dependent Variables
Free Recall. Free recall measured whether the message reached the level of retrieval.
33
Before any other recall or recognition questions, the participant was asked to recall which brand they saw on their Facebook suggested/sponsored post in their newsfeed in an open-ended manner. The researcher recorded whether the participant answered correctly.
Cued Recall. Participants were presented with cued recall prompts to measure whether the message reached the stage of storage. All participants were asked two recall questions. The first one was always an incorrect brand, the second was always the correct brand seen on their Facebook suggested/sponsored post. The researcher recorded whether the participant answered correctly.
Recognition. Recognition was used as an indicator of whether the message reached the stage of encoding. It was measured through a two alternative forced recognition test administered on index cards. The researcher recorded whether the participant answered correctly.
Overall Recall Score. The four individual recall measures were used to create a summated scale – Overall Recall. The variables free recall, cued recall correct, cued recall incorrect and recognition was summed to create an overall recall and recognition variable that was used in all analyses involving recall or recognition. The range of the new variable was 0-4 (mean = 1.85).
Procedure
The participants engaged in this experiment individually. At the beginning of each session, participants were greeted and were given a basic introduction to this study that was to be on their “Facebook usage.” The study was organized and completed in less than 30 minutes. Each participant was asked to answer demographic and Facebook usage questions before logging on to their Facebook page, where they were asked to stay on
34
their newsfeed. After one minute and 10 seconds, the participants were redirected to answer questions about ads in general and news on Facebook. Once complete, participants were asked to recall and recognize brands from their Facebook
suggested/sponsored post. The survey concluded with attitude toward brand, targeted posts and embedded posts.
35
CHAPTER IV RESULTS
To give a basic understanding of the individuals used in this study and those that were excluded in the major portion due to absence of Facebook and/or Facebook
suggested/sponsored post, a preliminary analysis is provided on all 61 participants from whom data was collected. They were surveyed on news consumption and attitude toward advertising as a general mechanism. The sample (n = 61) was 59% male. The mean age was 23 (SD= 5.56) and they were majority white (57.4%). Their results are reported below:
News Usage
Participants were asked questions regarding their news consumption and their use of Facebook. Most participants (51%) reported they do not use Facebook as a news source. Their overall preference for obtaining news was 3% print (n = 2), 15% digital newspaper (n = 9), 21% social media (n = 13), 38% television (n = 23), 13% radio (n = 8) and other 9.8% other (n = 6). See Appendix C for preference for obtaining news
frequency table.
Advertising
In general, of the 61 participants (73.8%) disagreed that advertisements provide useful information, 63.9% felt that advertisements were deceptive and 54.1% reported
36
that they usually do not pay attention to ads. The frequency tables for attitudes towards advertising (See Appendix D).
Absence of Facebook Suggested/Sponsored Post
The overall experiment began with 61 participants, 5 were removed due to not having a Facebook account. The 5 people who were removed were 4 males and 1 female. Four out of five of them were over the age of 26. In addition to the 5 removed for not having a Facebook account, 15 were removed for not having a Facebook suggested/ sponsored post. Of the 15 participants who did not have a Facebook suggested/sponsored post, they were 66% male with a mean age of 23.07 (SD = 5.89).
A correlation table (See Table 1) was tabulated to look for significant relationships in Facebook usage to explain the absence of a Facebook
suggested/sponsored post with the 15 participants that were removed due to a lack of Facebook and/or Facebook suggested/sponsored post. This table demonstrates a significant relationship between variable “When is the last time you looked at your Facebook page” and whether not the participant had a suggested/sponsored post. The correlation matrix illustrates Pearson correlations among all variables used in the analysis including Facebook adoption (r =.00 p = ns), Facebook general usage (r = -.15, p = ns), Facebook recent usage (r = -.34, p <.01), and Facebook visitations (r = .23 p = ns). This significant relationship means the more recently a participant visited Facebook, the more likely they would have a Facebook suggested/sponsored post.
37
Table 1: Correlation Table of Facebook Usage and Presence of Suggested/Sponsored Post 1 2 3 4 5 Presence of Suggested/ Sponsored Post (1) 1.00 Facebook Adoption (2) .00 1.00 Facebook General Usage (3) -.15 -.38** 1.00 Facebook Recent Usage (4) -.34** .27 -.15 1.00 Facebook Visitations (5) -.26 .21 -.37** .61** 1.00
Note: **Correlation is significant at p<.01 (two-tailed), *Correlation is significant at p<.05 (two-tailed)
There were three other significantly correlated relationships. First, between the variables: Facebook general usage and Facebook adoption (r = -.38, p <.01). This result suggests the more time an individual spends on Facebook, the less likely they are late adopters of the medium. Second, there was a significant correlation between the variables: Facebook visitations and Facebook General Usage( r = -.37, p < .01)
suggesting that individuals who visit their Facebook account more frequently are more likely to also spend more time on Facebook. Lastly, there is a significant correlation between the variables: Facebook Visitations and Facebook Recent Usage (r = .61, p <
38
.01) suggesting that individuals who spend more time on their Facebook account are more likely to have visited their Facebook account recently.
All participants (n = 61) were asked what other social network sites they used and three stood out; 23% reported using Instagram (n = 14), 38% reported using Twitter (n = 23) and 26% reported using Tumblr (n = 16) while 90% of all participants (n = 56) used Facebook.
From this point forward, only the 39 participants who had a Facebook suggested/sponsored were used in the analyses. There were 17 female participants (43.6%) and 22 male participants (56.4%). The average age was 22.67 (SD=5.46). Their responses on Facebook usage Facebook for news consumption and attitude toward advertising on Facebook are reported henceforward.
Facebook for News Consumption
Forty-one percent of participants (n = 16) reported an unfavorable opinion of having news in their newsfeed while 33% (n = 13) did not mind and 26% (n = 10) enjoy having news in their newsfeed (See Appendix D) for the frequency tables on news consumption. Reported news sources followed by participants include: BBC, Fox, Washington Post, Bellevue Gazette, ESPN, New York Times, ABC, CBS, NBC, Associated Press, PBS, and NPR.
Advertising on Facebook
When participants (n = 39) were asked about advertisements embedded into their Facebook Newsfeed, only 45% of participants (n = 17) disagreed that advertisements provide useful information, 34% (n = 13) agreed that embedded ads on Facebook were
39
deceptive and 47% (n = 18) reported that they do not usually pay attention to ads. See Appendix E for attitudes towards embedded posts frequency tables.
Facebook Usage
Participants (n = 39) were asked when they created their Facebook account; their open ended responses were recoded to delineate early (n = 10) middle (n = 21) and late (n = 6) adopters of the medium. Early was 2006-2008, middle was 2009-2011 and late was 2012-2013. Eighty-seven percent of participants reported their Facebook usage (n = 34) as 0-3 hours per day and 13% reported their Facebook usage to be 4-8 hours. Seventy-seven percent of participants (n = 30) reported that the last time they accessed their Facebook account was the day of the study, 15% reported the last time they accessed their Facebook account was yesterday (n = 6), a couple days ago (n = 1), four days ago (n= 1) and not at all (n = 1). Forty-eight percent of the participants (n = 19) reported they access their Facebook account 3+ times per day, 30% reported accessing their Facebook account 1-3 times per day (n = 12), 15% reported 1 every few days (n = 6), 3% reported 1 every few weeks (n = 1) and 3% reported less than once a month (n = 1). Forty-six
percent of the participants (n = 18) reported having 200+ friends, 20% reported 150- 200 friends (n = 8), 10% reported 101-150 friends (n = 4) 15% reported 50-100 friends (n = 6), 8% reported 10-50 friends (n = 3). None of the participants reported less than 10 friends. However, 71 percent of participants (n = 28) reported following only 8 or less businesses.
Recall and Recognition
When participants (n = 39) were asked to free recall their suggested/ sponsored posted brand only 12% (n = 5) answered correctly. Participants were then asked to cue
40
recall with the incorrect brand, and 85% (n = 33) were able to provide the correct answer, stating that the brand on the index card was not the brand they seen on their Facebook suggested/sponsored post. When participants cue recall with the correct brand on their Facebook suggested/sponsored post only 46% (n = 18) were able to recall and correctly identified the brand. Finally, participants were asked to recognize the brand they saw on their Facebook suggested/sponsored post, 41% (n = 16) were correct. See Figure 8 for comparison of all means of recall and recognition variables.
Figure 8: Means of Recall and Recognition
Results of Hypotheses and Research Questions Hypothesis 1
Hypothesis 1 predicted that participants who attend to embedded
suggested/sponsored post have higher overall recall scores in terms of encoding
1.13 1.85 1.54 1.59 0 0.2 0.4 0.6 0.8 1 1.2 1.4 1.6 1.8 2
41
(recognition), storage (cued recall), and retrieval (free recall) than participants that did not attend to the embedded suggested/sponsored post. By computing a variable, overall recall that summed up all freed recall, cued recall correct, cued recall incorrect and recognition, an overall recall and recognition variable was created. This variable was used for further calculations throughout this analysis.
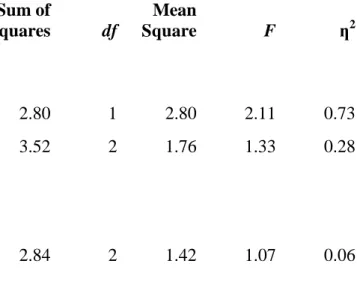
A two-way ANOVA (See Table 2) was conducted looking at the relationship between typology of post and duration of fixation at the post. Hypothesis 1 was not supported. Of all participants (n = 39), 38% had low fixation durations (n = 15), 28% had medium fixation durations (n= 11) and 33% had high fixation durations (n = 13). None of relationships were significant. Fixation duration (F (2, 39) = 1.76, p= ns, Eta squared = .28). Fixation duration and overall recall score (F (2, 39) = 1.42, p= ns, Eta squared = .06).
Table 2 Two-way ANOVA Table: Fixation, Typology of Post
Source of Variation Sum of Squares df Mean Square F ƞ2 Main Effects Typology of Post 2.80 1 2.80 2.11 0.73 Fixation 3.52 2 1.76 1.33 0.28 Two-Way Interactions Typology of Post x Fixation 2.84 2 1.42 1.07 0.06 Note: ** p < .01, * p<.05
42
Research Question 1
This research question asked how the type of post (See Table 3) influenced the overall recall score. The results suggest there is not a significant relationship. An analysis of variance between subjects (ANOVA) was conducted on all 39 participants, 43% had suggested posts (n = 17) and 56% had sponsored posts (n = 22). There was no significant main effect between type of post and overall recall score. Typology of Post (F (1, 39) = 2.11, p= ns, Eta squared = .73). See Appendix L for typology of post frequency and means table.
Research Question 2
Research question 2 asked whether attitude toward embedded posts influence overall recall score. This research question did not have any significant findings. An analysis of variance was conducted with between subject variable “Advertisements embedded in my newsfeed, provide useful information”. Of all participants (n = 39), 34% strongly agreed that advertisements embedded in Facebook posts provide useful
information (n = 13), 20% percent did not agree or disagree (n = 8) and 43% disagreed (n= 17). The relationship between attitude towards embedded posts and overall recall score was not significant (F (4, 38) = 1.53, p = ns, Eta squared = .16) (See Table 3). See Appendix H for attitude toward embed posted frequency table.
43
Table 3: ANOVA Table: Attitude Toward Embedded Post and Overall Recall Score
Source of Variation Sum of Squares df Mean Square F ƞ2 Main Effect Typology of Post 7.56 4 2.8 1.53 0.16 Note: ** p < .01, * p<.05 Research Question 3
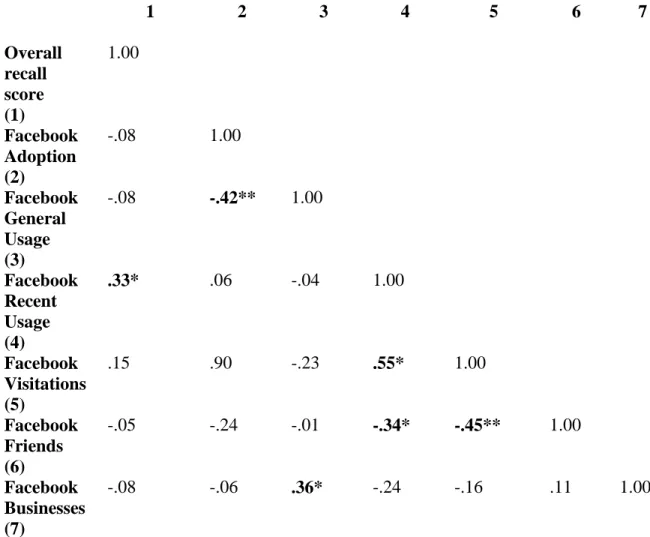
Research question three asked how Facebook usage influences overall recall score. This research question’s findings did have a significant relationship. A correlation table demonstrated a significant relationship between variable “When is the last time you looked at your Facebook page” and overall recall score (r = .33, p <.05). All other variables that measured Facebook usage did not demonstrate a significant relationship. Correlation matrix, (See Table 4) illustrates Pearson correlations among all variables used in the analysis including Facebook adoption (r = -.08, p = ns), Facebook general usage (r = -.08, p = ns), Facebook recent usage (r = .33, p <.05), Facebook visitations (r = .15, p = ns), number of Facebook friends (r = -.05, p = ns) and how many businesses one follows of Facebook (r = -.08, p = ns).
There are five other significant relationships to report in this correlation matrix. First, between variables: Facebook General Usage and Facebook Adoption (r = -.42, p < .01) suggesting the more time spent on Facebook, the earlier the individual adopted Facebook. Second, between variables: Facebook Visitations and Facebook Recent Usage (r = .55, p< .05) suggesting that the more participants visit Facebook, the more recently they visited Facebook. Third between variables: Facebook Friends and Facebook Recent
44
Usage (r = -.34, p< .05) suggesting the friends the individual has on Facebook, the more often they visit Facebook. Fourth, between variables: Facebook Friends and Facebook Visitations (r = -.45, p<.01) suggesting the more friends an individual has on Facebook, the more times they visit Facebook per day. And Finally, between variables: Facebook Businesses and Facebook General Usage ( r = .36, p < .05) suggesting the more time spent on Facebook, the more businesses the participant followed.
Table 4: Correlation Table of Facebook Usage and Overall Recall Score
1 2 3 4 5 6 7 Overall recall score (1) 1.00 Facebook Adoption (2) -.08 1.00 Facebook General Usage (3) -.08 -.42** 1.00 Facebook Recent Usage (4) .33* .06 -.04 1.00 Facebook Visitations (5) .15 .90 -.23 .55* 1.00 Facebook Friends (6) -.05 -.24 -.01 -.34* -.45** 1.00 Facebook Businesses (7) -.08 -.06 .36* -.24 -.16 .11 1.00
NOTE: **Correlation is significant at p<.01 (two-tailed), *Correlation is significant at p<.05 (two-tailed)