___)
Ts
2q
POLICY RESEARCH WORKING
PAPER
2695
Trade Credit, Financial
Where do firms turn forfinancing in countries with
Intermediary Development,
poorly developed financialand Industry Growth
markets? One source is tradecredit. And where formal financial intermediaries are
Raymond Fisman
deficient, industries that relyInessa Love
more on this source offinancing grow faster.
The World Bank
Development Research Group
Finance
H
Public Disclosure Authorized
Public Disclosure Authorized
Public Disclosure Authorized
POLICY RESEARCH WORKING PAPER 2695
Summary findings
Recent empirical work has shown that financial Using the methodology of Rajan and Zingales (1998), development is important for economic growth, since Fisman and Love show that in countries with relatively well-developed financial markets are more effective at weak financial institutions, industries with greater allocating capital to firms with high-value projects. This dependence on trade credit financing (measured by the raises the question of whether firms with high-return ratio of accounts payable to total assets) grow faster than projects in countries with poorly developed financial industries that rely less on such credit. Furthermore, institutions are able to draw on alternative sources of consistent with the notion that young firms may not use capital to offset the effects of deficient (formal) financial trade credit, the authors show that most of the effect intermediaries. Recent work suggests that implicit they report comes from growth in preexisting firms borrowing in the form of trade credit may provide one rather than from an increase in the number of firms. such source of funds.
This paper-a product of Finance, Development Research Group-is part of a larger effort in the group to study the determinants of access to finance. Copies of the paper are available free from the World Bank, 1818 H Street NW, Washington, DC 20433. Please contact Kari Labrie, room MC3-456, telephone 202-473-1001, fax 202-522-1155, email address klabrie@worldbank.org. Policy Research Working Papers are also posted on the Web at http://econ.worldbank.org. The authors may be contacted at rf250@columbia.edu or ilove@worldbank.org. October 2001. (29 pages)
The Policy ResearcP Working Paper Series disseminates the findings of work in progress to encourage the exchange of ideas about
development issues. An objective of the series is to get the findings out quickly, even if the presentations are less than fully polished. The
papers carry the names of the authors and should be cited accordingly. The findings, interpretations, and concIusions expressed in this
Trade Credit, Financial Intermediary
Development and Industry Growth
Raymond Fisman and Inessa Love*
*The authors are at the Graduate School of Business, Columbia University and the World Bank, respectively. The views expressed here are the authors' own and not necessarily those of the World Bank or its member countries. We thank Charles Calomiris and Stijn Claessens for helpful comments, and Raghuram Rajan and Luigi Zingales for kindly allowing us to use their data in this paper.
I. Introduction
In recent years, there has been increasing interest in the economics literature in the role of
financial intermediaries in promoting economic growth. Recent papers have shown that
improved financial market development is associated with growth, using a variety of
methodologies and datasets.1 One of the basic explanations for this pattern is that the financial
sector serves to reallocate funds from those with an excess of capital, given their investment
opportunities, to those with a shortage of funds (relative to opportunities). Thus, an economy
with well-developed financial institutions will be better able to allocate resources to projects that
yield the highest returns.
This allocative role of financial institutions in promoting development was the focus of
Rajan and Zingales (1998), who found that industrial sectors with a greater need for external
finance develop disproportionately faster in countries with more developed financial markets.
This then begs the question of whether firms with high return projects in countries with poorly
developed financial institutions are able to take steps to mitigate the effects of deficient (formal)
financial intermediaries, and if so, how. One answer, implicit in Rajan and Zingales, is that
firms will be forced to rely more on internally generated funds. Recent work by Petersen and
Rajan (1997), suggests that implicit borrowing from suppliers may provide an additional
possibility. They found that, among small firms in the United States, those with less
well-established banking relationships held significantly higher levels of accounts payable. Similarly,
' Perhaps the earliest work relating financial market development to economic growth is Cameron (1967). More recent work that examines this relationship using cross-country data includes Levine and King (1993) and
Demirguc-Kunt and Maksimovic (1996). More sophisticated approaches have been utilized by: Rajan and Zingales (1998), who use within-country variation in industry characteristics; Bekaert et al (2000), who make use of time-series variation in looking at the effect of financial liberalization on growth; and Rousseau and Wachtel (1998), who look at the links between the intensity of financial intermediation and economic performance in five industrialized countries.
firms in MSA's with a relative scarcity of financial institutions carried higher levels of accounts payable. They suggest that their results imply that trade credit is used as a source of 'financing of last resort' by very constrained firms. Nilsen (1999) looks at this issue from another angle, showing that during monetary contractions small firms, which are likely to be mor- credit constrained, react by borrowing more from their suppliers.
Now, even the most constrained of American firms face far less scarcity of fundl:ag from formal institutions than companies in many other countries, where stock markets are in their infancy, and formal lenders are rare. A natural extension of Petersen and Rajan's reasoning is that firms with financing needs in such countries will be more likely to fall back on ,upplier financing in the form of trade credit as a means of funding growth.
Suppose that it is the case that trade credit is a substitute for institutional financing where financial intermediaries are scarce, and further that it is also true that firms in certain industries find it inherently easier to access trade credit, for reasons that will be discussed in the next section. Then, this would imply a substitutability between 'trade credit suitability' and f.nancial market development. That is, financial market development should matter disproportionately more for firms that cannot make use of trade credit financing, or conversely, firms with access to trade credit financing should face (relatively) fewer difficulties in countries with less developed financial markets.
Using the methodology of Rajan and Zingales (1998), we test this hypothesis, using data from a panel of 37 industries and 44 countries. Consistent with the basic hypothesis outlined above, we find that firms in industries with higher rates of accounts payable exhibit higher rates
of growth in countries with relatively weak financial institutions.2 We find these resulb;s to be
2 We wish to emphasize that our conclusions on the substitutability of trade credit and bank credit are based on the within country variation in trade credit usage across industries. Thus, our results imply substitution between these
very strong, and robust to a wide variety of specifications. However, since trade credit,
particularly in the absence of effective legal enforcement, requires trust and reputation, start-up
firrns may have more difficulty in benefiting from trade credit financing, as described above.
3Consistent with this hypothesis, we find that when growth is measured by the creation of new
establishments, 'credit intensive' industries do not grow significantly more rapidly in countries
with underdeveloped
capital markets.
The rest of the paper will be structured as follows: Section 2 will review the primary
theories of trade credit provision, and discuss why they imply an industry-specific element to
trade credit access. In section 3, we discuss the data sets used in the analysis. Our basic results
are reported in section 4; and we give our conclusions & discussion in section 5.
1. Theories of Trade Credit Provision
There are numerous theories that provide explanations for the provision of credit by
suppliers. These theories often pertain to particular aspects of market structure andlor product
characteristics,
and suggest that certain industries may have a greater ability to utilize trade credit
than others. Since we will be using an industry-specific
measure of trade credit intensiveness,
we will begin by outlining these basic theories of trade credit provision, with particular reference
two sources of financing at the micro level, which is consistent with previous findings for US firms by Petersen and Rajan (1997), described above. However, since both sources of financing are likely to be positively correlated with contract enforcement, legal or otherwise, in a cross-country regression one might observe a positive correlation between trade credit provision and formal financial intermediation, which could be incorrectly interpreted as representing a complementarity between these two sources of financing. This highlights the importance of utilizing cross-industry differences, which allows us to better control for heterogeneity across countries in factors such as legal enforcement.3See, for example, McMillan and Woodruff (2000) for evidence on the relationship between credit access and firm
to industry specificity. Most theories of trade credit provision fall into one of the following categories: 1) comparative advantage in liquidation, 2) price discrimination by suppliers, 3) warranty for product quality, and 4) customized products.
First, several authors have suggested that credit provision will be more likely in circumstances where there is easier resale of the product being sold, since this will alhw the seller to seize and resell its product if default occurs (see, for example, Mian and Smith (1992) and Frank and Maksimovic (1998)). Ease of resale will clearly be related to a number of characteristics of these inputs: depreciation; firm-specificity; inventory stocks. An implication of this theory is that industries that utilize undifferentiated raw materials, and that are required to hold large amounts of raw materials inventories (relative to finished goods inventories) will be better able to obtain trade credit financing where necessary.4
The second theory involves price discrimination as a motive for trade credit provision by suppliers. Brennan, Maksimovic and Zezhner (1988) present this argument, claiming that low competition among suppliers in an input market may create incentives to discriminate among cash and credit customers. This would happen if, first, the demand elasticity (or the reservation price) of credit customers is lower than that of cash customers, and second, if there is adverse selection in the credit market. In addition, trade credit could be used as a strategic instrument in the oligopolistic supplier market. Depending on the degree of competition in the input market, some industries may therefore be more prone to price discrimination by their suppliers. If some industries are 'naturally' concentrated (e.g., because of high fixed costs), and use of inputs are reasonably similar within a given industry, access to trade credit from upstream firms B ill also
4This hypothesis is, in fact, bome out by our data: we find that, in a between industry regression of accounts
payable over assets on raw materials inventories over assets, the coefficient on inventories is positive and statistically significant. Results available from the authors.
be similar. In support of this, an early study by Pryor (1972) finds that the rank ordering of
industrial concentration is highly correlated among 12 developed countries.
Some industries may require trade credit as a guarantee for product quality, as in Long,
Malitz and Ravid (1994). According to their theory, the supplier will willingly extend credit to
allow the customer sufficient time to test the product. Similarly, in Lee and Stowe (1993), and
Emery and Nayar (1998), the choice of trade credit terms offered by the supplier can serve as a
signal of product quality. Certainly, some products, for example high-tech or newly developed
products, need more quality assurance for their inputs than others, such as commodities.
Another theory of credit provision comes from a model in a recent paper by Cunat
(2000). In this paper, supplier-customer
relationships that have tailor made products, learning by
doing, or other sources of sunk costs, will generate a surplus that will increase with the length of
the relationship. This will increase amount of credit that suppliers are willing to provide, since it
ties firms to particular suppliers, thereby increasing the scope for punishment of nonpayment.
Similar to the 'inspection' discussion outlined above, industries with more complex input needs
will better fit this argument.
Finally, of particular relevance for this paper, Smith (1987) provides a theory of credit
provision that spans several categories, using arguments related to product quality guarantees,
market power and sunk costs to generate a model of trade credit terms. She argues that credit
terms will be uniform within industries and differ across industries. The empirical support for
this model is presented in a recent paper by Ng, Smith and Smith (1999), who document wide
variation in credit terms across industries but little variation within industries. This evidence
lends some credibility to our assumption about the industry-specific use of trade credit. We
provide further evidence in the Data section below, in support of our claim that there is an industry-specific element to trade credit intensiveness.
We have laid out, in this section, a number of theories of trade credit provision that may have industry-specific components to them. It is worth noting that the purpose of this paper is not to assess which of these theories are primarily responsible for differences across indu:,tries in reliance on trade credit. Rather, for us, it is sufficient to note that there are many reasons to believe that such differences should exist, to document that such differences do in fact exist in our data, and to show that these differences are consistent and persist over time.
One additional concern related to the theory of credit provision is that many of the enforcement or information problems that may prevent the establishment of financial institutions may potentially affect the ability of firms to obtain trade credit financing. In particular, where rule of law is weak, firms will not have legal recourse in the case of credit nonpayment. This is of concern, since we are claiming that trade credit exists as a substitute for bank financing where the latter is scarce. We will argue, however, that even though weak creditor protection and imperfect information will affect both formal intermediaries and trade credit provider,, trade creditors may mitigate these problems better than formal lenders for several reasons These include advantages in 1) information acquisition, 2) the renegotiation/liquidation process. and 3) enforcement.
The first set of advantages stems from the fact that suppliers are thought to have a cost advantage over banks in acquisition of information about the financial health of the buyers. For example, Mian and Smith (1992) argue that monitoring of credit-quality can occur as a
by-product of selling if a manufacturer's sales representatives regularly visit the borrower. Biais
of default than do banks, and furthermore, that the bank will extend more credit if it observes the
offering of the trade credit by supplier. Alternatively, Smith (1987) argues that the choice of the
trade credit terms made can be used as a screening device to elicit information about buyers'
creditworthiness.
The other arguments follow directly from the preceding discussion: because of
advantages in the liquidation process, described above, the supplier would lend to a customer
even if the bank would not. Finally, sunk costs and repeated interaction (as in the model by
Cunat (2000) discussed above) may generate surplus split among the supplier and the customer
and this surplus will give supplier an advantage over the bank lending in enforcement.
These models taken together provide theoretical grounds for arguing that in the situations
when bank credit is unavailable, trade credit could serve as a (weak) substitute.
5'
6III. Data
The data are primarily drawn from Rajan and Zingales (1998) (referred to below as RZ)
and are described in detail in their paper. A complete list of the variables used in this paper with
the original sources is given in the Table 1. Our primary outcome variable is the real growth in
valued added, estimated for each of 37 industries in 43 countries (UNCTAD, 1999). To estimate
5 These arguments are also consistent with the cross-country pattern in rates of trade credit provision, which is uncorrelated with financial development. This is presumably because the counteracting effects described above cancel one another out in the aggregate. Results available from the authors
6 Note that an alternative theory of trade credit is that it exists to decrease transaction costs of making payments on delivery (Ferris, 1981). According to this explanation, trade credit usage by an industry could be interpreted as the level of transaction costs specific for that industry (for example, some industries need more frequent deliveries of inputs than others and therefore transaction costs will be higher). It is plausible to argue that financial development reduces the transaction costs of payments and therefore will benefit firms (or industries) with high transaction costs disproportionately. This generates the following alternative hypothesis - that industries with higher reliance on trade credit are relatively better off in countries with more developed financial intermediaries. Our results, reported below, strongly reject this alternative hypothesis.
each industry's dependence on external finance, RZ use US firms from the Compustat database. Similarly, we use Compustat to calculate an industry-level "propensity for trade credit". As in RZ, we interpret the US data as 'industry representative' - the actual use of trade credit will vary across countries, and the US firms are likely to represent the desired (optimal) level of trade credit used by firms in a given industry. Using the US trade credit data implicitly assumes that trade credit usage by industries in US is representative of trade credit usage in other countries. This is a strong assumption, borne of necessity, as we do not have adequate cross-countrv data on trade credit usage. However, it is an assumption that has a strong theoretical rationale. Jsing
each country's individual "dependence on trade credit" would be problematic, for reasons of endogeneity: one of our basic assumptions is that trade credit usage is a response to poor financial development. To capture the underlying 'technological affinity' of an industry for trade credit dependence, it is more appropriate to look at a country with well-developed markets, where trade credit choices are, in some sense, optimal. The United States, which is excluded from our regressions, provides a potential 'exogenous' measure of this.
We use the entire universe of Compustat firms, which is merged with CRSP data to obtain correct industry codes. To be consistent with previous work, we take 1980-1989 as our main sample period, and for robustness tests we use data from 1970- 1998. To improve data quality we remove very small firms with sales, total assets or total liabilities less than $1 nmillion;
this reduces the sample size by about 10 percent.7
7In addition to the data quality issues, this restriction is justified by the reasoning that very small firms will ri )t be representative of 'desired' trade credit usage, since it is harder for small firms to obtain trade credit. Also, firms that are mainly equity financed (restriction on total liabilities) are not likely to be representative users of trade crelit. An additional 3% of observations were removed because the ratio of total liabilities to total assets was above I (likely due to data problems and firms in distress). The final dataset has about 3,200 firms with 21,000 observations.
To obtain industry-level measures of trade credit usage we use the ratio of accounts
payable to total assets (APAY), the same measure of the demand for credit used by Petersen and
Rajan (1997). To obtain a value for each industry, we then take industry medians of the ratios
over all firm-years in the relevant time period. This ratio gives the percentage of total assets that
is financed by trade credit, and hence represents an industry's ability to rely on informal credit
rather then institutional financing. As an alternative measure, we also use the ratio of accounts
payable to total liabilities, and obtain similar results. The correlation between these two measures
is 0.84 (see Table
3)*8Exact definitions are given in Table 1.
To construct measures of financial development we use several components available in
the RZ dataset (the original source of financial development data is International Financial
Statistics). Our main measure is the ratio of total credit held by private (non-governmental)
organizations to GDP (PRIV). We concentrate on debt, since the theories laid out in the
preceding section focus on trade credit financing as an alternative to funding by financial
intermediaries, rather than equity or bond market financing. Furthermore, we focus on private
(rather than public) debt, since governmental use of credit is often thought to be contaminated by
political considerations that would not necessarily lead to optimal resource allocation. We do
also report regressions utilizing other measures of financial development such as stock market
development (given by market capitalization to GDP), and total (government plus private) credit
use; we find that our results are not sensitive to the inclusion/exclusion of these other sources of
financing. Finally, in the tests for endogeneity of financial development we use legal origin and
accounting standards as instruments (see Table 1 for definitions and sources).
8 We also experimented with other industry-level measures such as: accounts receivable (as a measure for the industry's need to provide its customers with the credit); inventories; net credit (difference of accounts payable and accounts receivable); and sales to capital ratio as a measure of capital intensity. The main results on accounts payable were always robust to the inclusion of any of these additional measures (the results are available on request).
Table 2 contains data on the median levels of accounts payable used by industries in the US. The ratios for APAY/TA (accounts payable scaled by total assets) vary from 5% t3 about 15% with a mean of 9%, and the ratios of APAY/TL (scaled by total liabilities) vary frem 12% to 27% with a mean of 19%. Thus, even within the US, trade credit is a significant scurce of financing. By comparison, the mean of short-term debt to assets is 3.4% and the mean of
long-term debt to assets is 16% (scaled by total liabilities the ratios are 7% and 33% respectively).9
The industries with the lowest usage of trade credit are: drugs; leather; pottery; and pulp and paper; and the industries with the highest usage are: spinning (a slight outlier and a relatively
small category); motor vehicles; and petroleum refineries. These patterns fit, at least
anecdotally, with the theories laid out in the previous section. For example, petroleum refineries are raw material intensive, and utilize relatively undifferentiated inputs. At the other extreme, the pharmaceutical industry often makes use of product specific inputs that are difficult to resell. We recognize, however, that it is always possible to come up with post hoc explanations for such patterns in the data. Hence, we prefer to focus on the stability of trade credit ratios across time, by industry, as an indication of the industry specificity of trade credit. If our claim that trade credit is a meaningful and stable industry characteristic is correct, it should to be persistent across time periods.
Table 3 shows correlations of industry-level measures of trade credit use and dependence on external financing across different time periods. Our main variable (APAY) is measured over the 1980's to match the timing of the industry growth data. Indeed, the correlation for APAY between the 1980's and 1990's is 0.83 and between the 1970's and 1980's it is 0 79. By
9 Cunat (2000) reports that US is on the lowx side in the cross-country comparison of trade credit usage, so fior most
comparison, the correlation for the RZ measure of dependence on external financing between the
1970's and 1980's is 0.63 (no data on the 1990's was reported by RZ).10
IV. Results
IV.1. Main results
Our main hypothesis is that industries that are more "dependent" on trade credit will be
relatively better off in countries with less developed institutional finance.
The regression implied by this conjecture is the following:
GROWTH
0j = ai + ±c + P*PRIVc*APAYi + ci(1)
where c denotes country, i denotes industry, and we expect a negative sign on the interaction
term PRIV*APAY. We use industry and country dummies (as and E,) to control for all
unobservable sources of value added growth specific to each country and each industry, and
there is thus no need for PRIV and APAY to enter the regression on their own. The main results
are given in Table 4. Model I reproduces the main result from the RZ paper; they find that
industries that are more dependent on external financing grow more rapidly in countries with
more developed financial markets (a positive coefficient on the interaction term). Throughout the
paper we will use the term RZ interaction to stand for the main interaction used in the RZ study,
which is the product of the industry's dependence on external financing and financial
development (measured as the sum of domestic credit and market capitalization). Model II shows
10 Another interesting observation, also consistent with the idea of industry-specific 'propensity for trade credit', is that in regressions of trade credit intensiveness on firm size, about five times more variation is explained by between industry variation than within industry variation. So, to the extent that size is a predictor of credit access, most of this seems to result from some industries having 'naturally' larger firms, and also being naturally suited to credit access.
our main finding - the negative coefficient on the interaction of the industry-level measure of accounts payable scaled by total assets (APAY) and the country-level measure of (0rivate) financial intermediary development (PRIV)."1 This coefficient is significant at 1% (all errors in this paper are adjusted for heteroskedasticity), consistent with our main hypothesis that in lustries that are more dependent on trade credit have a relative advantage in countries with less developed financial intermediaries. The magnitude of the effect of our main interaction en value added growth may be thought of in the following terms: consider a move from the country at the 75th percentile of private financial intermediary development (e.g., Korea) to the country at the 25th percentile (e.g., Egypt). According to our calculations, this will widen the gap in growth rates between the industries at the 25th (Printing and Publishing) and 75th (Plastics) percentiles of trade credit intensity by 1.3 percent. This difference in differences is virtually identical to the effect of the RZ interaction. As noted in RZ, this order of magnitude is similar to other explanatory variables used in the growth regressions such as investment's share of GDP and per capita income.
Model III shows that this finding is robust to exclusion of the fraction of industr.'s share in total manufacturing, which is used as a control variable in the rest of the regressions. Model TV shows that including our interaction together with the RZ interaction leaves both measures significant at 1%, suggesting that the trade credit channel provides an effect on growth that is independent of the external financing channel.
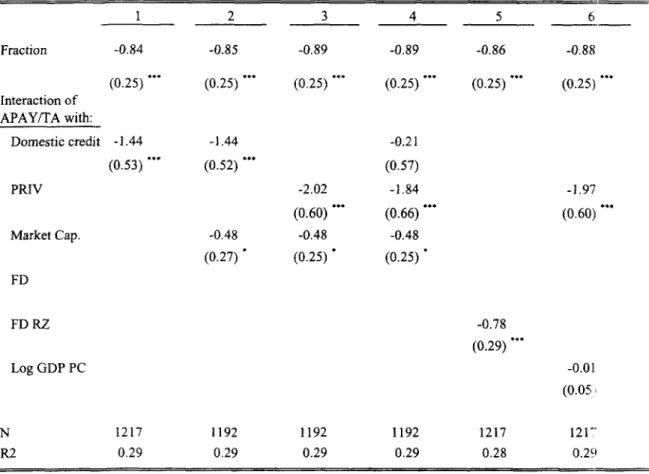
IV.2. Composition of capital markets
In Table 5 we check for the sensitivity of the results to alternative measures of financial
development to explore which of the aspects of financial development are stronger substitutes for
trade credit. Model I uses total domestic credit to GDP, rather than private domestic credit to
GDP as used in our main measure PRIV. The result is still significant at the 1% level, and
comparable in magnitude. Next, we add RZ's measure of market capitalization to see whether
stock market development or financial intermediary development is a stronger substitute for
trade credit. The interaction with market capitalization is significant, but only at the 10% level;
in contrast, measures based on domestic credit or private domestic credit are always significant
at 1%. Moreover, the coefficient on market capitalization is less than a quarter of that of private
credit, and also has a smaller standard deviation. These results are consistent with our hypothesis
that it is financial intermediaries rather than stock markets that primarily act as close substitutes
for trade credit.
A few additional regressions highlight the robustness of our primary findings. When we
include both total domestic credit and private credit in the same regression (Model IV), the
significance of domestic credit disappears. This is effectively capturing the fact that, after
controlling for the presence of private credit, additional domestic credit (i.e., credit to public
organizations) is irrelevant for explaining our results. Finally, we test whether our main result
could be caused by a simple wealth effect, rather than financial institutions' development, by
including APAY interacted with log GDP per capita. Model VI shows that this is not the case:
the interaction of APAY with GDP is not significant, while our main interaction Is still significant at the 1% level.
IV.3. Growth in average firm size versus growth in number of firms.
In Table 6 we decompose growth in value added into growth in the total number of firms in the industry and growth in the average size of individual firms. This addresses the question of whether trade credit is a more important source of growth for new firms (growth in the rumber of firms) or for more mature firms. In the regression with the growth in the number of firms as the dependent variable the main interaction is not significant at conventional levels. By contrast, in the regression with the growth in the average size as the dependent variable, the coefficient on our main interaction is significant at 1% (models III and IV). Furthermore, the RZ interaction is no longer significant at conventional levels if our main interaction is also included (model IV, the RZ interaction is significant at 14% in this model). This is consistent with our hypothesis that for young firms, which have not yet had a chance to establish reputations for credit worthiness, trade credit is a less accessible source of substitute financing than it is for mature firms. Furthermore, for mature firms trade credit financing appears to be a more important determinant
of growth than the dependence on external financing captured by the RZ interaction.1 2
12 RZ also report that in the regression with the number of firms, their effect is estimated more precisely: their
interaction is significant at 5% in the number regression and only 10% in the average size regression. This finding could be interpreted as suggesting that the RZ measure of extemal financing actually picks up the fact that young firms, which are likely to be in rapidly growing industries, are more dependent on extemal financing than firms in mature industries.
IV.4. Robustness
Table 7 explores the robustness of our results to alternative definitions of trade credit
dependence and alternative measures of growth. In models I and II we use APAY/TL (accounts
payable scaled by total liabilities) as a measure of trade credit dependence, and find that this
alternative definition does not affect our results. Models III and IV use APAY/TA measured over
the 1970's; the result is slightly less significant - only at 4%, similarly, the RZ interaction is
significant only at 4% when measured over the 1970's (this could be accounted for by
attenuation bias due to lower quality data). Model V uses APAY/TA measured over the 1990's
and finds it to be significant at 1%. Thus, our main result is not sensitive to a different scaling
factor or different time horizons.
Next, we address the question of reverse causality in financial development. The
argument here is that if the country's economy contains more industries that rely more on trade
credit, there will be less need for formal intermediaries to develop. This is a weak argument,
since first, the presence of trade credit still leaves a lot of room for formal credit markets to
develop. Second, trade credit seems to be a second best option, as firms that have access to bank
credit prefer it to the use of trade credit (see Petersen and Rajan (1997)). Nevertheless, following
RZ, we run our main regression using instrumental variables with legal origin dummies as
instruments for financial development. In model VI we find that our main result is still
significant, although now only at 6% level. Finally, we use accounting standards as a proxy for
financial intermediary development and still find a negative relationship (model VII). This could
be interpreted as evidence in support of information-based theories of trade credit advantages,
since with poor accounting standards, less information is available for financial intermediaries,
thereby tilting the balance in favor of supplier financing. However, this result is somewhat weaker than our other results: the significance is only 10%, though this is partially a reflection of the decline in sample size (about 20%).
Finally, in Table 8 we make sure that our results are not driven by a small number of influential observations. The distribution of the main dependent variable, the growth in real value
added, has very long tails: while the 10th and 90th percentiles of growth are -5% and +12%
respectively (with mean and median of about 3%) the extreme observations go as far as -50% to +100% (observations above 100% were replaced with missing by RZ). All regressions in Table 8 (except model IV) exclude the 1% of observations on each side of the distribution for growth in value added (in effect all observations below -30% and above +27% are excluded). This exclusion does not affect significance of our main interaction, which is still significant at 1%. However, the RZ interaction is more sensitive to influential observations and its significance drops to 5% in the regression by itself (model I) and 10% if APAY is added (model III). The magnitude of the effect on the growth in value added drops from about 1% to 0.52% for our main interaction and 0.38% for the RZ interaction. However, the explanatory power rises to 0.36 from 0.3 suggesting that these outlying observations created considerable noise in the original estimates. Finally, model IV excludes industry with ISIC code 3211 (Spinning), which appears to be an outlier on the APAY/TA measure and model V excludes 1% outliers and Spinning. The
significance of our main result is not affected by these exclusions.'3
13In additional results, not reported, we explored the sensitivity to exclusion of specific countries. For example, we excluded two countries with the highest level of PRIV (Singapore and Japan), and the main interaction was s-ill
V. Conclusions
In this paper, we have shown that firms in countries with less developed financial
markets appear to substitute informal credit provided by their suppliers to finance growth. Using
the methodology pioneered by Rajan and Zingales (1998), we find that industries that are more
dependent on trade credit financing grow relatively more rapidly in countries with less developed
financial intermediaries. The result is robust to the addition of various industry-level measures,
alternative financial development measures, and exclusion of influential observations. We also
find that trade credit usage affects growth in the average size of firms rather than the growth in
the number of firms. This is consistent with 'reputation-based' theories of trade credit, which
argue that new firms will have greater difficulties in obtaining trade credit.
This paper uncovers an important and significant role for trade credit as a source of firm
financing and growth, thus calling into question claims that trade credit exists only to reduce
transaction costs. This certainly does not detract from the importance of financial development
as an engine of growth: as we have emphasized, our argument is driven by the assumption that
firms view trade credit as a second-best alternative to bank financing. Furthermore, our results
on new firm growth imply that, in some sense, trade credit is less 'democratic' than bank
financing in promoting growth, which may raise concerns about fostering industry competition
and may also have distributional implications. Still, our work highlights the fact that in the face
of adverse circumstances, firms are effective in finding substitutes to poorly developed
institutions. The substitution of trade credit for formal bank financing is just one example, and
we leave similar analyses along other dimensions as possibilities for future work.
References
Bekaert G., C. Harvey, and C. Lundblad, 2000, "Emerging Equity Markets and Economic Development," NBER working paper 7763.
Biais, Bruno and Christian Gollier, "Trade Credit and Credit Rationing" Review of Fin;mcial Studies; 10(4), Winter 1997, pp. 903-37.
Brennan, Michael J., Vojislav Maksimovic and Josef Zezhner, "Vendor Financing" Journal of
Finance 43(5), December 1988, pp.1 1 2 7-4 1
Cameron, R. et al. "Banking in the Early Stages of Industrialization: A study in Comparative Economic History," New York: Oxford U. Press, 1967.
Cunat, Vicente, "Inter-Firm Credit and Industrial Links," Mimeo, London School of Economics, 2000.
Demirguc-Kunt, A., and R. Levine, "Stock Market Development and Financial Intermedi.aries: Stylized Facts," World Bank Economic Review, 1996 (10), pp.291-321.
Demirguc-Kunt, A., and V. Maksimovic, "Law, Finance and Firm growth," Journal of Finance, 1998, (53).
Emery, Gary, and Nandkumar Nayar, "Product Quality and Payment Policy," Review of Quantitative Finance and Accounting, 1998 (10), pp. 269-84.
Ferris, J. S., "A Transactions Theory of Trade Credit Use, " Quurterly Journal of Economic i, 1998 (94), pp. 243-270.
Frank, Murray and Vojislav Maksimovic, "Trade Credit, Collateral and Adverse Selection," Mimeo, 1998.
King, R.G., and R. Levine, "Finance and Growth: Schumpeter Might be Right," Quarterly Journal of Economics, 1993 108(3), pp. 717-37.
Lee, Yul W., and John D. Stowe, "Product Risk, Asymmetric Information, and Trade Credit," Journal of Financial and Quantitative Analysis 28, 1993, pp. 285-300.
Long, Michael, Ileen Malitz and Abraham Ravid, "Trade Credit, Quality Guarantees, and
Product Marketability," Financial Management, 1993 (22), pp.117-127.
Love, Inessa, "Financial Development and Financing Constraints: International Evidence from the Structural Investment Model", Mimeograph, Columbia University, 1999.
McMillan, John, and Christopher Woodruff. "Interfirm Relationshipss and Informal Credit in Vietnam." Quarterly Journal of Economics, 114(4), November 1999, pp. 1285-1320.
Mian, Shehzad L., and Clifford Smith, "Accounts Receivable Management Policy: Theory and
Evidence," Journal of Finance, 47(1), March 1992, pp.1 6 9-2 0 0.
Ng, Chee K., and Janet Kiholm Smith and Richard Smith, "Evidence on the Determinants of
Credit Terms Used in Interfirm Trade," Journal of Finance 54(3) June 1999, pp. 1 1 0 9-1 2 9.
Nilsen, Jeffrey, "Trade Credit and the Bank Lending Channel," mimeo 1999.
Petersen, Mitchell and Raghuram Rajan, "Trade Credit: Theories and Evidence," Review of
Financial Studies, Fall 1997, 10(3) pp.6 6 1-6 9 1.
Pryor, Frederic L., "An International Comparison of Concentration Ratios," Review of Economics and Statistics, 54(2), May 1972, pages 130-40.
Rajan, R., and L. Zingales, 1998, "Financial Dependence and Growth," American Economic Review, 88(3), pp. 559-86.
Rousseau, P. and P. Wachtel, "Financial Intermediation and Economic Performance: Historical Evidence from Five Industrialized Countries," Journal of Money Credit and Banking 30(4), November 1998 pp. 657-78.
Smith, Janet Kiholm, "Trade Credit and Informational Assymetry," Journal of Finance, 42(4), September 1987, pp. 863-72.
Table 1. List of variable abbreviations, definitions and sources.
Abbreviation Description
I. Variables from Rajan and Zingales:
1) Industry-level variables, original source ComDustat:
EXTFIN Dependence on external financing, industry-level median of the ratio of capital ependitures minus cash flow over capital expenditures (the numerator and denominator are summed over all years for each firm
before dividing). This variable measures the portion of capital expenditures not financed by internally generated cash. Cash flow is defined as the sum of funds from operations, decreases in inve!ntories, decreases in receivables, and increases in payables. This variable is measured over 1980-1989 includes all firms, EXTFIN 70's is measured over 1970-1980.
2) Country-Industry level variables, original source United Nations Statistics:
Industry growh Main measure is growh in value added; it is annual compounded growth rate in real value acded estimated for the period 1980-1990 for each ISIC industry in each country. Growth in number equals to the diference in the log of ending period firm number less the log of firm number in the begirning of
period. Growth in average size equals the difference in logs of the average size, which is defined as total value added in the industry divided over the number of frms in the industry.
Fraction Fraction of the industry's value added in total manufacturing value added for 1980.
3) Country-level variables:
Domestic Ratio of domestic credit held by monetary authorities and depositary institutions (excluding interbank credit deposits) scaled by GDP for 1980. Original source is International Financial Statistics (IFS).
Private credit Ratio of private domestic credit held by monetary authorities and depositary institutions (excluding interbank deposit) scaled by GDP for 1980. Original source is International Financial Statist cs (IFS). Market cap. Ratio of stock market capitalization to GDP in 1980. IFS.
Log GDP PC Log of GDP per capita in US dollars in 1980. IFS
Legal origin Dummies for English, French, German or Scandinavian origin of the legal system. La Porta et al. (1996) Accounting Amount of disclosure of companies's annual reports in each countries. La Porta et al.(1996'
Standards
11. Additional variables constructed from Compustat:
APAY, Accounts payable scaled by total assets, industry medians of frim-level measures. Main variable is APAY/TA measured over 1980-1989, additional variables are measured over 1970-1979 and 1990-1938. APAY/TL Accounts payable scaled by total liabilities, industry medians of frim-level measures over 1'980-1989. S/K Sales scaled by capital (ppent - property plant and equipment net of depreciation)
Table 2. Trade credit use by industry
Median levels of Accounts Payable by industry, APAY/TA is scaled by total assets APAY/TL is scaled by total liabilities. Sources Compustat and CRSP for industry codes.
ISIC code Description APAY/TA 1980's APAY/TA 1990's APAY/TL 1980's
311 Food products 11.4% 8.7% 21.2% 313 Beverages 9.1% 6.4% 17.4% 314 Tobacco 6.8% 4.8% 12.6% 321 Textile 10.1% 7.6% 22.4% 3211 Spinning 14.9% 15.1% 29.3% 322 Apparel 11.2% 11.5% 24.6% 323 Leather 5.8% 7.9% 14.3% 324 Footwear 9.3% 7.4% 23.4% 331 Wood Products 8.9% 6.5% 17.8% 332 Furniture 9.2% 8.3% 20.6%
341 Paper and Products 8.2% 7.1% 17.7%
3411 Pulp, paper 6.4% 5.8% 13.2%
342 Printing and Publishing 7.6% 7.1% 16.1%
3511 Basic chemicals excl. Fertil. 8.3% 7.1% 17.2%
3513 Synthetic resins 8.8% 8.4% 18.0%
352 Other Chemicals 9.9% 9.0% 22.1%
3522 Drugs 5.6% 5.0% 15.9%
353 Petroleum refineries 11.8% 10.2% 21.3%
354 Petroleum and coal products 9.5% 8.9% 21.5%
355 Rubber products 9.0% 8.0% 20.0%
356 Plastic products 9.9% 10.2% 20.1%
361 Pottery 6.7% 5.7% 15.3%
362 Glass 9.3% 8.9% 17.9%
369 Non metal products 6.5% 6.8% 14.2%
371 Iron and Steel 9.5% 9.9% 18.0%
372 Non-ferrous metal 7.9% 7.3% 18.3% 381 Metal products 8.7% 8.7% 19.1% 382 Machinery 8.7% 9.1% 18.4% 3825 Office, computing 8.5% 9.5% 22.6% 383 Electric machinery 8.3% 9.3% 19.4% 3832 Radio 7.7% 7.9% 19.3% 384 Transportation equipment 10.6% 9.9% 21.1% 3841 Ship 10.2% 8.1% 17.8% 3843 Motor veichle 11.5% 11.5% 21.4% 385 Professional goods 7.2% 6.5% 18.0% 390 Other ind. 8.9% 8.4% 19.3% Mean 8.9% 8.3% 19.1% Median 8.9% 8.2% 18.7% Standard deviation 1.9% 2.0% 3.3%
Table 3. Correlations of industry-level measures.
Correlations of industry-level medians. See Table 1 for variable definition and sources. If not specified implicitly, the variable is measured over 1980's. All correlations are based on 36 observations, except EXTFIN measured over 70's
which has only 35 observations. P-values are in parenthesis (0 stands for lower then 0.01), * dentotes significance at 5%.
APAY/TA 70's APAY/TA 80's APAY/TA 90's APAY/TL EXTFIN EXTFIN 70's APAY/TA 80's 0.79* (0) APAY/TA 90's 0.64* 0.83* (0) (0) APAY/TL 0.71* 0.84* 0.78* (0) (0) (0) EXTFIN 0.11 -0.13 -0.01 0.07 (0.51) (0.46) (0.93) (0.66) EXTFIN 70's 0.09 0.02 0.15 0.08 0.63* (0.59) (0.89) (0.37) (0.62) (0) S/K 0.20 0.04 0.15 0.28 -0.16 -0.06 (0.25) (0.79) (0.37) (0.09) (0.34) (0.71)
Table 4. Accounts Payable and Industry Growth
Dependent variable is real growth in value added. Fraction is fraction of industry Value Added in total manufacturing in 1980, RZ Interaciton is interaction of industry's dependence on external financing with Financial development, PRIV is Financial Intermediary development in 1980 (the ratio of total credit held by private (non-governmental) organizations to GDP) , APAY/TA is industry's dependence on trade credit measured by Accounts Payable over Total assets. All variables are from RZ except for APAY/TA which is from Compustat 1980-1989. All models include country and industry dummes. Standard errors appear in parentheses, and are adjusted for heteroskedasticity. Significance levels *'", ** and * correspond to 1%, 5% and 10% respectively.
1 2 3 4
Fraction -0.91 -0.88 -0.95
(0.246) (0.247) (0.248)
RZ Interaction 0.069 0.064
(0.023) (0.022)
Interaction APAY/TA and
PRIV -2.01 -1.64 -1.79 (0.597) (0.604) (0.568)
N 1217 1217 1217 1217
Table 5. Composition of Capital Markets and GDP
Dependent variable is real growth in value added. Fraction is fraction of industry Value Added in total manufacturing in 1980, APAY/TA is industry's dependence on trade credit measured by
Accounts Payable over Total assets. Domestic credit is the ratio of total credit to GDP in 1980; PRIV is Financial Intermediary development in 1980 (the ratio of total credit held by private (non-governmental) organizations to GDP); Market cap is the ratio of stock market capitalization to GDP in 1980; FD RZ is the financial development measure used by RZ (the sum of domest:.c credit and market capitalization). All variables are from RZ except for APAY/TA which is fTrom Compustat 1980-1989. All models include country and industry dummes. Standard errors appear
in parentheses, and are adjusted for heteroskedasticity. Significance levels ***, ** and *
correspond to 1%, 5% and 10% respectively.
1 2 3 4 5 6i Fraction -0.84 -0.85 -0.89 -0.89 -0.86 -0.88 (0.25) (0.25) (0.25) (0.25) (0.25) . (0.25) Interaction of APAY/TA with: Domestic credit -1.44 -1.44 -0.21 (0.53) (0.52) (0.57) PRIV -2.02 -1.84 -1.97 (0.60) (0.66) (0.60) .. Market Cap. -0.48 -0.48 -0.48 (0.27) (0.25) (0.25) FD FD RZ -0.78 (0.29) Log GDP PC -0.01 (0.05;1 N 1217 1192 1192 1192 1217 121' R2 0.29 0.29 0.29 0.29 0.28 0.29
Table 6. Growth in Number and Size
Dependent variable is growth in number of establishments in models 1 and 2 and growth in average size
of establishments in models 3 and 4. Fraction is fraction of industry Value Added in total manufacturing in
1980, APAY/TA is industry's dependence on trade credit measured by Accounts Payable over Total
assets. PRIV is Financial Intermediary development in 1980 (ratio of total credit held by private
(non-govermmental) organizations to GDP ) RZ Interaction is interaciton of industry's dependence on external
financing with Financial development. All models include country and industry dummes. Standard errors
appear in parentheses, and are adjusted for heteroskedasticity. Significance levels ***, ** and * correspond
to 1%, 5% and 10% respectively.
Growth in Number of Growth in Average Size of
Dependent Variable: Establishments Establishments
1 2 3 4
Fraction -0.19 -0.23 -0.77 -0.81
(0.140) (0.150) (0.330) (0.330)
Interaction of
APAY/TA and PRIV -0.47 -0.41 -1.97 -1.92
(0.380) (0.370) (0.580) (0.580)
RZ interaction 0.028 0.026
(0.012) (0.018)
N 1073 1073 1047 1047
Table 7. Robustness I - Alternative Measures
Dependent variable is real growth in value added. Fraction is fraction of industry Value Added in total manufacturing in 1980, RZ Interaciton is interaciton of industry's dependence on extemal
financing with Financial development, PRIV is Financial Intermediary development in 1980 (ratio c,f total credit held by private (non-governmental) organizations to GDP). Models 1 and 21 use
APAY/TL (accounts payable scaled by total liabilities) measured over 1980's; models 3 and 4 use APAY/TA (accounts payable scaled by total assets) and RZ interaction measured over 1970's; modJel
5 uses APAY/TA measured over 1990's; model 6 is estimated by instrumental variables with legal origin used as instruments for PRIV -financial intermediary development. Model 7 is interaction of APAY/TA with accounting standards. All models include country and industry dummnes. Standard errors appear in parentheses, and are adjusted for heteroskedasticity. Significance levels ***, ** anc *
correspond to 1%, 5% and 10% respectively.
1 2 3 4 Fraction -0.86 -0.94 -0.84 -0.90 (0.25) (0.25) (0.25) (0.25) Interaction APAYand PRIV -0.86 -0.89 -1.31 -1.49 (0.30) (0.30) (0.48) (0.50) RZ interaction 0.07 0.12 (0.02) (0.05) N 1217 1217 1217 1179 R2 0.29 0.3 0.28 0.28 5 6 7 Fraction -0.83 -0.85 -0.61 (0.24) (0.25) (0.21) Interaction APAYand PRIV -1.53 -0.94 -0.013 (0.58) (0.54) (0.01) RZ interaction N 1217 1207 1067 R2 0.29 0.29 0.34
Table 8. Robustness II -Excluding Outliers
Dependent variable is real growth in value added. Fraction is fraction of industry Value Added in total manufacturing in 1980, RZ Interaciton is interaciton of industry's dependence on external financing with Financial development, PRIV is Financial Intermediary development in 1980 (ratio of total credit held by private (non-governmental) organizations to GDP), APAY/TA is industry's dependence on trade credit measured by Accounts Payable over Total assets. All variables are from RZ except for APAY/TA which is from Compustat 1980-1989. Models 1-3 exclude 1 % of
obseravtions on each side for the dependent variable, model 4 excludes industry 3211 (Spinning), and model 5 excludes industry 3211 in addition to 1% outlier on each side. All models include country and industry dummes. Standard errors appear in parentheses, and are adjusted for heteroskedasticity. Significance levels ***, ** and * correspond to 1%, 5% and 10% respectively.
.1 2 3 4 5
Fraction -0.43 -0.43 -0.46 -0.92 -0.43
(0.11) (0.11) (0.11) (0.27) (0.12)
Interaction of
APAY/TA and PRIV -0.86 -1.22 -2.19 -1.36
(0.26) (0.40) (0.77) (0.51)
RZ Interaction 0.029 0.025
(0.013) (0.013)
N 1202 1202 1202 1187 1172
Policy Research Working Paper Series
Contact Title Author Date for paper
WPS2681 On the Duration of Civil War Paul Collier September 2001 P. Collier
Anke Hoeffler 88208
MAns Soderbom
WPS2682 Deposit Insurance and Financial Robert Cull September 2001 K. Labrie
Development Lemma W. Senbet 31001
Marco Sorge
WPS2683 Financial Policies and the Prevention Frederic S. Mishkin October 2001 R. Vo
of Financial Crises in Emerging 33722
Market Economies
WPS2684 From Monetary Targeting to Inflation Frederic S. Mishkin October 2001 R. Vo
Targeting: Lessons from Industrialized 33722
Countries
WPS2685 Monetary Policy Strategies for Frederic S. Mishkin October 2001 R. Vo
Latin America Miguel A. Savastano 33722
WPS2686 Education, Earnings, and Inequality Andreas Blom October 2001 S. Benbouzid in Brazil, 1982-98: Implications for Lauritz Holm-Nielsen 88469
Education Policy Dorte Verner
WPS2687 Geographic Patterns of Land Use Kenneth M. Chomitz October 2001 S. Hendrickson and Land Intensity in the Brazilian Timothy S. Thomas 37118
Amazon
WPS2688 Aid, Shocks, and Growth Paul Collier October 2001 A. Kitson-Walters
Jan Dehn 33712
WPS2689 Global Trade and Food Safety: John S. Wilson October 2001 L. Tabada
Winners and Losers in a Fragmented Tsunehiro Otsuki 36896
System
WPS2690 Ringing in the 20th Century: Scot Wallsten October 2001 P. Sintim-Aboagye
The Effects of State Monopolies, 37644
Private Ownership,and Operating Licenses on Telecommunications in Europe, 1892-1914
WPS2691 Evolution of Earnings and Rates of Gladys L6pez-Acevedo October 2001 M. Geller
Returns to Education in Mexico 85155
WPS2692 Introduction to Property Theory: David Ellerman October 2001 B. Mekuria
Policy Research Working Paper Series
Con'tact
Title Author Date for paper
WPS2693 Helping People Help Themselves: David Ellerman October 2001 B. Mlekuria
Toward a Theory of Autonomy- 82756
Compatible Help
WPS2694 Financial Development and Financing Inessa Love October 2001 K. Iabrie
Constraints: International Evidence 310C)1