The Valuation Effect of Listing Requirements: An Analysis of Venture Capital-Backed IPOs
36
0
0
Full text
(2) CIRANO Le CIRANO est un organisme sans but lucratif constitué en vertu de la Loi des compagnies du Québec. Le financement de son infrastructure et de ses activités de recherche provient des cotisations de ses organisations-membres, d’une subvention d’infrastructure du Ministère du Développement économique et régional et de la Recherche, de même que des subventions et mandats obtenus par ses équipes de recherche. CIRANO is a private non-profit organization incorporated under the Québec Companies Act. Its infrastructure and research activities are funded through fees paid by member organizations, an infrastructure grant from the Ministère du Développement économique et régional et de la Recherche, and grants and research mandates obtained by its research teams. Les partenaires du CIRANO Partenaire majeur Ministère du Développement économique, de l’Innovation et de l’Exportation Partenaires corporatifs Banque de développement du Canada Banque du Canada Banque Laurentienne du Canada Banque Nationale du Canada Banque Royale du Canada Banque Scotia Bell Canada BMO Groupe financier Caisse de dépôt et placement du Québec DMR Fédération des caisses Desjardins du Québec Gaz Métro Hydro-Québec Industrie Canada Investissements PSP Ministère des Finances du Québec Power Corporation du Canada Raymond Chabot Grant Thornton Rio Tinto State Street Global Advisors Transat A.T. Ville de Montréal Partenaires universitaires École Polytechnique de Montréal HEC Montréal McGill University Université Concordia Université de Montréal Université de Sherbrooke Université du Québec Université du Québec à Montréal Université Laval Le CIRANO collabore avec de nombreux centres et chaires de recherche universitaires dont on peut consulter la liste sur son site web. Les cahiers de la série scientifique (CS) visent à rendre accessibles des résultats de recherche effectuée au CIRANO afin de susciter échanges et commentaires. Ces cahiers sont écrits dans le style des publications scientifiques. Les idées et les opinions émises sont sous l’unique responsabilité des auteurs et ne représentent pas nécessairement les positions du CIRANO ou de ses partenaires. This paper presents research carried out at CIRANO and aims at encouraging discussion and comment. The observations and viewpoints expressed are the sole responsibility of the authors. They do not necessarily represent positions of CIRANO or its partners.. ISSN 1198-8177. Partenaire financier.
(3) The Valuation Effect of Listing Requirements: An Analysis of Venture Capital-Backed IPOs* Cécile Carpentier †, Douglas Cumming ‡, Jean-Marc Suret§. Résumé / Abstract Ce papier examine l’impact de la réglementation des valeurs mobilières et des normes minimales d’inscription en bourse sur la valorisation des premiers appels publics à l’épargne (PAPEs) effectués au Canada et aux États-Unis par des émetteurs financés par des investisseurs en capital de risque. Nous utilisons un échantillon de PAPEs dans chacun des pays sur la période 1986 à 2007. Chaque émission canadienne est pairée avec une émission américaine de taille et de secteur similaires. Nous montrons que les valorisations des émissions canadiennes sont de 48 % à 66 % plus basses que celles des émissions correspondantes américaines, en fonction de l’échantillon retenu et des variables de contrôle. Cette différence subsiste à la prise en compte de plusieurs variables de contrôle, notamment la qualité des émetteurs et des investisseurs en capital de risque, ainsi que la liquidité. Les résultats montrent que les normes réglementaires permissives appliquées aux entreprises émergentes au Canada ont un effet perceptible sur la valeur que leur attribuent les investisseurs. Mots clés : réglementation des valeurs mobilières, normes minimales d’inscription en bourse, valorisation, introduction en bourse. This paper examines the impact of securities regulation and exchange listing standards on the valuation of venture capital-backed IPOs in Canada and the United States. We use a sample of IPOs in both countries matched by size and sector over the 1986-2007 period. The data strongly indicate Canadian IPO valuations are 48% to 66% lower than their matched American counterparts, depending on the matched sample and control variables. We carefully control for several alternative explanations that might account for this difference, including issuer and VC quality, mispricing and liquidity effects. The data highlight the costs associated with low listing standards in Canada. Keywords: Securities Regulation, Listing Standards, Valuation, Initial Public Offerings Codes JEL : G24; G32; G14; G15 *. Cécile Carpentier and Jean-Marc Suret thank the Fonds pour l’éducation et la saine gouvernance de l’Autorité des marchés financiers du Québec and the Social Sciences and Humanities Research Council (SSHRC) of Canada for financial support. The authors are grateful for very valuable research assistance from Nicolas Ros. † Professor, Laval University and CIRANO Fellow, European Center for Corporate Control Studies, Faculty of Administrative Science, Pavilion Palasis-Prince, 2325 de la Terrasse, Laval University, Québec (Québec) Canada G1V 0A6, phone: 418 656 2131 #6385, fax: 418 656 7746, email: Cecile.Carpentier@fsa.ulaval.ca. ‡ Associate Professor and Ontario Research Chair, York University - Schulich School of Business, 4700 Keele Street, Toronto, Ontario M3J 1P3, Canada, phone: 416 736 2100 #77942, fax: 416 736 5687, email: dcumming@schulich.yorku.ca. § Professor, Laval University and CIRANO Fellow, European Center for Corporate Control Studies, Faculty of Administrative Science, Pavilion Palasis-Prince, 2325 de la Terrasse, Laval University, Québec (Québec) Canada, G1V 0A6, phone: 418 656 7134, fax: 418 656 7746, email: Jean-Marc.Suret@fsa.ulaval.ca..
(4) 1. Introduction The principal role of stock exchange listing requirements is to facilitate investing and trading of securities by ensuring a minimum level of firm quality, monitoring and governance. Minimum listing standards are therefore a signal of quality to market participants, which in turn facilitates liquidity by attracting investors to the market (2002 p.1; Harris 2006). Stock exchanges face a trade-off in deciding which firms should be eligible for a listing. On one hand, lower listing standards enables a greater number of companies to meet those standards, thereby increasing the exchange’s listing revenues and associated fees. On the other hand, lower listing standards diminishes an exchange’s reputational capital, reduces monitoring and governance standards, which in turn lowers liquidity insofar as investors are dissuaded from participating in the market. In this paper, we test the role of higher listing standards in facilitating higher valuations of companies at the time of IPO. It is generally assumed that the level of regulation in a stock market influences its cost of capital and the values of the firms listed on the different markets (La Porta et al. 2002; Doidge et al. 2004; Hail and Leuz 2006).1 This paper directly tests this proposition with a new dataset of matched Canadian and US venture capital (VC)-backed IPOs. Prior cross national studies indicate that the quality of securities regulation is similar in the US and in Canada (Hail and Leuz 2006). King and Segal (2007) show that larger2 publicly traded Canadian firms have lower valuations than their US counterparts based on multiples of market-to-book, price-to-last 12-month earnings, Tobin's q, and enterprise value-to-EBITDA, despite exhibiting higher sales growth and profitability. Hail and Leuz (2006) use earning forecasts to estimate the cost of capital, which requires restricting their sample to the largest Canadian companies which offer sufficient coverage by analysts and are typically cross-listed. Hail and Leuz estimate the cost of capital to be only slightly higher in Canada than the US, and as 1. Standard setters frequently refer to the link between accounting information and firms’ cost of capital. For example, Arthur Levitt, the former chairman of the Securities and Exchange Commission (SEC), suggests that “high quality accounting standards … reduce capital costs” (Levitt 1998 p. 81), and this view is supported by academic work (see Lambert et al. 2007) Similarly, Neel Foster, a former member of the Financial Accounting Standards Board (FASB), claims that “More information always equates to less uncertainty, and people pay more for certainty. In the context of financial information, the end result is that better disclosure results in a lower cost of capital” (Foster 2003 p.1). 2 King and Segal reject from their sample companies with sales (or total assets) less than $25 million. The median total asset is $142 million and the median ROA is 3.7%.. 1.
(5) such find that all else being equal the implied valuations of matched Canadian companies is only 3% lower. While Hail and Leuz (2006) and King and Segal (2007) analyze a sample of medium and large firms which are generally profitable, in this paper we study small publicly traded firms, generally unprofitable and at an early stage of development. We expect listing standards and market quality to have a more pronounced impact on smaller firms than medium and large firms with sufficient coverage by analysts due to the more pronounced information asymmetries and large growth opportunities (Doidge et al. 2004). Moreover, the Canadian and US stock markets for larger stocks are generally considered as partially integrated.3 Indeed, very few regulatory dispositions limit cross- boarding investment or listing. However, as foreign investors are generally not aware of newly listed companies and because the floats of these stocks are often too low to attract institutional investors, segmentation can exist between the higher and the lower segments of the markets (Elyasiani et al. 2000). Although securities regulation is similar in Canada and the US, there are strong differences regarding the initial and ongoing listing requirements. The Canadian market is, for the most part, a penny stock market and IPOs firms are particularly small and at a development stage (Carpentier et al. 2009). In this paper we create a matched sample of US and Canadian IPOs based on offer year, industry and size. Our focus on VC-backed IPOs is in part motivated by the fact that non-VCbacked IPOs in Canada are typically too small to be matched with IPOs in the US. By focusing on VC-backed IPOs we obtain as close as possible a suitable matching in the two countries based on size, year and industry. Our focus on VC-backed IPOs is also in part motivated by practitioner concerns, such as that posed by the Canadian Venture Capital Association (Duruflé 2006), that the US offers superior exit opportunities than Canada due to higher IPO valuations. Further, previous studies find evidence that the involvement of VCs influences several characteristics, including the valuation of IPOs (Chemmanur and Loutskina 2006). Accordingly, we control for VC-backing when comparing IPO valuations in Canada and the US. The data examined herein strongly indicate IPO valuations are lower in Canada by 48% to 66%, depending on the matched sample and control variables. In view of the focused market. 3. See Beaulieu et al. (2009) for a review and recent evidence of mild integration between US and Canadian market.. 2.
(6) segment examined, the most plausible explanation for these strong differences in valuations is the substantially lower listing standards in Canada. We note that the valuation gap can also be partially explained by the large difference in liquidity that we observe after the IPOs, but the effect of lower listing standards is robust to controlling for this liquidity effect. Further, note that we control for a variety of other competing explanations for the differences in valuations, and regardless of the controls considered, the differences are best explained by listing standards. This paper is organized as follows. Section 2 review potential alternative explanations for differences in valuations of VC-backed IPOs in Canada and the US. Section 3 introduces the data, matching process and stylized facts. Section 4 presents multivariate regression results. Concluding remarks follow in Section 5. 2. Hypotheses In this section, we review potential alternative explanations for international differences in valuations of VC-backed IPOs in Canada and the US.. These explanations include listing. standards (subsection 2.1), VC reputation (subsection 2.2), the quality of IPO firms and investors (subsection 2.3), investment banker pricing rationality (subsection 2.4), and liquidity (subsection 2.5). 2.1. Listing standards IPOs face strict regulation in the US. The rationale has been that the regulators are gatekeepers whose strict requirements protect investors, enhance market integrity and, in turn, reduce the cost of capital for listed firms. US regulations have become more stringent in recent years. For IPOs, the Penny Stock Reform Act (PSRA) of 1990 placed severe restrictions on IPOs that were priced below $5 (Beatty and Kadiyala 2003). When the SEC revised the Penny Stock Rule in 2005, the SEC required newly listed firms to have a positive net income, a market value of listed securities of $50 million and a minimum bid price of $4 per share.4 Furthermore, the SEC also reinforced the divulgation requirements for stocks not listed on a national market. On January 4, 1999, the SEC approved the ‘‘eligibility rule’’, which required all domestic over the counter bulletin board (OTCBB) firms to comply with the reporting obligations under the 1934 4. See: http://www.sec.gov/rules/final/34-51983.pdf. See also Klein and Mohanram (2006). Other papers that evocate the regulation of IPOs in the US include Cox (2000) on reforming securities regulation and Cohn (1999) on the impact of securities law on small business.. 3.
(7) Act (Bushee and Leuz 2005). The rationale underlying these recent US regulatory reforms has been challenged by the recent surge of less regulated markets, such as the AIM in London. The AIM has challenged the dominant situation of the US stock market. Healy and Palepu (2001 p.431) argue that the comparative rise of the AIM subsequent to these US regulatory changes make further work on disclosure and capital market research worthwhile to assess the effect of regulation on capital market development. Listing requirements do differ across Canada and the US (Harris, 2006). Unlike their counterparts in the US, Canadian regulators and exchanges have set minimal listing requirements so low that almost any firm can list via an IPO, even without revenues or earnings. One of the main Canadian stock markets, the TSX Venture (TSXV), describes itself as a “public venture market”. New firms can list with no revenues, the stock price should be higher than CAN$0.15, and the minimal net tangible assets, including the IPO proceeds, has been set at CAN$500,000 or $750,000 depending on the period.5 More than half of Canadian IPOs comprise firms without revenues, which creates a situation in which there is very pronounced asymmetric information, risk and uncertainty faced by purchasers of newly listed firms. Moreover, because the IPO process is costly, and particularly costly relative to the capital raised for smaller firms, regulators have permitted access to the market via “backdoor listings”,6 including RMs and Capital Pool Companies (CPCs).7 The lax security regulatory regime prevailing in Canada allows firms to choose to list via a RMs or an IPOs. The result of these low regulatory requirements is a market where most of the Canadian listed firms can be considered as micro or small stocks firm. Carpentier et al. (2009) report that 3,857 companies were listed on the TSXV from 1986 to 2006, which is equal to 60% of the number of IPOs reported in the US during the same period (see also 5. Corresponding values for NASDAQ from June 1999 to June 2001 were US$4 (price), US$4 million for shareholders’ equity, and US$5 million for market capitalization. 6 According to the TSX Manual, a "backdoor listing" occurs when an issuance of securities of a listed issuer results, directly or indirectly, in the acquisition of the listed issuer by an unlisted issuer with an accompanying change in effective control of the listed issuer. A transaction giving rise to a backdoor listing may take one of a number of forms, including an issuance of securities for assets, an amalgamation or a merger. Transactions will normally be regarded as backdoor listings if they could result in the security holders of the listed issuer’s owning less than 50% of the securities or voting power of the resulting issuer, with an accompanying change in effective control of the listed issuer. 7 CPCs are similar to Special Purpose Acquisition Companies (SPAC) in the US, but they involve much smaller amount of money. A CPC is a listed corporation (a shell) with no assets (except cash), no business plan and no operating history, and is solely intended to find and acquire assets or firms as takeover targets. Once the qualifying transaction (QT) is completed, the resulting issuer may be listed for regular trading (Carpentier and Suret 2006).. 4.
(8) Harris, (2006), Cumming and MacIntosh, (2003) and Cumming and Johan, 2009). The entrants are characterized by the following three figures: 49.26% report no revenues, the pre-listing median shareholders’ equity is CAN$260,000, and the median gross proceeds are CAN$650,000. These new listings are new business ventures, which are in fact penny stock IPOs. Their reported sales and assets are considerably lower than those of any junior market, including the London Alternative Investment Market (AIM). Closely related to listing standards is the regulation of subsequent disclosure obligations. Disclosure regulation has been very similar in Canada and the US. The implementation of the Multijurisdictional Disclosure System (MJDS) in 1991, which allows Canadian issuers to meet their U.S. filing requirements using Canadian disclosure documents illustrate the closeness between the disclosure rules in both countries. The only notable difference stays in the implementation of Sarbanes Oxley legislation (June 2002) in the US. As such, in order to assess the effect of international differences in listing standards on IPO valuations, we necessarily control for Sarbanes Oxley. Differences between regulation, including listing standard, can indeed imply differences in cost of equity (Hail and Leuz 2006). Several studies illustrated by Hail and Leuz, use valuation models to compare the cost of equity in several countries. Hail and Leuz evidence that regulation matters internationally, but conclude that the difference between the costs of equity in Canada and the US is very low based on data from large established companies (10.2% in the US versus 10.5% in Canada). Claus and Thomas (2001) evidence a lower cost of capital in Canada, and He and Kryzanowski (2007) conclude that there is no difference in costs of equity after taking into account industry controls. Witmer and Zorn (2007) evidence that the differences that prevailed before 1997 has vanished, thanks to the change in the interest rates in both countries. The overall conclusion is that, for large firms, there is no difference between the costs of capital in both countries. This can be traced to the lack of strong differences between the regulation applied to large Canadian and U.S. companies and to the market integration that prevails at this level. As most of the estimation models rely on financial analysts forecasts, the previous studies focused on the main segments of both markets. A parallel stream of research focused on the comparison of values of similar firms in both countries. King and Segal (2008) conclude that the Canadian and US markets are segmented. 5.
(9) They establish this result by comparing the valuation multiples assigned to the equity of a sample of approximately 600 Canadian firms listed exclusively in the home market with a matched sample of US firms over the period 1989-2004. King and Segal conclude that Canadian firms have lower valuations based on multiples of market-to-book, price-to-last 12-month earnings, Tobin's q, and enterprise value-to-EBITDA. However, their results evidence also a strong effect of the firm’s inclusion in the indexes in both countries. This effect overrides the country effect (Table 3). For example, the coefficient in the model that explains the price to earnings ratio is 2.303 for the country variable, but it is 4.894 for the variable associated with the Canadian index and 7.739 in the case of the variable indicating a firm included in the S&P 500. The valuation effect of the inclusion in the index is generally explained by the increased demand generated from index funds or exchange-traded funds (Morck and Yang 2001). Index funds in Canada generally follow the S&P TSX 60 while, in the US, several funds are indexed on the S&P 500. This implies that the relative weight on the index effect is probably larger in the US sample than in the Canadian sample. Our setting, which excludes firms included in the indexes, overcomes this problem. Another stream of research on cost of capital is based on the cross-listing premium (CLP) concept. Companies that cross-list in the US benefit from a CLP: their value is higher than the value of similar companies that are not cross-listed. This premium exists for companies from all countries, and is not specific to Canada. On average, the CLP is estimated at between 17% and 22% (according to estimation methods) for a listing on a US exchange (Doidge et al., 2004, p. 31). Several explanations have been proposed to explain this premium, including the bonding proposition: a company that is listed in the US subjects itself to a more stringent regulatory environment as well as to greater scrutiny by the authorities, analysts and institutional investors (Doidge et al., 2004, p. 3). However, the premium can also be linked to better possibilities for financing growth. Doidge et al. (2004) show that growth opportunities are more highly valued for firms that choose to cross-list in the US, particularly those from countries with poorer investor rights. Growth opportunities of these cross-listed firms are likely to be more valuable not only because the firms are better able to take advantage of them, but also because a smaller fraction of firm resources is expropriated by controlling shareholders in firms that find it optimal to list. Recent papers, however, question the bonding explanation for the CLP and offer two alternative propositions. Litvak (2009) observes that the CLP is strongly correlated with US stock 6.
(10) indexes for firms that list on major markets, but not for firms listed on cross-listed firms traded OTC or on PORTAL. Moreover, the CLP exists only in firms with above-median ratio of US to total trading volume, and declines significantly for firms with a low volume of trading. Litvak concludes that these results weaken the law-based explanation for cross-listing premia (bonding to U.S. securities regime) and strengthen liquidity and visibility explanations. Litvak suggests a behavioral explanation that is important in our setting: US investors treat high trading volume, exchange traded firms partly like US firms, but treat OTC firm, PORTAL firms and low-tradingvolume exchange-traded firms like other foreign firms. Sarkissian and Schill (2008) observe that cross-listing “waves”, that occur in markets when the market does relatively well, are consistent with the recent literature. They find little evidence that overseas listing is associated with any appreciable increase in the long-term valuation ratio of listing firms. They suggest that these short-term valuation gains surrounding cross-listing provide the impetus for listing overseas. In the same vein, Abdallah and Ioannidis (2009) evidence that before firms cross-list they exhibit strong performance in their domestic market, but after cross-listing their performance declines. King and Segal (2008) find that cross-listed firms in the US with a single class of shares enjoy a permanent increase in valuation if they attract and maintain investor recognition over time. Valuations of firms that fail to widen their US shareholder base return to pre-listing levels within two years. Cross-listed firms with dual-class shares exhibit a permanent increase in valuation regardless of the level of US investor holdings, consistent with firm-level bonding. This seems to indicate that a US listing can increase the values of some categories of stocks. King and Segal (2008) and related studies, however, do not consider small companies which generally do not cross-list in the US. In our analyses, by contrast, we focus on substantially smaller stocks. In sum, for large firms the extant evidence is such that there are comparatively small differences in the cost of capital due to Canada’s regulatory structure.. For smaller firms,. however, there is no prior evidence. The hypothesis that low listing requirements is linked with lower valuation for smaller stocks is central to our empirical tests.. However, several. complementary or alternative explanations are examined below. 2.2. Venture capital reputation In addition to the effect of low listing standards and the fragmented regulatory structure in Canada, it is possible that the quality of VCs is lower in Canada, which could in turn explain the 7.
(11) differences in valuations of VC-backed IPOs.. According Baker and Gompers (2003) and. Suchard (2009), VC-backed firms have larger and more independent boards, and their monitoring shareholders own a higher percentage of the firm. Further, VC-backed firms have governance structures with higher levels of monitoring at the time of the IPO and four years following the offering. Accordingly, in our comparison of VC-backed IPO valuations we consider the quality of the VC. Chemmanur and Loutskina (2006) distinguish between three possible roles of venture backing in IPOs: certification, where venture-backed IPOs are priced closer to intrinsic firm value than non-venture backed IPOs due to venture capitalists' (VCs) concern for their reputation; screening and monitoring, where VCs are able to either select better quality firms to back (screening), or help create such higher quality firms by adding value to them (monitoring) in the pre-IPO stage; and market power, where VCs attract a greater number and higher quality of market participants such as underwriters, institutional investors, and analysts to an IPO, thus obtaining a higher valuation for the IPOs of firms backed by them. They compare four sets of more direct measures between VC-backed and non-VC backed (and between high-reputation VC backed and low-reputation VC-backed) IPOs. The evidence strongly rejects the certification hypothesis, while finding considerable support for the market power hypothesis and some support for the screening and monitoring hypothesis. They conclude that VCs attract higher quality market participants to the IPOs of firms backed by them, thus increasing the heterogeneity in investor beliefs about these firms, resulting in higher valuations for the equity of these firms (both in the IPO and in the secondary market immediately following the IPO). The notion of the quality of VC is potentially important in our context, as in related work (Manigart et al. 2002; Nahata 2008). Prior work is consistent with the view that Canadian VCs are of lower quality than US VCs (Cumming and MacIntosh, 2003; Cumming and Johan, 2009). VC quality can be associated with the governmental implication. According Brander et al. (2008) Canadian enterprises financed by government-sponsored VC underperform on a variety of criteria. Brander et al.’s results indicate that government-sponsored VCs provide less effective mentoring and other value-added skills. As such effect can influence the IPO pricing, we include controls for VC quality, in our regression analyses.. 8.
(12) In addition to differences in the quality of VCs, there may be differences in growth opportunities for VC-backed companies in Canada and the US, as well as differences in the quality of companies that are started in Canada versus the US. These propositions are discussed further below and accounted for in our multivariate empirical tests in section 4. 2.3. Better quality of issuers We cannot rule out the possibility that in the US, the VC-backed IPOs firms are of better quality than their Canadian counterparts. They can have, for example, more R&D projects of better quality, better management teams or larger opportunity to implement strategic alliances. This kind of advantage cannot be captured by the firm characteristics available at the IPO. However, they can be appreciated by investment bankers and investors. In such a context, higher prices in a country can simply reflect higher growth expectations. 2.4. Irrational pricing An extensive literature address the pricing and underpricing of IPOs (Ljungqvist 2007). Behavioral explanations and irrational pricing, either by investment bankers and/or by the market, need to be considered. As we are comparing two sets of issues in two different countries, we acknowledge that differences in prices might be linked to differences in the investment bankers’ or investors’ rationality. 2.5. Liquidity A final explanation of for the higher IPO valuations in the US is liquidity. Investors price liquidity (Litvak 2009). There is substantial evidence of a significant liquidity premium that is robust to the CAPM and the Fama-French three-factor model, and shows that liquidity is an important source of priced risk (Liu 2006). To determine in what extent the liquidity can explain most or the totality of the observed differences between the valuation of Canadian and US VB IPOs, in section 4 we run a valuation model with a liquidity variable on different subsamples, defined by the gap between the US versus Canadian rotation. In sum, given the pronounced differences in listing standards, it is plausible for Canadian IPOs to be valued substantially lower than their US counterparts. An alternative hypothesis is that valuation differences are attributable to a liquidity effect. Further we control for differences in. 9.
(13) VC quality, and the quality and growth opportunities of firms backed by VCs. We test these propositions in section 4 below with the new detailed dataset introduced in section 3. 3. Data sources, matching process and stylized facts 3.1. Sample selection Our sample of matched VC-backed IPOs in Canada and the US spans the years 19862007. Our sample is derived from the list of Canadian IPOs from FPInfomart.ca since 1993 and from the annual list of the Financial Post for the previous years. We excluded privatization of state-owned companies, demutualizations, creation of income trusts and Capital Pool Companies Program IPOs.8 We obtained prospectuses from SEDAR (the Canadian equivalent of EDGAR) since 1997, and those of previous years from the Autorité des Marches financiers du Québec, investment bankers and academic libraries. We supplemented the accounting information with historical records from Thomson’s CanCorp Financials. Because there is no exhaustive list of VC-backed IPO in Canada, we track the issuer with a VC involved in the company before the IPO. We obtained a partial list of VC-backed IPOs from Thomson Financial VC Reporter, a major provider of data on the VC industry. VC Reporter summarizes the deals made by the members of this industry in Canada. We supplemented and verified these data by analyzing the list of large shareholders in prospectuses.9 The frequency of VC-backed IPOs in Canada is relatively low. Cumming and Johan {, 2007 #7159} report that the proportion of VC investment in Canada that exit though an IPO is 5.85%, from 1991 to 2004, compared to a proportion of 35.65% in the US during the same period. In our sample, we identified 197 VC-backed IPOs between 1986 and 2007, and all available data sources and historical records indicates our sample covers 100% of Canadian VC-backed IPOs over this period. We collected the US VC-backed IPOs from SDC Platinum and the prospectus on Edgar. The proportion of Canadian VC-backed firms that list directly in the US is relatively low. The data available on the Thomson VC reporter site indicate that, from the beginning of 1999 to the end of 2008, 20 of the 137 Canadian VC-backed IPOs were listed in the US and two were listed 8 The Capital Pool Program has been implemented in Canada to ease the creation of shells, ultimately used in reverse merger listings by operating companies (Carpentier and Suret 2006). Their IPOs result in the listing of a non-operating company; we consequently exclude CPC IPOs from our sample. 9 We compile a list of VCs operating in Canada from 1986 to 2003 from the lists of the Canadian VC Association, the summary of VC lists of Industry Canada (Strategis) and the lists of the equity sources provided by Mike Volker at http://www.sfu.ca/~mvolker/biz/moneylnk.htm. 10.
(14) simultaneously in Canada and the US. We keep these two cross-listed IPOs in our Canadian sample; regardless, treatment of these two cross-listed IPOs has no material influence on our results. IPOs of Canadian firms listed in the US are excluded from the sample.10 3.2. Matching process IPOs in the US in general and VC-backed IPOs in particular are different in Canada and the US. For example, the mean gross proceeds is US$201.57 million in the US (Ritter 2006) and only US$114 million in Canada over the years 2001-2003 (Carpentier and Suret 2008). The comparison of IPOs in Canada and the US requires that we match each Canadian IPO with a comparable IPO in the US. As a consequence of the differences in the distributions of size, it is worth noting that matched US IPOs are smaller than US Canadian VB IPOs in our sample. We match each Canadian VC-backed IPO with a US VC-backed IPO in the same sector, with the closest size possible and in the same period of time using three steps. First, we match each Canadian VC-backed IPO with a US VC-backed IPO occurring during a 12 month window centered on the Canadian IPO date, from the same two digit industry code, and for gross proceeds adjusted for exchange rates do not differ from more than 50%. We get 39 perfect matches in this first step. Second, we relax the gross proceeds criteria only, and match an additional 32 IPOs. Third, we widen the industry criteria and match based on the description of activity provided in the prospectus. In several cases, Canadian IPOs are so small that we cannot find an US equivalent, and we are unable to match the sample without replacement. In a few cases, two or even three Canadian IPOs are matched with the same US VC-backed IPO. Overall, we get a sample of 158 pairs of VC-backed IPOs.11 In order to assess the robustness of the results to the matching process, we also run the tests on the restricted sample of 126 pairs without multiple matches. 3.3. Data sources Accounting and R&D data are directly extracted from the IPO prospectus or prior financial reports when such items were available. If not, we used the financial reports following 10. The number of Canadian firms backed by VC that exit in the US through an IPO is too small to constitute a distinct group. 11 We delete 13 IPOs because we do not find a comparable IPO issuer in the US and another 26 IPOs because we are unable to obtain the gross proceeds of the US comparable issuer.. 11.
(15) the IPO and screened for historical data. EBITDA is not always displayed in financial statements. We compute EBITDA precisely where depreciation is reported (including all Canadian IPOs) and estimate EBITDA for some US IPOs where depreciation is not reported for the relevant period. Estimated depreciation is based on the reported CFO depreciation where available (3 observations), and otherwise we compute a quasi-EBITDA by adding back G&A expenses to operating income. We use the prospectus to identify the investment banks affiliated with each IPO. We determine the lead underwriter, when not explicitly indicated, as the one that sells the largest number of shares. We also determine if the deal was a best effort (BE) or a firm commitment (FC) from the Underwriting section in the prospectus. For example, statements such as “The underwriters are committed to take and to pay for all the shares if any of the shares are taken” were used to classify the IPO as a firm commitment. We use the principal and selling shareholders section of the prospectus and the numbers of shares held before and after the offering to compute the changes in ownership. We record the transactions by the CEO, the Officers and Directors net of the CEO operations, and of the VC. We include in VC ownership all holdings of syndicated investors. We correct for holdings of insiders that also appear under VC holdings in the prospectus to avoid double counting. We report the change in ownership of all the other shareholders that own more than 5% before the IPO and who were not accounted for in any other class of shareholder. Using several sources,12 we documented the fate the IPO firms in our sample from the time of IPO up until June 10, 2009. Some firms are still active and traded, while other are either acquired or merged, renamed, or delisted. We determine if delisting was for substandard performance, or pursuant to a going private transaction. 3.4. Summary statistics Table 1 Panel A reports the main characteristics of the issues for the matched Canadian and US samples. We report in Table 1 the statistics from the matching process without replacement in order to mitigate potential bias in the statistical tests (as discussed, US IPOs are typically not small enough to be matched with Canadian IPOs.) Regardless of the matching 12. These sources include news releases, financial reports and press articles available on Edgar, Sedar, Factiva, FP Infomart and Mergent Online.. 12.
(16) process, gross proceeds are higher for the US sample of VC-backed IPOs. This is particularly evident from the medians. This result is perhaps best attributable to the lower listing requirements in Canada relative to the US. We allowed for a difference of 50% between the gross proceeds in the matching process, but this difference was systematically in favour of the US sample. We report the comparison of gross proceeds by sector. The difference is significant in the technology sector and for other sectors. [Insert Table 1 About Here] Table 1 Panel B presents the main characteristics of the issuers. Canadian issuers are younger than their US counterparts, but the difference is not statistically significant. There are differences in the two samples for shareholders’ equity, total assets, EBITDA and net income. Average EBITDA is negative and average and median income is negative among US VC-backed IPOs. By contrast, average and median EBITDA and income are positive in the Canadian sample. This surprising result can be attributed to the fact that we selected the smallest VCbacked IPOs in the US to be able to match with IPOs in Canada. The differences between both samples are statistically significant. Table 1 Panel B presents ratios. Because several values used in the denominator of the ratios are negative or zero in our sample, we apply the following rules to calculate the ratios: when the shareholders’ equity is negative and the net income positive, we attribute the value of 100% to ROE. When the shareholders’ equity and the net income are both negative, we use 100% for ROE. Return on assets (ROA) and return on equity (ROE) are significantly lower in the US sample, which is attributable to the poor operating performance of small VC-backed IPOs in the US. Net margin is also significantly lower in the US, while the debt to asset ratio is higher, due to the negative values of equity. In short, the US VC-backed IPOs selected for matching purposes report significantly poorer operating performance than Canadian VC-backed IPOs. Table 1 Panel C reports the main multiples. Prices to sales, price to earnings or market to book ratios can take extreme values when the denominator is close to zero, and is undefined when the sales are 0 or when the earnings of book value of equity is negative. As these multiples are often used in the literature related to the IPO valuation, we report their mean and median values. However, we apply the following adjustments to the calculations. The multiples are not estimated when sales are zero (price to sales), or when earnings or book value of equity is 13.
(17) negative (respectively price to earnings and price to book). In order to mitigate the impact of very low denominators, we winsorize the distribution of the multiples at the 95th percentile. Table 1 Panel C shows, for each multiple, that US VC-backed IPOs are priced significantly higher than their Canadian counterparts. This result is extremely surprising in view of the poor operating performance of US VC-backed IPOs. For example, median price to sales is 4.27 in the US and 3.11 in Canada. The median price to earnings is 38.64 in the US and 19.64 in Canada. These differences are significant for median values but not for average values because of the high variance in the distributions. Even if we limit these distributions to their 95th percentiles, we get maximum values in the vicinity of 450%. Note that the characteristics of the distribution give rise to the choice of our empirical models, as explained below in Section 4. Table 2 presents descriptive statistics for the change in ownership at the IPO, post-IPO accounting and market performance, post-IPO liquidity and the survival of the issuer. We present data on the percentage of the pre-IPO firms sold by the CEOs (directors and officers, VCs, and other blockholders). Ownership change is measured as follows: CEO change = % owned by the CEOs after the IPO * (SOA / SOB) - % owned by CEOs before IPO, where SOA = number of Shares Outstanding after the IPO, and SOB = number of Shares Outstanding before the IPO Among IPOs without any shareholder sales, the data reported in Table 2 Panel A indicate US VC-backed IPOs have significantly greater proceeds (mean of US$58.95 million and median of US$48 million) than their Canadian counterparts (mean of US$42.49 million and median of US$25.18 million). Post-IPO ownership retention of pre-IPO shareholders is significantly higher (mean of 73.29%) in the US than in Canada (65.62%). There are no statistically significant differences in the percentage change sold between Canada and the US for any of the types of shareholders, except for other officers and directors. The decrease in shareholdings of other officer and directors is higher in the US (mean of -4.42%) than in Canada (-0.4%). [Insert Table 2 About Here] Quality is difficult to define for firms with most of their value in growth opportunities. (Helwege and Liang 2004 p.543) include the performance in years following the IPO as a 14.
(18) measure of quality. Following F thhis path, and in line withh Zheng and Strangelandd (2007), in Table T mance (incluuding 2 Panel B we use a variable thaat measures growth ratees of accounnting perform earnings and revenu ues) as measures of firrm quality. We compleete the analyysis of operrating performaance by the comparison c o survival raates in both samples. of Seeveral firms report no sales, s negativve earnings and tiny boook value off equity and asset before thhe IPO. Pre-IPO valuess of these variables v cannot be useed to estimaate growth rates. Accordinngly, we use the gross prroceeds to deflate d the chhange in thee performancce indicatorss. We define thee following variables: v Δ REV (P Post-IPO Reevenues Grow wth) = (REV V+3 – REV-1) / GP Δ BE (Poost-IPO Book k Equity Groowth) = (BE E+3 – BE-1) / GP Where Δ BE = 1 in ndicates thatt the growthh in book value of equuity is only explained by b the proceed of o the IPO Δ NE (poost-IPO Net Earning Groowth) = (NE+3 – NE-1) / GP G Where: REV: total revenues BE: bookk value of Eq quity NE: Net earning e Subscriptts refer to the following time line: IPO. Fiscal yeaar end. -1. 0. 1. 2. 3. The subscript -1 indicate the fisccal year preceding the IP PO. 0 is the subscript s of the IPO Yeaar. +3 indicates the third fiscal fi year following fo thee one includding the IPO; When thhe firm has been o acquired, of o if less thaan 3 years arre available since the IP PO, we use thhe last comppleted deleted of fiscal yeaar . Thhe summary y statistics inn Table 2 Paanel B indicaate no signifi ficant differeences betweeen the growths in accountin ng numbers of Canadiann versus US S VC-backedd IPOs. On an ex-post basis, b these twoo samples caan be considdered as com mposed of firrms with equuivalent quaality. Differences in valuatiions at the IPO I cannot be b explainedd by expecteed differences in perform mance, if thhe expost perfo formance is used u as an esstimator of thhe expected performance at the IPO time. Taable 2 Panell E shows that as at Junee 2009 US VC-backed V IP POs are morre likely to sttill be listed (588.73%) than Canadian IP POs (48.41% %). Canadiann VC-backeed IPOs are more m likely to be 15.
(19) acquired or merged with a public firm, privatized or merged with a private firm, or delisted for negative reasons than US VC-backed IPOs. The chi-square test of these differences in proportions is statistically significant. Another possibility is that valuations might be higher in the US because investment bankers and their clients are more optimistic in the US than in Canada. If so, we should observe significant differences in the long-run performance following the IPO. In order to test for the differences, in Table 2 Panel C we define and estimate the following market related variables: Underpricing: the initial return estimated between the IPO price and the closing price of the first month of trading. We use the first month closing price because several IPOs are not traded immediately and some of them are initially traded with low volumes. P36: market price at the end of the 36th month following the IPO RR36: raw return, including the underpricing, estimated using BHAR methodology during the three years following the IPO. We report raw returns because the index we can use in both countries is not the same. AR36: Excess return estimated using BHAR methodology during the three years following the IPO. Small caps index relevant in each country has been used. We use the Russel 2000 – Index in the US and the BMO Nesbitt Burns S/C Composite in Canada. PFP0: P36 / I36 * I0 = market price adjusted for the variation in the index between the issue time and the end of the 36th month. I36, I0: value of the small caps index at month 36 and 0 respectively. This perfect foresight price had been observed on the prospectus given the investment bankers have had a perfect knowledge of the future. This is a proxy for the intrinsic value of the stock at the IPO time. PFP0/P0 is the ratio of the perfect foresight price to the issue price. A ratio lower than 1 indicates that the initial price was set at a too high level. We estimate each variable at the firm level, and report the statistics for the distribution. We do not use a portfolio approach. Essentially, the raw and abnormal returns do not differ significantly, and the median is perhaps more informative in view of the significant outliers. Due to the very low prices at the IPO, particularly for Canadian IPOs, there are a few very high returns and the average is thus highly right-skewed. The median monthly abnormal return is -0.79 in Canada and -0.84 in the US. BHAR can produce unreliable results when there are very large returns; therefore, we cross-check our results by reporting the ratios between the perfect foresight prices (that is, the price that the investors had expected at a three years horizon if he has a perfect foresight capacity and the issue price). The median of the ratio is 0.76 in Canada and 0.66 in the US, but the difference is not statistically significant. Table 2 Panel C further reports statistics for 16.
(20) underpricing, which show some significant differences, but taken alongside the long-run performance it is less plausible that irrational pricing explains valuation differences. Overall, the data indicate that differences in prices observed at the time of IPO cannot be explained by differences in the long-run market performance following the IPO. Therefore, as with the quality of issuers explanation, irrational pricing therefore appears to be an implausible explanation for differences in IPO valuations between Canada and the US. Table 2 Panel D reports three measures of liquidity - the trade volume, the trade amount and the rotation – which are estimated three years after the IPO. As trade amounts and trade volume are affected by the differences in prices between Canadian and US stocks, rotation is perhaps the most informative measure. The three variables indicate a large difference between the two sub samples. The median trade amount is 2.52 in Canada and 17.78 in the US, even if the initial sizes of the IPOs were in the same range. The rotation ratio we observe in the US is three time the equivalent ratio in Canada. Accordingly, we cannot rule out the possibility that the differences in prices we observe can be traced to the expected differences in trading activity and liquidity. We test this possibility below. Table 3 reports a correlation matrix for the restricted sample of matched firms. The correlations indicate valuations are significantly higher for IPOs with higher sales, higher R&D expenses, US IPOs, and IPOs that use a prestigious investment bank. We observe a small negative correlation for lower quality VC-backed IPOs for various proxies of quality. For instance, government VC-backed IPOs are negatively correlated with valuation (-0.14), as are Canadian labour sponsored VCs (-0.06). These latter findings are consistent with extant evidence that government and labour sponsored VCs face statutory restrictions that negatively affect their quality (Cumming and MacIntosh, 2003, Cumming and Johan, 2009). [Insert Table 3 About Here] Overall, the summary statistics and correlations highlight the importance of listing standards and liquidity in explaining international differences in the valuation of VC-backed IPOs, while suggesting less of a role for VC quality, issuer firm quality, and mispricing. We test these explanations further below in a multivariate setting.. 17.
(21) 4. Econometric models and results 4.1. The models The analysis of valuation at the IPO is a challenging task, because numerous firms report negative earnings and, in some cases, no sale and even negative values for shareholders’ equity. Accordingly, neither q ratios (King and Segal 2008) nor multiples (Purnanandam and Swaminathan 2004) can be used and we base our analysis on the model proposed by Aggarwal et al. (2009). In this model the dependent variable is the total offer value defined as offer price multiplied by the post-IPO shares outstanding. The method proposed by Aggarwal et al. allows for catching the cases of negative earnings, a situation that prevails in VC-backed IPOs. These authors use also a valuation based on first-day closing prices. The difference between first-day closing price (market value) and the offer price can be considered as the amount by which the investment bankers underprice the IPO. Some variables, as book value of equity, can take on a negative value. Following Aggarwal et al. (2009) and Hand (2003), we use the Log transformation as follows, for each continuous variable: L(W) = loge (1+W) when W ≥ 0 in $ million; and L(W) = -loge (1-W) when W < 0 in $ million; We consider that the value at the IPO is explained by the three main valuation drivers: revenues, book value of equity and earnings. We use the earning before depreciation and interest (EBITDA) following Purnanandam and Swaminathan (2004). The analysis of the distribution of these values indicates they can have a negative or 0 value. We use the L transformation to keep these observations in the sample. Stock prices are partially determined by growth opportunities, and this is particularly true in the situation of new ventures at the IPO stage. Classical indicators of growth opportunities, like Q ratios or Book-to-market ratio can hardly be introduced in a model explaining the price. We follow Aggarwal et al. (2009) who use R&D expenses as a proxy for growth opportunities. Prior research has shown that ownership retention by Pre-IPOs shareholders has a significant impact on firm value. Consistent with Aggarwal et al. (2009), we measure aggregate post-IPO ownership of pre-IPO shareholders, INSRET, as (shares outstanding after offering primary and secondary shares issued) / shares outstanding after offering. As in Aggarwal et al. 18.
(22) (2009), we study the impact of changes in ownership of different classes of shareholders, including CEOs, the other officers and directors, VCs and other blockholders. Ownership changes are as defined above in subsection 3.4 and presented in Table 2. Large sales of insiders provide a negative signal to the market and thereby lower IPO valuations. The choice of a prestigious broker or auditor has generally been considered a positive signal, characterized by lower underpricing and better long-run performance, associated with a decrease in the asymmetry of information (Carter and Manaster 1990). The probability of survival is higher for issuers that hire a prestigious investment banker, according to Schultz (1993) and Demers and Joos (2007). As the choice of prestigious intermediaries positively influences the probability of success, we can expect a positive association between the enrolment of prestigious intermediaries and the valuation. This result is evidenced by Aggarwal et al. (2009). Following Carter and Manaster (1990), we consider the most active investment bankers in Canada prestigious. During the period under study, seven investment bankers subscribed to 60% of all the initial and seasoned equity issues, and are thus considered prestigious.13 We also consider as prestigious US firms with a score higher than 7 in Carter et al. (1998). We add to this group international investment bankers such as BNP Paribas, Deutsche Bank and UBS, based on the list of the most active investment bankers worldwide provided by Ljungqvist et al. (2003 Table 2, p. 73). In the US, we consider as prestigious each investment banker with a rating higher or equal to 7 in the ranking provided by Loughran and Ritter (2004). The dummy variable PUND is 1 when the investment banker is considered prestigious. PAUDIT = 1 indicates prestigious auditors (“Big 5” or “Big 4”). We observe that a proportion of 98% of VC-backed IPOs are audited by a prestigious auditor, in each country. For this reason, the dummy associated with the prestige of auditor is not included in the model. Litvak (2009) evidence that the pair premia, (that is, the value of cross-listed firms in the US relative to their comparable domestic firms) is strongly correlated with US stock indices and peaks during the bubble in early 2000. We control for the bubble period in one of the model. We considered various other variables but found them to be immaterial for our analysis. Note that we do not include variables for gross proceeds (a proxy for size) and industry as we have matched 13. They are: RBC Capital Markets, CIBC World Market Inc., BMO Nesbitt Burns Inc., TD Securities Inc., Scotia Capital Inc., Merrill Lynch Canada Inc. and Goldman, Sachs & Co. No other Canadian-based investment bankers control more than 5% of the total market.. 19.
(23) our samples precisely on size and industry. Finally, we do not control for hot and cold market IPOs as we have matched and controlled for the time of issue. In sum, the base model takes the following form: L(OV)i = α1+ α2 L(inc)i + α3 L(BV)i + α4 L(Sales)i + α5 L(R&D)i + α6 DCountryi α7INSRETi + α8IBPi + ei. (1). where L(W) stands for the L transformation: L(W) = loge (1+W) when W ≥ 0 in $millions; L(W) = -loge (1-W) when W < 0 in $millions; OV = Offer Value = Offer price x number of shares outstanding immediately after the IPO (in US $ million) Inc = net Income before extraordinary items and R&D during the fiscal year closed just before the IPO (year –1) BV = Book value of equity at the end of the fiscal year closed just before the IPO Sales = Sales during the fiscal year closed just before the IPO R&D = Research and development costs during the fiscal year closed just before the IPO DCOUNT = 1 if the IPO is launched in the US. INSRET = Percentage of the post-IPO firm owned by pre-offering shareholders: (shares outstanding after offering - primary and secondary shares issued) / shares outstanding after offering. IBP = Investment bank prestige; IBP = 1 if the investment banker is prestigious. We also consider three alternative forms of the base model: L(OV)i = α1+ α2 L(Income) + α3 L(BV) + α4 L(Sales) + α5 L(R&D) + α6 DCountry α7 INSRET + α8 CEO change + α9 OD Change + α10 VC change + α12 O5 change + α12 IBP + ei (2) L(OV)i = α1+ α2 L(Income) + α3 L(BV) + α4 L(Sales) + α5 L(R&D) + α6 DCountry α7 INSRET + α8 CEO change + α9 OD Change + α10 VC change + α12 O5 change + α12 IBP + α13 DBI + α14 DGov + ei (3) L(OV)i = α1+ α2 L(Income)i + α3 L(BV)i + α4 L(Sales)i + α5 L(R&D)i + α6 DCountryi α7INSRETi + α8IBPi + α9Lrotationi + ei (4) where CEO change = the percentage of the pre-IPO firms sold by the CEOs. OD change = the percentage of the pre-IPO firms sold by the other directors and officers. VC change = the percentage of the pre-IPO firms sold by the VCs. O5 change = the percentage of the pre-IPO firms sold by the CEOs. DBI = a dummy variable for the Internet bubble period (1999-2000) * LInc DGov = a dummy variable for government or labour-sponsored VC funds.. 20.
(24) Lrotation = the logarithm of the rotation (TradeAmount / Market value) at the third anniversary of the IPO. 4.2. Regression Results Tables 4 and 5 present OLS regression analyses of IPO offer value models in subsection 4.1 for the two different matched samples as described above in subsection 3.2. We explicitly present six alternative models: three for each of the restricted matched sample (Table 4) and the whole sample (Table 5), as explicitly specified in subsection 4.1 immediately above. We discuss a variety of additional specifications below that were considered but did not materially affect the main results. [Insert Tables 4 and 5 About Here] The regressions provide very strong support for the proposition that IPOs are valued higher in the US. These estimates are statistically significant at the 1% level of significance and are economically large. The estimates from the restricted sample indicate valuations are higher by 42-47%, and the estimates from the whole sample indicate valuations are higher by 59-61%. The country effect matters a great deal regardless of how IPOs are matched by size, industry and year. Many of the control variables in the models are statistically significant in ways that are quite intuitive and consistent with the prior literature. First, we find a negative relation between income and IPO valuation, and this finding is not due to collinearity with the other control variables. Consistent with Aggarwal et al. (2009) and Botman et al. (2004), the intuition is that negative earnings are a proxy for stronger growth potential. Consistent with these earlier studies, we note that when we separate out the effect for the Internet bubble period we find the effect of negative earnings is stronger, but for the non-Internet bubble period the effect is statistically significant. But regardless of how we control for different time periods, the central result pertaining to the country effect is not changed in any material way in terms of either economic and/or statistical significance. Our control variable for size in terms of the book value of equity is significant in most of the models. The sales and R&D variables are positively related to valuation in all of the models, and these effects are statistically significant at the 1% level for sales and at least at the 5% level for R&D in all of the models.. 21.
(25) The effect on valuation from the percentage of the post-offering firm owned by the preIPO shareholders is positive and significant at the 1% level in all of the models. This finding is consistent with Ljungqvist and Wilhelm (2003), who reason that great insider ownership strengthens incentives to bargain for better offer terms. The variables for insider ownership change are insignificant. Finally, we note there is a strong positive effect of prestigious investment bankers on IPO valuation. This effect is significant at the 1% level in all models. Investment bankers certify the quality of the IPO firm and facilitate greater investor confidence, which results in higher valuations (Carter and Manaster, 1990; Carter et al. 1998). We considered variables for the quality of auditors and VCs. In terms of auditors, almost all (approximately 98%) VC-backed IPOs used prestigious auditors, and as such there was not material variation and the effect of auditors was insignificant. Regarding VC quality, various proxies considered were statistically insignificant. For example, we considered variables for government funds and labour-sponsored fund (see Table 3 and accompanying text), which are typically of lower quality (Cumming and MacIntosh 2003; Cumming and Johan 2009). There were only 28 IPOs that involved labour sponsored funds. We find in Models 3 and 6 that dummy variables for government or labour-sponsored funds are insignificant and do not affect the results. Also, in other regressions considered, we likewise found that dummies for labour-sponsored only to be statistically insignificant (although the correlation between these variables and valuation is slightly negative in Table 3). Regardless, inclusion / exclusion of these variables did not materially affect the other variables of interest, particularly not the country dummy variable effect. The rotation variable is closely related to the country and, for this reason, we cannot simply include the Lrotation variable in the model. We test for the liquidity argument by using the Lrotation variable to define different sub samples. These sub samples include the paired observations only if the rotation of the US firm is less than four (three, two, one) times the rotation of the Canadian matched firms. Table 6 shows that even when the rotations are the approximately the same for the US and the Canadian firms (rightmost column), the country variable is less significant, but is still significant. These results show that the difference in valuation between Canada and the US is linked to a difference of liquidity. But due to the 22.
(26) significance of the country coefficient, we cannot rule out the fact that the difference of valuation between the US and the Canadian firms are at the same time linked to differences in listing requirements between the two countries. We considered a number of additional specifications to assess robustness that are not explicitly reported for reasons of conciseness but nevertheless available on request. For example, we considered the impact of Sarbanes Oxley legislation (SOX) on IPO valuation. According Johnson and Madura (2009), SOX reduces IPO uncertainty and underpricing, and as such we cannot rule out an effect on valuation. Less uncertainty implies a lower cost of capital and higher valuations. We tested the effect of SOX with a post-July2002 dummy variable equal to 1, and we did not find any significant effect. Also, we ran regressions on different subsets of years (e.g., in a prior version with data up to 2004, while the current data are extended to 2007), and did not find any material differences in the results. These and other specifications are available on request. 5. Conclusion This paper empirically analyzed the valuation of VC-backed IPOs with comparisons across Canada and the US. We posited that the lower listing requirements in Canada would lead to valuations that are much lower in Canada relative to the US, all else being equal. Based on a unique sample of hand-collected data that matched IPOs by size, industry and year across Canada and the US, and controlling for numerous accounting and financial statement variables, ownership levels, ownership changes, and investment banking, VC and auditor quality, we found robust statistically significant evidence that IPOs are valued lower in Canada by approximately 48-66%. Our findings are new insofar as prior studies comparing valuations of publicly traded firms in Canada and the US focus on larger companies with significant analyst coverage. Those prior studies show very small differences in the cost of capital and hence very small differences in valuation of approximately 3%. We note that the pronounced differences in valuations of small IPO issuers across Canada and the US over the 1986-2007 period are consistent with the view that the Canadian and US IPO markets are segmented due to the regulatory differences (King and Segal, 2008). In our empirical analyses, we matched by size, industry and year and controlled for a variety of variables pertaining to company financial statement performance and ownership. Still, companies continue 23.
(27) to go public in Canada despite the lower valuations. The path Canadian companies follow to obtain US listings is to first go public in Canada and then pursue cross-listing once successfully established in Canada. This strategy minimizes the costs of going public and avoids the more onerous regulations faced by companies going public in the US (Industry Canada, 2001). By focusing on earlier stage companies where the regulatory environment has a more pronounced effect (Daines and Klausner, 2001), the data herein show the economic costs of low listing standards are large. The policy implications are significant. Low levels of valuations for IPOs in Canada can exacerbate the comparatively lower performance of the Canadian VC market relative to the US. The evidence of a low valuation and post-listing performance of VC-backed IPOs could be an explanation of the lack of IPO activity of Canadian VCs observed by Cumming and Johan {, 2009 #7158}. The fact that IPOs are valued lower in Canada than in the US can also explain why VC is less developed in Canada than in the US.. 24.
(28) Table 1 Characteristics of the matched sample of Canadian and US Venture-capital backed IPOs, 19862007. Gross proceeds are expressed in million of US dollars (US$M). issue price is expressed in US$. EBITDA stands for earnings before interest, tax, depreciation and amortization. Total assets, Shareholders' equity, sales, EBITDA and net income are expressed in US$M. ROA is EBITDA divided by total assets. ROE is net income divided by shareholders’ equity. The final two columns test whether the difference between the mean (median) summary statistics is statistically significant across sample. Statistical significance at the 10%, 5%, and 1% levels is indicated by *, **, ***, respectively. Canadian IPOs. #. mean. US IPOs. mean difference t test p value. median difference p value (sign rank). median. #. mean. median. 26.42 7.08 23.60 32.74 6.11 0.27. 126 4 87 35 126 126 91. 57.83 70.65 47.41 82.26 12.19 0.27 0.95. 46.20 75.63 43.13 70.00 12.00 0.25. 0.2256 0.9062 0.0312 ** <0.0001 *** 0.0006 *** -. <0.0001 0.0003 0.0004 <0.0001 0.0789 -. 0.9034 0.7207 0.0100 *** 0.8465 0.3242 0.7351 0.0012 *** 0.3583 0.6654 0.8476 <0.0001 ***. 0.6115 0.0270 0.0017 0.0411 0.0212 0.0043 0.0013 0.0167 0.0214 0.9679 <0.0001. Panel A : Characteristics of the issue Gross Proceeds (GP) Oil & Gas issuers' GP High-Tech issuers' GP Other issuers' GP Issue Price % of post-IPO shares sold % of firm's commitment. 126 6 75 45 124 123 100. 47.57 24.13 46.00 53.29 6.57 0.34 0.81. *** *** *** *** *. Panel B : Characteristics of the issuer prior to the issue Age, in year Total assets Shareholders' equity (SE) Negative SE Sales EBITDA Net Income Negative net income ROA ROE Net margin Asset turnover Debt to Asset. 121 126 125 23 126 126 126 59 126 126 126 126 126. 11.23 86.97 19.10 0.24 70.78 9.18 -1.10 -0.02 -0.73 -4.19 1.00 0.72. 7.01 18.26 5.10 13.61 1.00 0.19 0.07 0.03 0.01 0.83 0.69. 126 124 125 60 126 111 126 77 111 126 126 124 124. 10.99 76.48 -1.56 0.64 75.70 4.28 -1.78 -0.30 -0.03 -5.21 1.02 1.38. 7.54 24.41 0.80 26.45 -1.11 -2.34 -0.04 -0.60 -0.12 0.87 0.96. 120 66 100. 37.26 62.80 15.13. 3.11 19.64 7.31. 118 49 65. 40.37 74.16 20.43. 4.27 38.64 9.35. ** *** * ** *** *** ** ** ***. Panel C : Multiples Price to sales Price to earnings Price to book value. 0.7796 0.5461 0.1887. 0.1021 * 0.0326 ** 0.0845 *. 25.
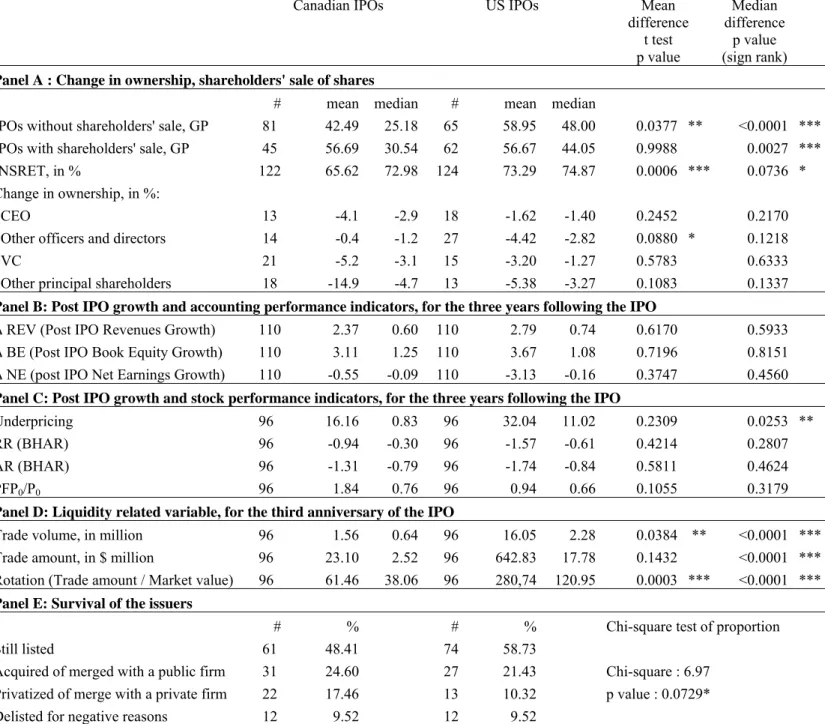
(29) Table 2 Change in ownership at the IPO and survival of the issuer. Panel A reports the shareholders' sale of shares. Panel B reports the fate of the issuer at the end of the study period (June 10, 2009). Negative reasons include bankruptcy, dissolution, delisting for failure to sustain listing requirements and reverse takeover on the company. Gross proceeds (GP) are expressed in US$M. INSRET is post-IPO ownership retention of pre-IPO shareholders and is measured as: (share outstanding after offering – primary and secondary shares issued) / share outstanding after offering. Underpricing is the initial return estimated between the IPO price and the closing price of the first month of trading. RR (AR) is the raw return (abnormal return), including the underpricing, using a BHAR methodology. PFP0/P0 is the ratio of the perfect foresight price to issue price. The final two columns test whether the difference between the mean (median) summary statistics is statistically significant across then samples. Statistical significance at the 10%, 5%, and 1% levels is indicated by *, **, ***, respectively. Canadian IPOs. US IPOs. Mean difference t test p value. Median difference p value (sign rank). Panel A : Change in ownership, shareholders' sale of shares IPOs without shareholders' sale, GP IPOs with shareholders' sale, GP INSRET, in % Change in ownership, in %: CEO Other officers and directors VC Other principal shareholders. # 81 45 122. mean 42.49 56.69 65.62. median 25.18 30.54 72.98. # 65 62 124. mean 58.95 56.67 73.29. median 48.00 44.05 74.87. 13 14 21 18. -4.1 -0.4 -5.2 -14.9. -2.9 -1.2 -3.1 -4.7. 18 27 15 13. -1.62 -4.42 -3.20 -5.38. -1.40 -2.82 -1.27 -3.27. 0.0377 ** 0.9988 0.0006 *** 0.2452 0.0880 * 0.5783 0.1083. <0.0001 *** 0.0027 *** 0.0736 * 0.2170 0.1218 0.6333 0.1337. Panel B: Post IPO growth and accounting performance indicators, for the three years following the IPO Δ REV (Post IPO Revenues Growth) Δ BE (Post IPO Book Equity Growth) Δ NE (post IPO Net Earnings Growth). 110 110 110. 2.37 3.11 -0.55. 0.60 1.25 -0.09. 110 110 110. 2.79 3.67 -3.13. 0.74 1.08 -0.16. 0.6170 0.7196 0.3747. 0.5933 0.8151 0.4560. 0.2309 0.4214 0.5811 0.1055. 0.0253 ** 0.2807 0.4624 0.3179. Panel C: Post IPO growth and stock performance indicators, for the three years following the IPO Underpricing RR (BHAR) AR (BHAR) PFP0/P0. 96 96 96 96. 16.16 -0.94 -1.31 1.84. 0.83 -0.30 -0.79 0.76. 96 96 96 96. 32.04 -1.57 -1.74 0.94. 11.02 -0.61 -0.84 0.66. 96 96 96. 16.05 642.83 280,74. 2.28 17.78 120.95. # 74 27 13 12. % 58.73 21.43 10.32 9.52. Panel D: Liquidity related variable, for the third anniversary of the IPO Trade volume, in million Trade amount, in $ million Rotation (Trade amount / Market value). 96 96 96. 1.56 23.10 61.46. # 61 31 22 12. % 48.41 24.60 17.46 9.52. 0.64 2.52 38.06. 0.0384 ** 0.1432 0.0003 ***. <0.0001 *** <0.0001 *** <0.0001 ***. Panel E: Survival of the issuers Still listed Acquired of merged with a public firm Privatized of merge with a private firm Delisted for negative reasons. Chi-square test of proportion Chi-square : 6.97 p value : 0.0729*. 26.
(30) Table 3 Pearson correlation coefficient matrix. This table presents Pearson correlation coefficients for each of the variables in the dataset for the restricted sample (126 matched IPOs for a total of 252 observations). L(OV) is the L transformation of the offer value, which is the offer price multiplied by the number of shares outstanding immediately after the IPO (in US$M). L(inc) is the L transformation of net Income before extraordinary items and R&D, L(BV) is the L Transformation of Book value of equity, L(sales) is the L transformation of Sales, L(RD) is the L transformation of R&D expenses. All these accounting data are measured at the end of the fiscal year closed just before the IPO. DCountry is equal to 1 if the issue’s country is the US. INSRET is percentage of the post-IPO firm owned by pre-offering shareholders. IBP is equal to 1 if the investment banker is considered as prestigious. DLSVCC is equal to 1 if a labour-sponsored VC had been involved with the firm prior to IPO. DGOV is equal to 1 if a government or labour-sponsored VC had been involved with the firm prior to IPO. LRotation if the logarithm of the rotation (Trade amount / Market value) for the third anniversary of the IPO. Correlations greater than 0.11, 0.13, and 0.18 in absolute value are significant at the 10%, 5% and 1% levels, respectively.. (1) (2) (3) (4) (5) (6) (7) (8) (9) (10) (11) (12) (13) (14) (15). L(OV) L(inc) L(BV) L(sales) L(RD) DCountry INSRET CEO change OD change VC Change O5 change IBP DGOV DLSVCC LRotation. (1). (2). (3). (4). 1.00 0.01 0.02 0.44 0.06 0.36 0.19 -0.06 -0.15 -0.05 0.02 0.54 -0.14 -0.06 0.26. 1.00 0.39 0.54 -0.26 -0.16 -0.25 -0.04 -0.19 -0.13 -0.16 -0.04 0.00 -0.07 -0.05. 1.00 0.27 -0.13 -0.26 -0.19 -0.01 -0.09 -0.10 -0.11 -0.05 0.15 0.12 -0.09. 1.00 -0.27 0.12 -0.27 -0.05 -0.23 -0.13 -0.12 0.38 -0.16 -0.18 0.12. (5). (6). 1.00 -0.11 1.00 0.21 0.22 -0.12 0.05 0.04 -0.16 -0.01 0.05 0.07 0.11 0.03 0.17 0.15 -0.35 0.07 -0.31 -0.02 0.35. (7). (8). 1.00 0.05 0.07 0.09 0.30 -0.09 0.04 -0.02 0.10. 1.00 0.21 0.08 -0.02 -0.09 0.06 0.03 0.06. (9). (10). (11). (12). 1.00 0.07 1.00 0.02 0.08 -0.09 0.01 0.03 -0.03 0.02 -0.10 0.05 0.00. 1.00 -0.06 0.00 -0.01 0.01. 1.00 -0.14 -0.05 0.18. (13). (14). (15). 1.00 0.67 1.00 -0.15 -0.09 1.00. 27.
Figure
Related documents
If the sale is VAT exempt, it is usually exempt from PCC, except for land and buildings (purchase of real estate is subject to 2% transfer tax on its market value even if
When analyzing the written premiums in an unwavering, global financial market, it is believed that in Poland the premium income will increase by an average of about
Private clouds are often the choice of companies who want the benefits of cloud computing, but don’t want their data held in a public environment.. FAQs About Security, Where You
n And they don ’ t attract traffic, unlike customer address space. p Links from ISP Aggregation edge
In that study, in- sulin resistance and fasting serum glucose were not significantly different between the acromegalic patients and control subjects, with fasting insulin in
Digoxin increases intracellular calcium in cardiac myocytes, slows AV node conduction, and can increase automaticity, triggering any type of dysrhythmia, the most common
We were able to successfully recapitulate regula- tion of cell type specific genes using previously known cis elements and also have been able to propose gene specific
have had a slight impact in the first year, (c) learning community participation had an impact in retention with low-socioeconomic participants having higher retention rates
