Back pain in society
The prevalence of chronic back pain should be placed in the context of the prevalence of back pain in general. Many studies attest to the high frequency of back complaints in society. 70–85% of all people have back pain at some time in life. The annual prevalence of back pain ranges from 15% to 45%, with point prevalences averaging 30%.1 In the USA, back pain is the most
common cause of activity limitation in people younger than 45 years, the second most frequent reason for visits to the physician, the fifth-ranking cause of admission to hospital, and the third most common cause of surgical procedures.2–4 About 2% of the US workforce are
compensated for back injuries each year.
Data from other western countries are similar. UK estimates place low-back pain as the largest single cause of absence from work in 1988–89, and it is responsible for about 12·5% of all sick days.5This figure is similar to
data from Sweden where, since 1961, 11–19% of all annual sickness absence days are taken by people with a diagnosis of back pain.1,6In 1987, 14·8 million workdays
were lost in Sweden because of back pain, which constitutes about 13·5% of all reported sick days. Overall, 8% of the insured Swedish population were listed as sick with a diagnosis of back pain at some time during 1987.
Cross-sectional surveys of local populations corroborate the data from the national surveys. Prevalence rates of back pain are difficult to compare because of the time of the sampling, the sampling technique, and the actual questions asked. Representative data that range from 12% to 35% are shown in table 1.
Chronic back pain
Praemer and colleagues2used the 1988 National Health
Interview Survey (1985–88) to estimate the frequency of chronic or permanent impairment in the USA. Musculoskeletal impairment was the most prevalent impairment in people aged up to 65 years, and back Lancet1999; 354:581–85
Department of Orthopedic Surgery, Rush-Presbyterian-St Luke’s Medical Center, Chicago, IL 60612, USA (G B J Andersson MD)
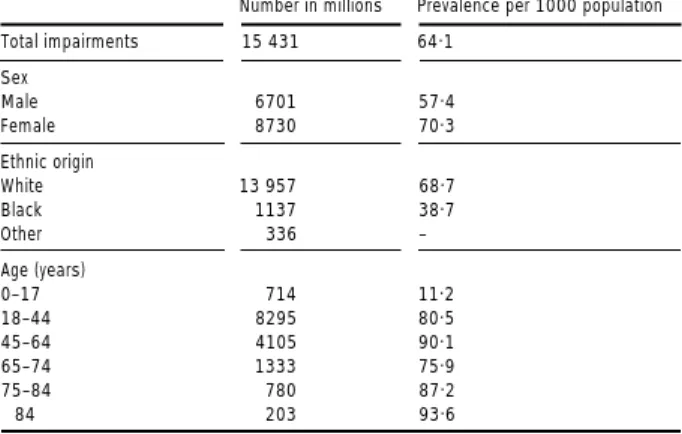
and spine impairments the most frequently reported subcategory of musculoskeletal impairment (51·7%). The annual rates varied significantly by sex and age (table 2). Back and spine impairments were more common in women (70·3 per 1000 population) than in men (57·3 per 1000 population), and more common among white people (68·7 per 1000 people) than black people (38·7 per 1000 people). In 1988, back and spine impairments resulted in over 185 million days of restricted activity (21·0 per impairment), which included 83 million days confined to bed (5·4 per impairment; table 3). About 56% of days of restricted activity occurred among women. Rossignol and colleagues19 followed a cohort of
2341 cases that were randomly sampled to represent individuals who had been compensated for occupational back injury in the state of Quebec, Canada, in 1981. 6·7% of the sample were still absent from work after 6 months, which accounted for 68% of work days lost and 76% of the total compensation cost for low-back pain. When the cumulative absence was calculated over 3 years, 9·7% of workers were absent for 6 months or longer, which illustrates the recurrent nature of back pain. A logistic-regression model was used to calculate
Epidemiological features of chronic low-back pain
Gunnar B J Andersson
Review
Although the literature is filled with information about the prevalence and incidence of back pain in general, there is less information about chronic back pain, partly because of a lack of agreement about definition. Chronic back pain is sometimes defined as back pain that lasts for longer than 7–12 weeks. Others define it as pain that lasts beyond the expected period of healing, and acknowledge that chronic pain may not have well-defined underlying pathological causes. Others classify frequently recurring back pain as chronic pain since it intermittently affects an individual over a long period. Most national insurance and industrial sources of data include only those individuals in whom symptoms result in loss of days at work or other disability. Thus, even less is known about the epidemiology of chronic low-back pain with no associated work disability or compensation. Chronic low-back pain has also become a diagnosis of convenience for many perople who are actually disabled for socioeconomic, work-related, or psychological reasons. In fact, some people argue that chronic disability in back pain is primarily related to a psychosocial dysfunction. Because the validity and reliability of some of the existing data are uncertain, caution is needed in an assessment of the information on this type of pain.
Study Lifetime Prevalence % Study group incidence
Point Period Number Age Sex (years) (M/F) Biering-Sorensen7 62·6 12·0 – 449 30–60 M Biering-Sorensen7 61·4 15·2 – 479 30–60 F Frymoyer, et al8 69·9 – – 1221 28–55 M Gyntelberg9 – – 25 – 40–59 M Hirsch, et al10 48·8 – – 692 15–72 F Hult11 60·0 – – 1193 25–59 M Magora12 – 12·9 – 3316 – M, F Nagi, et al13 – 18·0 – 1135 18–64 M, F Papageorgiou, et al14 59·0 – 35 1884 >18 M Papageorgiou, et al14 59·0 – 42 2617 >18 F Svensson, et al15 61 – 31 716 40–47 M Svensson, et al16 67 – 35 1640 38–64 F Valkenburg, et al17 51·4 22·2 – 3091 >20 M Valkenburg, et al17 57·8 30·2 – 3493 >20 F Walsh, et al18 58·3 – 36 2667 20–59 M,F Data from Andersson.1
Table 1: Prevalence and lifetime incidence of low-back pain in cross-sectional studies
Number in millions Prevalence per 1000 population Total impairments 15 431 64·1 Sex Male 6701 57·4 Female 8730 70·3 Ethnic origin White 13 957 68·7 Black 1137 38·7 Other 336 – Age (years) 0–17 714 11·2 18–44 8295 80·5 45–64 4105 90·1 65–74 1333 75·9 75–84 780 87·2 .84 203 93·6
Data from Praemer and colleagues.8
Table 2: Prevalence of back and spine impairments in USA in 1988
Restricted activity Bed days per days per impairment impairment
Total number 12·0 5·4 Sex Male 14·5 5·9 Female 10·1 5·0 Ethnic origin White 10·1 4·2 Black 31·8 15·4 Age (years) >65 11·5 5·4 ¶65 15·0 5·3
Data from Praemer and colleagues.2
Table 3: Restricted activity days and days confined to bed (bed days) for back or spine disorders in 1988 by major population subgroup
Study Time (weeks) to return to work
1 2 4 6 8 12 24 52
Andersson, et al37 46 – 63 75 88 94 97 98 Choler, et al38 60 67 – 88 – 95 98 99 Spitzer, et al22 – – 74 – 92 – 93 96 Webster and Snook39 42 62 – 79 – 87 89 93 van Doorn20 – 53 65 71 – 80 88 93 All data are % of population.
Table 4: Proportion of population listed as sick with diagnosis of back pain by time taken to return to work
risk factors associated with absences from work of 6 months or longer, and showed that age and site of symptoms were the two most important variables. A 23-year increase in age doubled the odds of accumulating at least 6 months of absence, and lumbar symptoms were 2·86 times more likely than thoracic symptoms to become chronic. The odds ratios for sex and occupation were not significant. van Doorn20 reported that in a self-employed
subset of Dutch dentists, veterinarians, physicians, and physical therapists, 23% of claims lasted longer than 6 months or were deemed chronic. The risk of chronic back pain increased with older age. With a predictive Cox’s regression model, van Doorn found that a specific aetiological diagnosis, older age, previous back pain, and psychosocial disorders were factors that had a negative effect on recovery.
Psychological distress and psychiatric
disorders
Various cross-sectional studies indicate an association between psychological factors and the occurrence of low-back pain.1 These factors include anxiety, depression,
somatisation symptoms, stressful responsibility, job dissatisfaction, mental stress at work, negative body image, weakness in ego functioning, and poor drive satisfaction. The experience of stress, anxiety, and depression is sometimes, but not always, secondary to back pain. In a few prospective studies, various symptoms that indicate psychological distress predicted the development of back disorders in people who did not have previous back pain.
The possible aetiological importance of psychiatric disorders was investigated by Polatin and colleagues21in a
group of 200 patients with chronic low-back pain who were entering a functional-restoration programme. The patients were assessed for current and lifetime psychiatric syndromes; 77% of patients met lifetime diagnostic criteria and 59% showed current symptoms for at least one psychiatric diagnosis, most commonly depression, substance misuse, and anxiety disorders. In addition, 51% met criteria for at least one personality disorder. These prevalence rates were significantly greater than rates in the general population. 54% of patients with depression, 94% of those with substance abuse, and 95% of those with anxiety disorders had experienced these syndromes before the onset of their back pain. This finding suggests that substance abuse and anxiety disorders precede chronic low-back pain, whereas depression may develop before or after the onset of this type of back pain.
Recovery from back pain
Most patients with back pain recover quickly and without residual functional loss. Table 4 shows the similarities in recovery rates between studies and countries. Overall, 60–70% recover by 6 weeks, 80–90% by 12 weeks (figure 1). Recovery after 12 weeks is slow and uncertain. Fewer than half of those individuals disabled for longer than 6 months return to work and, after 2 years of absence from work, the return-to-work rate is close to zero.22 Diagnosis has been found to affect recovery;
patients with sciatica recover more slowly than those with back pain alone. Andersson and colleagues23 report that
60% of patients with low-back pain recovered in 10 days, compared with 40% of patients with sciatica.23
Compensation has a negative influence on the length of disability. Sander and Meyers23 compared disability
periods for “on-duty” injuries and “off-duty” injuries. The study included both lumbar sprains and strains and patients who underwent an operation. The average time off work for an on-duty strain injury was 14·9 months, compared with 3·6 months for off-duty injuries; the corresponding periods of absence for patients who had an operation were 9·3 and 4·4. These data are supported by Greenough and colleagues’ findings.25 In a retrospective
cohort study of 300 patients in Adelaide, Australia, the average time off work for men with compensation was 12 (range 0·25–84) months versus 0·25 (0–180) months for men with no compensation, for women, the corresponding off-work periods were 15 (0–132) and 0·5 (0–22) months. The type of accident, diagnosis, and specific treatment did not affect outcome, whereas psychological disturbance was a major determinant of outcome. Leavitt26 found that work-related back
symptoms resulted in longer absence from work than non-work-related symptoms, even after control for the influence of the physical work environment.
Age has also been found to have a negative effect on recovery.19,20,27–31 It is unclear whether the effect of age is
due to a reduced ability to recover from an injury with older age or to socioeconomic or general health factors.
Psychological factors are known covariants of chronic low-back pain and of chronic pain in general. Their role as predictors of recovery from back pain is unclear. Frymoyer and Cats-Baril32 reported that psychological
variables at the beginning of a back pain episode did not predict long-term disability, whereas van Doorn20
reported opposite findings.
Predictive models of return to work
There have been various attempts to develop models to predict the duration of absence from work due to low-back pain. These models are difficult to compare because of differences in the population studied, time of the evaluation, and socioeconomic differences between countries. Rossignol and colleagues19 used a
logistic-regression model to analyse factors that influence the risk of work-related sickness absence for longer than 6 months. Age and location of symptoms were the most important variables. Frymoyer and Cats-Baril33assembled
a panel of experts to reach consensus on the factors that predict disabling low-back pain, and to assign weighting to these factors. This expert model included factors on injury, self-efficacy, demographic characteristics, history of pain, and employment. The model was tested on a group of patients from a low-back pain clinic, and compared with an empirical model, developed by a logistic statistical technique. The work environment, psychosocial factors, and the duration of the current episode of low-back pain were the main predictors. Other factors associated with long-term disability were perception of fault, involvement of lawyers, self-prediction of disability, income, educational attainment, and employer attitudes. Physical and pure psychological factors had no predictive value. Burton and colleagues34
used multiple-regression analyses and concluded that persistent disability (after 1 year) was mainly related to psychosocial factors. In another study, Lancourt and Kettelhut35 concluded that non-organic factors were
better predictors of return to work than organic factors. Specifically, they reported that for a group of patients who did not return to work within 6 months, previous injuries and stability of family living arrangements were important factors.
Recurrence
The recurrence rate of low-back pain is so high that it seems to be part of its natural history. Table 5 shows data from different studies. Lifetime recurrences of up to 85% were reported by Valkenburg and Haanen,17
whereas in Sweden, the 1-year recurrence of sick-listing for low-back
pain was 44% in 1987.6 Data from Canada show
recurrence rates of 20% in 1 year and 36% over 3 years.19,36
Men had a higher risk of recurrence than women, and people aged 25–44 years had the highest rate of recurrence. Occupation also affected the rate of recurrence, the highest rate occurred in nurses and drivers and the lowest among white-collar workers.
Office visits to physicians
In 1990, there were about 15 million office visits to physicians in the USA for mechanical low-back pain, which accounts for about 2·8% of all office visits.4Since
Hart and colleagues4did not include visits to allied health
professionals, such as chiropractors, the actual number of office visits was probably more than 30 million per year. Among physicians and osteopaths, the number of visits in 1989–90 was only slightly higher than in 1980–81 (when it was 12·2 million). Another US study included chiropractors and divided the office visits into “episodes of spine care”, which were defined as all visits believed to be associated with a particular episode of back pain; only people aged up to 65 were included.37
According to this definition, there were 9·1 episodes per 100 person-years. European statistics are similar. In 1992–93, there were 7 million visits to general practitioners for back pain in the UK. The annual rate of consultations with these patients in the UK has been estimated at 5·5–7·5% of the adult population. Swedish estimates from 1987 for the number of outpatient visits for back pain are 790 000 people or 8·9 per 100 person-years.
With respect to chronic back pain, Koch’s analysis44
of the 1980–81 data discussed above, reported that 17·9% of all visits for chronic pain were for chronic back pain. In about 47% of those visits, an analgesic was prescribed. Data from other studies cited by Hart4show
that on an annual basis 41% of patients with chronic back pain visit a physician, 30% a chiropractor, and 8% another type of care provider. Since patients’ visits to chiropractors average a higher number per case, Hart estimated that in a typical office, over half of the workers visits for chronic low-back pain are to a chiropractor. Figure 1: Time course of acute low-back pain
About 90% resolve in 3 months. Data from Andersson and colleagues.37
Study % of study population Time (years) Type of study population
Abenhaim35 20·0 1 Prospective Occupational BP
36·3 3 Prospective
Occupational BP Anderson40 8·9 2 Dockyard workers Bergquist-Ullman41 22·0 1 Prospective
Occupational BP Biering-Sorensen42 38 (men) 1 Prospective
39 (women) 1 Random sample Choler, et al38 12·0 1·5 Work absence
Perospective Moens, et al43 72·0 Lifetime Female family care
employed
Nachemson6 44·0 1 Sickness absence data van Doorn20 8·6 1 Claims, self-employed
16·0 2
20·0 3
47·0 8
Table 5: Recurrence of back pain
Rates of hospital admission and surgery
Volinn and colleagues45 examined the US NationalHospital Discharge Survey for time trends (1979–87), and Taylor and colleagues3extended the study to include
data up through 1990. During the 11 years surveyed, operations among adults for low-back pain increased by 55% from 147 500 in 1979 to 279 000 in 1990. This rise corresponds to an increase from 102 to 158 per 100 000 adults. This increase was particularly great for fusions that increased by 100% from 13 to 26 per 100 000 adults. In 1990, there were 46 500 lumbar fusions and 232 500 operations without fusion for low-back pain. Non-surgical admissions to hospital, on the other hand, decreased from 402 per 100 000 adults in 1979 to 150 per 100 000 adults in 1990. The average rate of back surgery for 1988–90 were lowest in the west (113 per 100 000 adults) and highest in the south (171 per 100 000 adults). Similar regional trends were also found for non-surgical hospital admissions.
There are substantial variations between countries in rates of back surgery. Cherkin and colleagues46compared
the rates of surgery for back pain in 13 countries and Canadian provinces and found that in the USA, the rate is at least 40% higher than in any other country, and more than five times higher than in Scotland and England (figure 2). Differences in the underlying prevalence of back pain are unlikely explanations for the differences in surgical rates. More likely explanations are cultural differences, differences in practice patterns, and the availability of health-care providers.
Conclusion
Back pain of at least moderate intensity and duration has an annual incidence in the adult population of 10–15%, and a point prevalence of 15–30%. The prevalence rises with increasing age up to 65 years, after which age it drops off for unknown reasons. The outlook for patients with back pain is generally excellent with 90% or greater recovery over 3 months. Unfortunately, for individuals who did not recover within this time the recovery process is slow and their demand on the health-care system is
large and costly; these individuals are also a cause of major disability and absence from work. Back and spine impairments are the most common impairment among young and middle-aged people. Although back pain seems to be equally common in men and women, back and spine impairments are more common in women than in men. Disability trends indicate large increases in all developed countries. Among the factors that contribute to long-term disability are: age, location of symptoms, and legal, socioeconomic, and psychological factors. Rates of surgery for back pain have increased rapidly over the past 15 years, whereas rates of non-surgical hospital admission have decreased. Compared with other developed countries, the surgical rates in the USA are high, but there are also large variations between different US regions. To reduce chronicity, disability, and cost, p r e v e n t i v e measures should be explored. Unfortunately, attempts to prevent the occurrence of back pain (primary prevention) have been unsuccessful and prevention of the negative consequences of a back-pain episode may be more fruitful.
References
1 Andersson GBJ. The epidemiology of spinal disorders.
In: Frymoyer JW, ed. The adult spine: principles and practice, 2nd ed. Philadelphia: Lippincott-Raven, 1997: 93–141.
2 Praemer A, Furnes S, Rice DP. Musculoskeletal conditions in the United States. Rosemont: AAUS, 1992: 1–99.
3 Taylor VM, Deyo RA, Cherkin DC, Kreuter W. Low-back pain hospitalization: recent United States trends and regional variations.
Spin 1994; 19: 1207–13.
4 Hart LG, Deyo RA, Cherkin DC. Physician office visits for low back pain. Spine 1995; 20: 11–19.
5 Frank A. Low back pain. BMJ 1993; 306: 901–08. 6 Nachemson AL. Back pain. Causes, diagnosis and treatment.
Stockholm: The Swedish Council of Technology Assessment in Health Care, 1991.
7 Biering-Sorensen F. Low back trouble in a general population of 30-, 30-, 50-, and 60-year old men and women. Study design,
representativeness and basic results. Dan Med Bull 1989; 29: 289–99. 8 Frymoyer JW, Pope MH, Clements JH, Wilder DG, McPherson B,
Ashikaga T. Risk factors in low back pain: an epidemiological survey.
J Bone and Joint Surg 1983; 65A: 213.
9 Gyntelberg F. One year incidence of low back pain among male residents of Copenhagen aged 40–59. Dan Med Bull 1974; 21: 30–36. 10 Hirsch C, Jonsson B, Lewin T. Low back pain symptoms in a Swedish
female population. Clin Orthop 1969; 63: 171–16.
11 Hult L. Cervical, dorsal and lumbar spinal syndromes. Acta Orthop
Scand 1954; 17 (suppl): 1–102.
12 Magora A. Investigation of the relation between low back pain and occupation. 2. Work history. Ind Med Surg 1970; 39: 504–10. 13 Nagi SZ, Riley LE, Newby LG. Social epidemiology of back pain in a
general population. J Chronic Dis 1973; 26: 769–79. 14 Papageorgiou AC, Croft PR, Ferry S, Jayson MIV, Silman AJ.
Estimating the prevalence of low back pain in the general population.
Spine 1995; 20: 1889–94.
15 Svensson HO, Andersson GBJ, Johansson S, Wilhelmsson C, Vedin A. A retrospective study of low back pain in 38- to 64-year-old women. Frequency and occurrence and impact on medical services.
Spine 1988; 13: 548–52.
16 Svensson HO, Andersson GBJ. Low back pain in forty to forty-seven year old men. 1. Frequency of occurrence and impact on medical services. Scand J Rehab Med 1982; 14: 47–53.
17 Valkenburg HA, Haanen HCM. The epidemiology of low back pain. In: White AA, Gordon SL, eds. Symposium on idiopathic low back pain. St Louis: Mosby, 1982: 9–22.
18 Walsh K, Cruddas M, Goggon D. Low back pain in eight areas of Britain. J Epidemiol Community Health 1992; 46: 227–30. 19 Rossignol M, Suissa S, Abenhaim L. Working disability due to
occupational back pain: three-year follow-up of 2300 compensated workers in Quebec. J Occup Med 1988; 30: 502–05.
20 van Doorn TWC. Low back disability among self-employed dentists, veterinarians, physicians and physical therapists in the Netherlands.
Acta Orthop Scand 1995; 66 (suppl 263): 1–64.
21 Polatin PB, Kinney RK, Gatchel RJ, Lillo E, Mayer TG. Psychiatric illness and chronic back pain. The mind and the spine—which goes first? Spine 1993; 18: 66–71.
Figure 2: Ratios of rates of surgery for back pain in 11 countries and Canadian provinces compared with rates in USA
22 Spitzer WO, LeBlanc FE, Dupuis M, et al. Scientific approach to the assessment and management of activity-related spinal disorders: a monograph for clinicians. Report of the Quebec Task Force on Spinal Disorders. Spine 1987; 12: S1–S59.
23 Andersson GBJ, Svensson HO, Oden A. The intensity of work recovery in low back pain. Spine 1983; 8: 880–84.
24 Sander RA, Meyers JE. The relationship of disability to compensation status in railroad workers. Spine 1986; 11: 141–43.
25 Greenough CG. Recovery from low back pain. 1–5 year follow-up of 287 injury-related cases. Acta Orthop Scand 1993; 64: (suppl 254): 1–64.
26 Leavitt F. The physical exertion factor in compensable work injuries: a hidden flaw in previous research. Spine 1992; 17: 307–10.
27 Afacan AS. Sickness absence due to back lesions in coal miners. J Soc
Occup Med 1982; 32: 26–31.
28 Battie MC. The reliability of physical factors as predictors of the occurrence of back pain reports. A prospective study within industry. PhD thesis. Goteborg: University of Goteborg, 1989.
29 Battie MC, Bigos SJ, Fisher LD, et al. Anthropometric and clinical measurements as predictors of industrial back pain complaints: a prospective study. J Spinal Dis 1990; 3: 195–204.
30 Bigos SJ, Spengler DM, Martin NA, Zeh J, Fisher L, Nachemson A. Back injuries in industry: a retrospective study. III. Employee-related factors. Spine 1986; 11: 252–56.
31 Spengler DM, Bigos SJ, Martin NA, Zeh J, Fisher L, Nachemson A. Back injuries in industry: a retrospective study. I. Overview and cost analysis. Spine 1986; 11: 241–45.
32 Frymoyer JW, Cats-Baril W. An overview of the incidence and costs of low back pain. Orthop Clin North Am 1991; 22: 263–71.
33 Frymoyer JW, Cats-Baril W. Predictors of low back pain disability.
Clin Orthop 1987; 221: 89–98.
34 Burton KA, Tillotson KM, Main CJ, Hollis S. Psychosocial predictors of outcome in acute and subchronic low back trouble. Spine 1995;
20: 722–28.
35 Lancourt J, Kettelhut M. Predicting return to work for lower back pain patients receiving workers’ compensation. Spine 1992; 17: 629–40.
36 Abenhaim L, Suissa S, Rossignol M. Risk of recurrence of
occupational back pain over three year follow-up. Br J Ind Med 1988;
45: 829–33.
37 Shekelle PG, Markovich M, Louie R. An epidemiologic study of episodes of back care. Spine 1995; 20: 1668–73.
38 Choler U, Larsson R, Nachemson A, Peterson LE. Back pain. Spri report 188. Stockhom: Spri, 1985.
39 Webster BS, Snook SH. The cost of 1989 workers’ compensation for low back pain claims. Spine 1994; 19: 111–16.
40 Anderson JA. Epidemiological aspects of back pain. J Soc Occup Med 1986; 36: 90–94.
41 Bergquist-Ullman M, Larsson U. Acute low back pain in industry: a controlled prospective study with special reference to therapy and confounding factors. Acta Orthop Scand 1977; 170 (suppl): 1–117. 42 Biering-Sorensen F. A prospective study of low back pain in a general
population. I. Occurrence, recurrence and aetiology. Scand J Rehabil
Med 1983; 15: 71–79.
43 Moens GF, Dohogne T, Jaques P, Van Helshoecht P. Back pain and its correlates among workers in family care. Occup Med 1993; 43: 78–84.
44 Koch H. The management of chronic pain in office-based ambulatory care: national ambulatory medical care survey. Advance data from vital and health statistics, no 123. National Center for Health Statistics 1986. DHHS Pub No (PHS) 86-1250. Hyattsville, MD: Public Health Service, 1986.
45 Volinn E, Turczyn KM, Loeser JD. Patterns in low back pain hospitalization: implications for the treatment of low back pain in an era of health care reform. Clin J Pain 1994; 10: 64–70.
46 Cherkin DC, Deyo RA, Loeser JD, Bush T, Waddell G. An international comparison of back surgery rates. Spine 1994; 19: 1201–06.