Rating vs. Preference: A comparative study of
self-reporting
Georgios N. Yannakakis1and John Hallam2 1
Center for Computer Games Research, IT University of Copenhagen, Rued Langgaards Vej 7, Copenhagen S, [email protected]
2
Maersk Mc-Kinney Moller Institute, University of Southern Denmark, Campusvej 55, Odense, [email protected]
Abstract. This paper introduces a comparative analysis between rating and pair-wise self-reporting via questionnaires in user survey experiments. Two dissimi-lar game user survey experiments are employed in which the two questionnaire schemes are tested and compared for reliable affect annotation. The statistical analysis followed to test our hypotheses shows that even though the two self-reporting schemes are consistent there are significantorder of reportingeffects when subjects report via a rating questionnaire. The paper concludes with a dis-cussion of the appropriateness of each self-reporting scheme under conditions drawn from the experimental results obtained.
1
Introduction
Self-reporting provides the most direct approach to user experience annotation and af-fect detection. Quantitative reports via questionnaires offer unique properties for con-structing computational models of reported user states (affective or cognitive) and ease the analysis of subjective assessment in user studies. Even though beneficial for cog-nitive and affective capture and modeling, such reporting has several limitations such as self-deception, intrusiveness and subjectiveness. The appropriateness of the report-ing scheme used for affect detection is therefore vital for the validity of the obtained analysis.
This paper examines the relationship between two popular self-reporting schemes in user studies: self-reporting viarating(or scaling) and viapairwise preference. The two schemes are compared in two dissimilar game survey studies in which experiment participants are asked to post-report a set of affective states. For the comparison to be possible, pairwise preferences are inferred from the rating values and compared to the direct pairwise preferences. The two hypotheses the two questionnaire schemes are tested against are:
– H1: There is an inconsistency between reported preferences and reported rating. Rating responses do not match reported preferences.
– H2: The order of post-experience reporting has an effect on both rating and prefer-ence report schemes. Randomness exists in both self-report schemes.
The statistical analysis followed to test the above hypotheses suggests that while rating and preferences are consistent (with variant degrees of consistency), pairwise preferences are more appropriate detectors of user states, eliminating the subjective notion of scaling and effects related to reporting order.
2
Self-reporting
This paper focuses onforcedself-reports obtained via questionnaires. Such a self-report scheme constrains the participant to specific questionnaire items which could vary from simple tick boxes to multiple choice items while both the questions and the answers provided could vary from single words to sentences. Two types of forced self-reports that are described in more detail below, define the framework of investigations in this paper: self-reports viarating(or scaling) and self-reports viapreferences.
2.1 Rating
The vast majority of psychometric and user studies have adopted a type of rating report to capture the subjective assessment of the experiment participants ([11] among others). The most popular approach to rating reports is a form of a Likert scale [5] in which users are asked to rate an experience, an emotion or an interactive session. In most such studies Likert ratings are usually averaged across users before they are further analyzed. Such a practice has an impact on the ratings losing their subjective nature but also implies a knowledge of the scale that is beyond a relative rank order of data [11].
Among the limitations of rating ordinal scales, Linn and Gronlund [6] indicate the existence of personal bias which may (among others) occur when the subject is con-sistently using only part of the scoring scale, logical errors due to the confusion of the distinct items of an ordinal scale and the ability to use numerical information within scales which is affected by the subject’s internal cognitive processes, cultural back-ground, temperament, and interests [13]. There is also a large body of work suggest-ing the presence ofprimacyandrecencyorder effects in Likert questionnaires (see [2] among others).
The authors are not aware of a reliable statistical test that validates the reliability of a rating questionnaire as a whole. Cronbach’s alpha [4] (inter alia) is an estimate of internal consistency (or reliability) of sections of the questionnaire; Cohen’s kappa [3] assesses rater agreement in nominal scales.
2.2 Preference
Reporting via pairwise preferences has recently attracted the interest of researchers in affective and cognitive modeling ([16, 14, 12] among others) since it minimizes the as-sumptions made about subjects’ notions of highly subjective constructs such as emo-tions and allows a fair comparison between the answers of different subjects. Moreover, artifacts such as the subjective notion of rating/scaling are eliminated and lead to the construction of generalisable and accurate computational models of affect via user pref-erence modeling [14].
A preference questionnaire scheme may ask for the pairwise or multiple preference of participants or even ask them to provide a preferred order. In this paper we investigate pairwise preferences and are inspired by the seminal work of Scheffe [10] and Agresti [1] for the analysis of paired comparisons.
3
User survey case studies
This section presents the main phases of the experimental procedure followed to obtain self-reported emotional or cognitive states of experiment participants via both rating and preference schemes. The reader is referred to [16] for more details on the experimen-tal protocol used. The section concludes with the presentation of the two case studies considered in this paper.
3.1 System Instrumentation
The interactive systems we investigated are instrumented based on controllable param-eters identified by the designer. The selection of the paramparam-eters is based on their po-tential impact on the user’s affective and cognitive states examined and thereby to the post-experience self-reporting. For instance, a controllable parameter in a game system could be the speed of the game.
For each parameter under investigation, a number of states (e.g. ‘Low’, ‘High’) are selected. The product of the number of states for each of the parameters defines the num-ber of different system variants that will be examined. Given the proposed experimental design [16] each survey participant interacts with system variants in pairs (variant A and variantB) — differing in the levels/states of one or more of the selected control-lable parameters — for a selected time window. To test for potential order effects each subject interacts with the aforementioned system variants in both orders. Each time a system variant is completed the subject is asked to rate a particular experience using both a rating and a pairwise preference reporting scheme (described below).
3.2 Self-reported Post-experience
For rating questionnaires the question is expressed as: “The session feltE.” where E is the emotional state (e.g. frustration) under investigation. Two rating scales have been used in the experiments reported: a 20 point 10 scale, and a 1-5 scale. The 0-10 scale uses principles of thefunometer[9]; subjects have to rate the experience in a thermometer-designed Likert scale. On the other hand, the answers in the 1-5 scale rating scheme are inspired by the game experience questionnaire (GEQ) [8]; numbers have following glosses: 1:not at all; 2:slightly, 3:moderately, 4:fairlyand 5:extremely. For pairwisepreferencequestionnaires subjects are asked to fill in a questionnaire each time a pair of game sessions (variants) is finished. According to this scheme, the subject is asked to report whether the first variant felt more E than the second vari-ant. Specifically, for each completed pair of system variantsAandB, subjects report their preference regarding an emotional state,E, by selecting among the following 4-alternative forced choices (4-AFC):A [B] felt moreE thanB [A] (cf. 2-alternative forced choice); both felt equallyE; neither of the two feltE.
One of the limitations of the experimental protocol proposed is post-experience. Users report emotional states after playing games, which might generate memory-dependencies in the reports. Effects such as order of play and game learnability might also be apparent and interconnected to memory. The experimental protocol, however, is designed to test for order of play effects which, in part, reveal memory (report con-sistency over different orders) and learnability effects, if any. Lack of significant order effect provides evidence that the experimental noise generated in this way is random. Statistical analysis of the effect of order on subjects’ emotional judgement indicates the level of randomness in subjects’ preferences. Randomness is apparent when the sub-ject’s expressed preferences are inconsistent for the pair (A, B) independently of the questionnaire-scheme used.
3.3 The Playware Case Study
The first case study presented concerns game play sessions followed by self-reporting sessions of children playing physical interactive games [16, 17]. The game, called ‘Bug-Smasher’, designed using the Playware playground (interactive tiles) platform [7], is used here as the test-bed interactive system for investigating the relationship between self-reporting schemes. (The reader is referred to [16] for more details of Bug-Smasher). Seventy six children, aged 8 to 10 years old, participated in the survey experiment. Each subject played a set of 90 second Bug-Smasher variants, differing with respect to two control parameters: the speed of the game and the spatial diversity of game opponents. Children were not interviewed but were asked to fill in a questionnaire, minimizing interviewing effects. Each subject was asked to rate each game via a 10-scalefunometer[9] (in increments of 0.5) and after a pair of games were finished, to report a fun preference for the two games she played using a 2-AFC question, “which one of the two games was more fun?” The options offered for choice were “first” and “second”.
3.4 The Maze-ball Case Study
A screen-based computer game, named Maze-ball, is used for the second experiment reported in this paper. Maze-ball [18] is a three-dimensional predator/prey game. The goal of the player (ball) is to maximize her score by gathering as many tokens, scattered in the maze, as possible while avoiding being touched by a number of opponents in a predefined time window of 90 seconds. Further details about Maze-Ball and experimen-tal design can be found in [18].
Thirty six subjects aged from 21 to 47 years participated to the experiment. Each subject played a predefined set of eight games for 90 seconds each; the games differ in the virtual camera profile embedded. For each completed game and pair of games AandB, subjects report their emotional preference using a 5-point Likert scale based on GEQ [8] followed by a 4-AFC pairwise preference protocol. The emotional states, E, examined comprisefun, challenge, boredom, frustration, excitement, anxietyand relaxation. The selection of these seven states is based on their relevance to computer game-playing and player experience.
3.5 Case Study Dissimilarities
The main dissimilarities between the two case studies are that in Playware 1) subjects are children (aged: 8 to 10), 2) a pen-and-paper (instead of a digital) questionnaire is used, 3) a rather broad ordinal scale from 1 to 10 is used for the rating scheme, 4) 2-AFC (instead of 4-2-AFC) is used for the preference scheme; 5) and subjects are asked only one question, about fun. Cognitive load during the reporting phase in the Playware experiment appears less due to the presence of only one question. Moreover, the broad rating scale used may allow for a better approximation of the level of reported fun.
Comparison of findings across the two case studies is not appropriate given the large number of dissimilarities in terms of gameplay interaction and experimental protocol. However, collectively, they provide two related but different studies of post-experience reporting in games and their analysis assists the understanding of the interplay between reported preferences and rating across different schemes.
4
Results and analysis
This section presents the results of the statistical analysis for testing our hypotheses in the two case studies. First, the statistics employed to test our research hypotheses H1 and H2 are outlined below.
4.1 H1 test statistic
To measure the degree of agreement between the rating and preference self-reports we calculate the correlation coefficients between them, obtained usingc(z) =PN
i=1{zi/N} following the statistical analysis procedure for pairwise preference data introduced in [15].N is the total number of incidents to correlate, andzi = +1, if rating reports match preference reports andzi=−1, if rating and preference reports are mismatched in the game pairi. In the calculation ofc(z)we only take into accountclearpreferences and ratings of participants. That is, we only consider game pairs in which both a clear preference (i.e.AB orA ≺B; 2-AFC) and a clear rating (i.e.A > B orA < B) are expressed. The p-values ofc(z)are obtained via the binomial distribution.
4.2 H2 test statistics
To measure whether the order of play affects the player’s judgement of rating or pair-wise preference for affective states, we follow the order testing procedure described in [15], based on the number of times that the subject prefers the first (primacy effect) or the second (recency effect) game in both pairs. Briefly, the order test statistic is calcu-lated asro = (K−J)/N, where the subject prefers (either via rating or preference) the first session in both pairsKtimes and, the second session in both pairsJtimes. The greater the absolute value ofrothe more the order of play tends to affect the subjects’ judgement of interest.rois trinomially-distributed under the null hypothesis..
In addition to thero value we calculate therc = (K+J)/Ntest statistic, which yields a measure of reporting consistency with respect to order. The obtainedrcvalue
lies between 0 (reporting is consistent) and 1 (reporting is inconsistent) and is binomially-distributed with mean 0.5 under the null hypothesis.
The order effects are calculated solely on clear preferences (i.e. when AB or A≺B) and ratings (i.e. when A>B or A<B) in both pairs played in both orders. The significance level used in this paper is 5%.
4.3 Playware
The total number of game pairs with valid reported data is 105 in the Playware experi-ment. To calculate the statistics we exclude the 35 game pairs in which an equal rating is reported. The correlation between reported rating and preferencec(z) = 0.857(p-value = 4.002·10−10) indicates a statistically significant effect and rules out H1.
Order Effect Analysis Statistical analysis of the subjects’ answers shows that no sig-nificant order effect occurs (ro =−0.102, p-value= 0.224) when preferences are re-ported, which rules out hypothesis H2. However, a significant effect of playing order on rating reports is found (ro =−0.3809, p-value= 0.0097) which indicates a tendency to consistently rate the second game higher. The insignificant order effect for reported preferences, in part, demonstrates that effects such as a subject’s possible preference for the very first game played and the interplay between reported fun and familiarity with the game are statistically insignificant. On the other hand, the significant order effect for reported rating suggests that the order of play influences reporting when the rating scheme is used.
Thercvalues for rating and preferences are 0.476 (p-value= 0.124) and 0.338 (p-value= 0.009), respectively, suggesting that only the preference reports appear to be consistent with respect to order.
Analysis & Conclusions The first case study provides indications of inconsistency between rating and preference reports. While the two are statistically correlated (c(z) = 0.857) there are several instances (16.6% of the data samples) in which preferences do not agree with their corresponding rating.
The inconsistency between the two report schemes may have occurred for a num-ber of reasons including self-deception, cognitive load, question understanding in small children etc. A first analysis of the effect of order of game interaction shows that sig-nificant order effects exist only in reported ratings which in turn suggests existence of randomness when expressing rating choices for the game sessions attempted. More-over, the consistency of reports with respect to order,rc, appears to be significant for the preference reports only.
4.4 Maze-Ball
For the Maze-Ball case study we follow the same statistical analysis presented above for the Playware game. The total number of valid game pairs examined in the Maze-Ball survey is 56 and the matching correlation (c(z)) values between rating and preference reports for the Maze-Ball test-bed are depicted in Table 1.
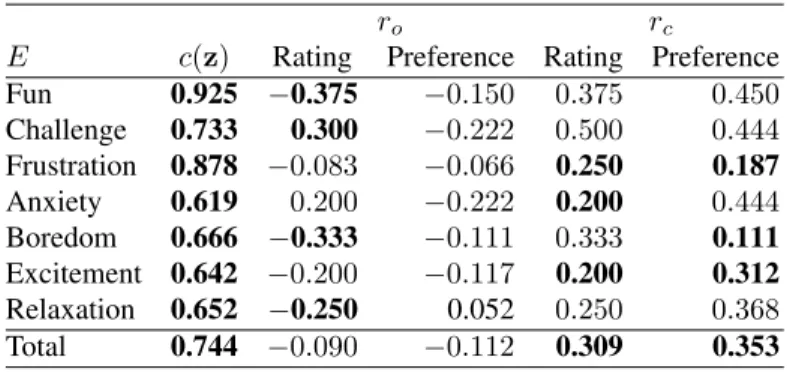
Table 1.Maze-ball: Correlation coefficient values (c(z)) between rating and clear preferences (2-AFC), and order of play (ro) and consistency (rc) correlation coefficients for all investigated emotional statesE. Significant effects appear in bold.
ro rc
E c(z) Rating Preference Rating Preference
Fun 0.925 −0.375 −0.150 0.375 0.450 Challenge 0.733 0.300 −0.222 0.500 0.444 Frustration 0.878 −0.083 −0.066 0.250 0.187 Anxiety 0.619 0.200 −0.222 0.200 0.444 Boredom 0.666 −0.333 −0.111 0.333 0.111 Excitement 0.642 −0.200 −0.117 0.200 0.312 Relaxation 0.652 −0.250 0.052 0.250 0.368 Total 0.744 −0.090 −0.112 0.309 0.353
It appears there is a varying degree of consistency between rating and preference reports depending on the affective state (question asked). Overall 2-AFC preference reports appear to be consistent with rating reports. For the fun, frustration and challenge reports the two schemes are highly correlated (correlation higher than 0.7) whereas for the other four questionnaire items the correlation lies within the 0.6-0.7 interval; however, in all seven affective state questionnaire items, the correlation is statistically significant ruling out H1. These effects might be linked to the order of question items appearing in the questionnaire which is equivalent to the order the emotional states that appear in Table 1; the questions about excitement and relaxation, for instance, were the last two items in both questionnaires.
Order Effect Analysis The statistical analysis presented in Table 1 shows that order of play does not affect the pairwise preferences of users. The insignificant order effects also, in part, demonstrate that effects such as a user’s possible preference for the very first game played and the interplay between reported emotions and familiarity with the game are statistically insignificant. Even though not statistically significant, the correla-tion statistic values of Table 1 reveal a preference for the second game played for most questionnaire items (negative correlation values).
The H2 hypothesis is ruled-out: no effect exists in any preference questionnaire item while significant effects are observed in the fun, challenge, boredom and relaxation rating questions. These effects may, in part, explain the lowc(z)values in boredom and relaxation but also be responsible for the level of inconsistency in fun and challenge. In general it appears that — excluding the anxiety state —c(z)values (significant or not) are larger in the rating scheme than in the preference questionnaire scheme. The total order effect is not significant for either questionnaire scheme, which does not allow any safe conclusions to be drawn when all questionnaire items are considered.
Thercvalues in Table 1 demonstrate that both questionnaire schemes are consistent in frustration and excitement and no additional conclusions can be drawn for these two states. On the other hand, it appears as if the inconsistencies of anxiety preferences have
an impact on the lowc(z)value of that state given that thercvalues are not significant. The order statistics computed including the equal preference (3-AFC) could provide a clearer picture of the relationship between order effects and questionnaire scheme inconsistencies and are left for future analysis due to space considerations.
Analysis & Conclusions The statistical analysis for the Maze-Ball case study revealed two main effects: consistency (of varying degree) between rating and preference reports in all 2-AFC questionnaire items and significant order effects for the rating scheme.
Results related to the first effect suggest that even though for some question items (e.g. fun, frustration and challenge) the consistency is higher than others (e.g. anxi-ety, relaxation and boredom), the hypothesis H1 is ruled out for all emotional states in Maze-Ball. Nevertheless, as in Playware, there are questionnaire items for which the agreement between rating and preferences is far from exact (i.e.c(z) = 1.0). For in-stance, correlation values between 0.6 and 0.7, observed in four out of seven question items of the Maze-ball questionnaire, are significant yet raise questions for the several mismatch instances present in the reports.
The second effect suggests that hypothesis H2 is ruled out. The analysis of order of reporting shows, in general, higher order test statistic values in rating than in preferences and significant order effects in four emotional states when reported via a rating scheme. Both indicate a potential higher degree of randomness reporting with rating schemes for that case study.
Finally, note that the consistency of preferences indicated by thercstatistic is more often significant for the 2-AFC answers derived from 4-AFC protocol, which is to be expected since 4-AFC explicitly accounts for cases of non-preference.
5
Discussion
This initial set of game case studies and the results obtained raise several questions with respect to the relationship between rating and preference self-reports and the particular game survey studies used to test our hypothesis. While a comparison between the two studies is not appropriate given their large set of dissimilarities, an initial analysis across both test cases will assist the design of additional user survey studies that could shed more light to self-reporting effects.
Most significant is the observation that while direct and derived preferences are gen-erally well-correlated, mismatches occur rather frequently and rating questionnaires appear more susceptible to order-of-play effects than preference questionnaires. It is, therefore, interesting to askwhy reported preferences and ratings do not match exactly? The two studies presented in this paper link the reporting order effect and the existence of randomness in reporting with the inconsistency between the two self-report schemes. The effect of play order is present in most user states examined. Unsurprisingly, these effects vary across different studies, questionnaire schemes and affective states. In both studies there is a general trend of preference for the second game played (recency or-der effect) with significant effects appearing only in the rating scheme. Moreover, the statistic measuring the degree of rating consistency suggests that randomness existent
in rating reports appears to be a critical factor for the inconsistency between the two re-porting schemes. Preliminary results of a fairer calculation of thercvalues — including the equal option of preference and allowing for the equality of rating reports — show that consistency is significant only in the preference scheme, which suggests a benefit of preferences for accurate subjective affective reporting and annotation.
A number of other points are worth noting; a study taking account of all of them exceeds the scope of the present paper, but the results reported here suggest that such a study may be worthwhile.
The experimental protocol favors expressed rating score.Rating questions were asked twice as often as preference questions were asked. Thus, subjects are expected to be familiar with the structure of the rating scheme more than the preference scheme. The preference scheme is arguably simpler for the respondent, but requires increased short-term memory since at least two — instead of one in the rating scheme — interaction sessions are necessary for comparison. Moreover, the rating scheme question comes first, straight after the experience, followed by the preference scheme. One would, there-fore, expect that cognitive and short-term memory load and furthermore questionnaire completion times would be higher when preferences are reported. However, prelimi-nary results from current game survey studies suggest that the time taken to complete a rating questionnaire is significantly higher than a preference questionnaire.
Questionnaire usability.Clearly, usability does not affect the results between the two report schemes since the interaction is the same for both: pen-n-paper in Playware, digital bullet-form questionnaire in Maze-Ball.
Amount of perceived information. The amount of information provided through the questionnaire is quite unlikely to have an effect on the findings. All questions, pref-erence or rating, are asked in a similar fashion with very small diffpref-erences — e.g. “I felt challenged” (rating) vs. “I felt more challenged in:” (preferences). The rating schemes used, however, have more available choice options than the preference schemes. For Playware, the options were 2 for preference and 20 for rating. On the other end, rating and preferences have 5 and 4 options, respectively, for Maze-Ball. The thermometer-like rating scheme of Playware appears to generate higher consistencies between prefer-ences and rating but those consistencies are not apparent in all user expressed states of the Maze-Ball study. The thermometer type of rating questionnaire and the 5-option game experience questionnaire (GEQ) [8] are used for their popularity in user and player experience research. A dedicated control experiment is required to explore the impact of the number of options of the questionnaire schemes on the consistency be-tween expressed rating and preference. Four or three-option rating questionnaires could possibly lead to reduced cognitive load of users and higher consistencies.
Self-report limitations.Well known limitations of self-reporting such as self-deception, high intrusiveness and learnability effects are applicable to both questionnaire schemes and, thereby, do not seem to have a particular impact on the comparison. While there is no clear way to identify such effects, controlling the order of games and questionnaire sessions, as proposed, alleviates in part such effects inherent in naive questionnaires. Other multimodal input sources, including biofeedback and additional context-based game metrics, could be used for further analysis but do not supplant the self-reports.
Acknowledgments
The authors would like to thank all subjects that participated in the experiments. Special thanks also goes to H´ector P. Mart´ınez for his help in conducting the Maze-Ball user survey experiment. The research was supported, in part, by the FP7 ICT project SIREN (project no: 258453).
References
1. Agresti, A.: Analysis of ordinal paired comparison data. Journal of the Royal Statistical Society. Series C (Applied Statistics) 41(2), 287–297 (1992)
2. Chan, J.C.: Response-order effects in Likert-type scales. Educational and Psychological Measurement 51(3), 531–540 (1991)
3. Cohen, J.: A coefficient of agreement for nominal scales. Educational and Psychological Measurement 20, 37–46 (1960)
4. Cronbach, J.L.: Coefficient alpha and the internal structure of tests. Psychometrika 16(3), 297–334 (1951)
5. Likert, R.: A technique for the measurement of attitudes. Archives of Psychology 140, 1–55 (1932)
6. Linn, R., Gronlund, N.: Measurement and assessment in teaching. Prentice-Hall (2000) 7. Lund, H.H., Klitbo, T., Jessen, C.: Playware technology for physically activating play.
Artif-ical Life and Robotics Journal 9(4), 165–174 (2005)
8. Poels, K., IJsselsteijn, W.: Development and validation of the game experience questionnaire. In: FUGA Workshop mini-symposium. Helsinki, Finland (2008)
9. Read, J., MacFarlane, S., Cassey, C.: Endurability, engagement and expectations. In: Pro-ceedings of International Conference for Interaction Design and Children (2002)
10. Scheffe, H.: An analysis of variance for paired comparisons. Journal of the American Statis-tical Association 47(259), 381–400 (1952)
11. Stevens, S.S.: On the Theory of Scales of Measurement. Science 103(2684), 677–680 (1946) 12. Tognetti, S., Garbarino, M., Bonarini, A., Matteucci, M.: Modeling enjoyment preference from physiological responses in a car racing game. In: Proceedings of the IEEE Conference on Computational Intelligence and Games. pp. 321–328. Copenhagen, Denmark (18–21 Au-gust 2010)
13. Viswanathan, M.: Measurement of individual differences in preference for numerical infor-mation. Journal of Applied Psychology 78(5), 741–752
14. Yannakakis, G.N.: Preference Learning for Affective Modeling. In: Proceedings of the Int. Conf. on Affective Computing and Intelligent Interaction. pp. 126–131. IEEE, Amsterdam, The Netherlands (September 2009)
15. Yannakakis, G.N., Hallam, J.: Towards Optimizing Entertainment in Computer Games. Ap-plied Artificial Intelligence 21, 933–971 (2007)
16. Yannakakis, G.N., Hallam, J., Lund, H.H.: Entertainment Capture through Heart Rate Activ-ity in Physical Interactive Playgrounds. User Modeling and User-Adapted Interaction, Spe-cial Issue: Affective Modeling and Adaptation 18(1-2), 207–243 (February 2008)
17. Yannakakis, G.N., Maragoudakis, M., Hallam, J.: Preference Learning for Cognitive Model-ing: A Case Study on Entertainment Preferences. IEEE Systems, Man and Cybernetics; Part A: Systems and Humans 39(6), 1165–1175 (November 2009)
18. Yannakakis, G.N., Mart´ınez, H.P., Jhala, A.: Towards Affective Camera Control in Games. User Modeling and User-Adapted Interaction 20(4), 313–340 (2010)