INFORMATION SYSTEMS IN
MANAGEMENT Information Systems in Management (2016) Vol. 5 (3) 413−423
THE CONCEPT OF BUSINESS INTELLIGENCE IN THE MICROSOFT SQL SERVER ENVIRONMENT
MAGDALENA SZMAJDUCH
Department of Computer Science, Cracow University of Technology (CUT), Poland
Application of supporting business-related decision making processes through the use of information systems is becoming one of the fundamental requirements of the market competition. In this paper we present a survey of Business Intelligence (BI) models which can be implemented in Microsoft SQL Server environment. The survey is a response to the rapid development of BI solutions as they enter new areas of company’s activities, adopting new technologies. Business Intelligence systems have become an integral part of every major company. The aim of this analysis is to present the Microsoft SQL Server capabilities, functionalities and services dedicated for the BI purposes. The overview is provided with simple comprehensive analysis of selected environment components indicating their relevance to the particular company requirements. The summary of the significance of using Microsoft SQL Server software is the review of selected services.
Keywords: Business Intelligence, E-business, Data Mining, Data Warehouse, Analytical Processing
1. Introduction
The massive and continuous increase of the amount and variety of data which is available online can be observed day by day. The significant changes are taking place in the processes of creating, saving and storing data, documents, files etc. In the same time, various types of highly distributed users are generating thousands of terabytes of extra data of different types by mobile devices, social portals,
cameras and many others. All those information have to be then safely stored with the fast, easy and secured access. Such data growth and requirements has led to one of the most challenging research issues of the recent years and become one of the biggest problems of today’s companies and organizations. Even assuming that the concerns are able to collect data from all channels and clients, technological layers and business processes, they do not know how to transform that precious information into actionable strategies [10]. Companies hire many specialists and analysts whose role is to support making aware business decisions. Based on the stored data the specialists help to answer many business questions for example: how many products were sold in n-specific cities/countries last month as opposed to the same month last year. Find the top/bottom distributors, vendors, customers, partners, or clients etc. Answering those kinds of questions would be very hard if not the special, dedicated analytics tools.
To simplify this kind of analysis the Microsoft SQL Server 2014 offers a number of brilliant solutions and services [2]. Microsoft’s technology helps to organize huge business databases and supports Business Intelligence [4]. With the 2014 release some breakthrough solutions are introduced, such as in-memory tables, which help companies deal with the mountains of data. Through the years SQL Server has grown and changed a lot, but at its core, it is still a reliable and hardened technology which forms the foundation of Microsoft’s BI platform.
The Business Intelligence concept is presented in the following section. Then the short analysis of the three, selected Microsoft’s services is described in section 3. The analysis of the services is provided together with the description of the technology they use. The last, fourth section concludes the conducted analysis.
2. Business Intelligence
"Business Intelligence (BI)" [11] can be used for definition of intelligent future generation technologies, applications and implementations for the collection, presentation of business information, analysis and integration [6]. The main aim of BI is a support of the business-related decision making processes - fundamentally BI systems are data-driven Decision Support Systems (DDS) [12].
BI services, technologies and models became recently important, popular and useful in the whole wide business sector. Creating eye-catching visualizations, graphs and tables is much easier and faster for companies than spending many hours working on difficult and limited Office documents. Another benefit of using BI technologies is that it continuously develops in order to cover more intuitive and interactive data. According to [5] "By 2015, 'smart data discovery', which includes
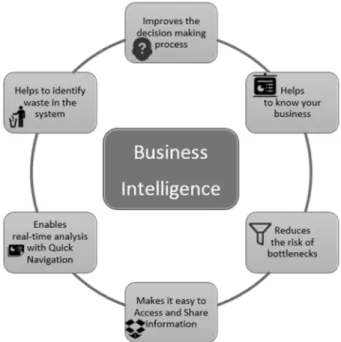
natural-language query, automated, prescriptive advanced analytics and interactive data discovery capabilities, will be the most in-demand BI platform user experience paradigm, enabling mainstream business consumers to get insights (such as clusters, predictions, outliers and anomalies) from data". Simple characteristics of fundamental BI functionalities are presented in Fig. 1.
Figure 1. Business Intelligence Concept
Types of Business Intelligence Software
The main aim of the Business Intelligence solutions is to grasp the most valuable remarks, based on the measurable data received from the data source, in order to improve the decision making process. Usually, the best solutions, gather the data from the whole company, and provide them to the users in the form of pre-defined reports and analysis. Different patterns have their own designed characteristics including visualizations, statistics, predictive analysis, data mining and data warehousing [9]. In the term of BI the following three primary models are considered:
1. ETL (Extract, Transform and Load)
2. Data Warehouses
The first feature, apparently simple ETL, comes with some extraordinary set of attributes, e.g. it loads transformed data which derivers from different sources (SAP, Microsoft, Oracle etc) to the warehouse, so it can be referenced in the future. Nowadays, the extracting process can take place from many sources including CRM and ERP systems as a conjunction process. Finally, the valuable data is transformed in formats that are coherent with some different data. When concerning Data Warehouses (DW) things become more complicated, as the warehouse duty is to drag out data from many, various sources, which are ERP and CRM systems along with the supply chain management. Special design of DW enables to complete complex analysis processes. The primary difference between DW and operating systems (OS), which role is to support day-to-day activities, is that they manage enormous volumes of features and transactions. The user should be aware that the OS has very limited capabilities and usually does not have all the data required to perform its operations. The main idea of creating DW was to handle huge volumes of data processing. Usually they are built on the Relational Database Management Systems (RDBMS) or some specific platforms.
The importance of OnLine Analytical Processing (OLAP) is at the same level as the ETL, however both refer to radically different processes [3]. OLAP focuses on data visualizations, diagrams and tables, but also come with in-depth functions like schemas or cubes, which represent data. Moreover, with no doubts, cubes are the most important parts of the whole system, which offer infinite combinations. They are able to process complex queries and still perform well, providing fast responses.
3. Microsoft SQL Server 2014
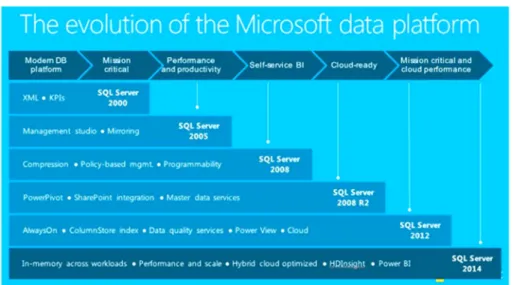
Microsoft SQL Server was first released in 1989 as SQL Server 1.0, and served as Microsoft’s entry to the business-level database market, competing against the leaders such as Oracle or IBM. Through the next decade it developed and in 1999 released version 7.0 which already supported OLAP solutions. Besides the commercial licenses, Microsoft provides also a free edition copy, which can be developed for any purposes (including commercial). However, those free releases have some restrictions and for example up to version 2000 (8.0) the graphical tools for the database management were not available and there was a limit number of the connections to the database. Since version 2005 (9.0) the constraints changed dramatically, and the free copy can be downloaded with user-friendly graphic interface with no connection limits, but SQL Agent service is no longer available and the effectiveness of the SQL server itself is limited, by reduction the RAM usage. The development process of MS SQL Server is presented in Fig. 2.
Figure 2. Microsoft SQL Server Evalution Process Source: http://www.datanami.com/
The data management and analysis technologies included in the Microsoft SQL Server 2014 environment are best presented in Fig 3. Comprehensive and enterprise-scale analytic solutions can be created with great variety of different functionalities provided by individual service.
Figure 3. Microsoft SQL Server 2014 components Source: https://technet.microsoft.com/
The three, featured services, described in this paper are Analysis Services, Reporting Services and Integration Services. Those services are dedicated Business Intelligence tools, designed to scale the BI models, enrich and help secure the companies data, and ensure quality and accuracy.
3.1. Microsoft Analysis Services
Microsoft SQL Server Analysis Services (SSAS) [8] were designed to provide and ensure unique effectiveness and scalability to support applications, which operate over millions of data records and which are used by thousands of users. This innovative, consolidated tools help to improve programmer’s performance and results in better projects and shorter implementation time. A standard Analysis Services lifecycle consists of creating an OLAP or tabular data model, deploying the model as a database to an Analysis Services instance, processing the database to load the data in, and setting the permissions to enable data access. Finally, this multi-purpose data model is open for any client applications, which support Analysis Services as the data source. There are two individual approaches in Analysis Services for data modeling, namely Tabular and Multidimensional and Data Mining. As they have a lot in common, there are also significant differences which former moves and decisions will depend on. Both modes are described in details in following sections of this paper.
3.1.1. Multidimensional model
When installing the Microsoft SQL Server Analysis the Multidimensional instance [13] is the default server mode. This approach is based on the concept of OLAP (OnLine Analytical Processing) modeling (e.q. cubes and dimensions) for analyzing business data in many dimensions and it includes a query and calculation engine to balance performance with scalable data requirements. Furthermore, achieving good performance of ad hoc queries against business data is the main reason for choosing Multidimensional model. Cubes are created to support fast response times and to ensure a single data source for business reporting. Considering the growing importance of business intelligence at all levels of an organization, having a single source of analytical data ensures that divergences are reduced to a minimum, if not eliminated entirely. Analysis Services Multidimensional databases can be easily integrated with Reporting Services reports, Excel Sheets or any other BI applications supplied by Microsoft and third-party apps.
3.1.2. Tabular model
The second mode in which SSAS can be build up is called Tabular, and is based on relational modeling concepts like tables and relationships for data modeling. Tabular approach uses the in-memory database model [7] which idea is to store the data that used to be stored on disk in the memory. Such solution is both memory-optimized and free of the traditional bottlenecks from locks and latches that traditional databases used to manage concurrent activity. Applying into Tabular model the innovative compression algorithms and multi-threaded query
processor, the xVelocity in-memory analytics engine provides quick access to the model objects and data from client reporting solutions and applications e.g. Microsoft Excel. The model supports two data access modes namely Cached mode and DirectQuery mode. The first allows user to integrate data from various sources including relational databases and flat text files. DirectQuery mode permits client applications to direct queries at the (SQL Server relational) source, by omitting the in-memory model.
3.1.3. Multidimensional vs. Tabular
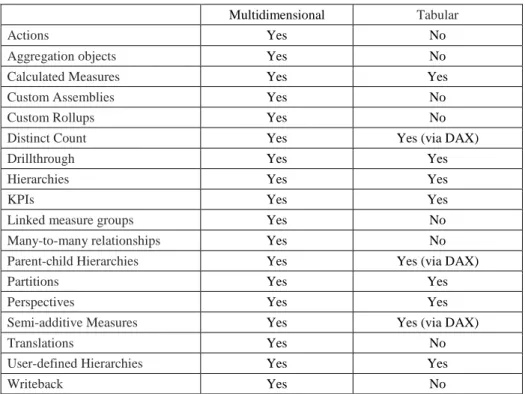
Both, Tabular and Multidimensional approaches provide high performance analytic databases which can be simply integrated with Reporting Services reports, Excel Sheets or any other BI applications supplied by Microsoft and third-party apps [14]. To put it straight the solutions differ in the way they are created, used and deployed but the final result is the same for both and it is a standalone database which can be integrated in any client application supporting Analysis Services. The more detailed summary of feature availability at the model level is presented in table 1. This short features comparison best shows the capabilities of the server modes.
Table 1. Microsoft SQL Server 2014 features
Multidimensional Tabular
Actions Yes No
Aggregation objects Yes No
Calculated Measures Yes Yes
Custom Assemblies Yes No
Custom Rollups Yes No
Distinct Count Yes Yes (via DAX)
Drillthrough Yes Yes
Hierarchies Yes Yes
KPIs Yes Yes
Linked measure groups Yes No
Many-to-many relationships Yes No
Parent-child Hierarchies Yes Yes (via DAX)
Partitions Yes Yes
Perspectives Yes Yes
Semi-additive Measures Yes Yes (via DAX)
Translations Yes No
User-defined Hierarchies Yes Yes
3.2 Microsoft Reporting Services
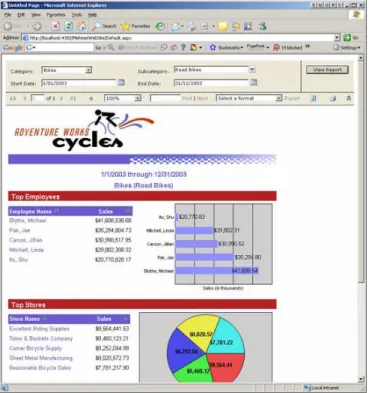
Other Business Intelligence solution provided in Microsoft SQL Server is SQL Server Reporting Services (SSRS) [15]. The service enables users to transmit accurately chosen and modeled data to business teams in reports and dashboards. It can be either a simple diagram send by email every day or very complex real-time dashboard embedded in a SharePoint webpage. SSRS comes with great variety of ready-to-use tools and services to create, develop, and manage reports in the companies. Moreover, it includes APIs which enable developers to integrate or expand data and report processing in client applications. The service is a server-based reporting platform completely integrated with SQL Server tools and other services. Reporting Services tools also work within Microsoft Visual Studio programming platform. The sample report created with SSRS is presented in Fig 4.
Figure 4. Sample SQL Server Reporting Services report
Reporting Services allow creating all kind of reports (including tabular, graphical, interactive etc.) from all types of data sources such as multidimensional, relational or XML files. Furthermore, many different extra components, such as maps, charts and diagrams, can be included in the reports as well. Finally, prepared report can be then published, accessed on-demand or schedule in report processing.
There is also a wide range of viewing and exporting formats e.g. through a Web-based or desktop application, SharePoint site or simply export to Microsoft Excel file. An additional benefit of SSRS is consolidated management through SharePoint Central Administration, which enables reporting capabilities for all employees that operate on data through a single point of administration.
3.3. Microsoft Integration Services
Microsoft’s SQL Server Integration Services (SSIS) role is to handle the task of getting data into and out of almost any data store in organization, including flat files, SQL databases, and even webservices and legacy midframes. SSIS is a platform for building enterprise-level data integration and data transformation solutions [1]. The main task of the service is to deal with complicated business problems by making copies or downloading files, sending proper messages as the answer to specific events, modifying data warehouses, cleaning and mining data, and managing SQL Server components and data. The service can work in stand-alone instance or together with other packages depending on the business requirements. It includes a wide variety of built-in tasks and transformations, tools for creating packages and a service responsible for running and managing packages. SSIS enable extracting and transforming data from many different sources like XML and flat files, relational data bases, and then loading the data to desired destinations. For those who are not familiar with programming Integration Services offer graphical tools for creating solutions without writing a single line of code. Of course, there is also something for more advanced users that enables to program extensive object model to create packages programmatically.
4. Conclusions
The paper characterized the key functionalities of the services and tools provided in Microsoft SQL Server 2014 to help to identify the potential users. Of course the probable usage of the described services will vary on the need and requirements of particular business. With so many products to choose from, it is essential to begin with a solid grasp of the team’s needs and then make a research to select the software that meets them.
Each of the services from the MS SQL Server package has some worth mentioning features. SSRS leverages the underlying SQL and SSAS layers to enable analysts to write reports without becoming technical experts. The service allows creating high precision, ideal operational reports for organizations and embedding them in enterprise applications. Then, the SSIS is maybe not the most smashing member of the package, but it is crucial for moving data from one point to another.
As there is a strong competition in the database providers market, Microsoft decided to follow the three, main targets to stay in the business. The first one is to keep the current customers and prospect and provide them the easiest possible migration path. The second, wider target is a client who intends to build larger-scale system-of-record than it was possible with Microsoft solutions until now and in the same time to keep the development and administrative processes and the system management technology. The last group is those who are creating systems and applications for the Internet of Things. These customers demand a single all-purpose vendor to build, test and support a complete data platform based on a solid technology which is well known in the enterprise.
Microsoft SQL Server 2014 provides 30 times faster transaction processing by enhancing the in-memory performance and enables creating great business analysis with 100 times faster querying and data compression than the disk-based relational databases. It is also possible to process millions of rows of data analyzed per second what allows real-time analysis. Although there are lots of advantages of the SQL Server package it is not the answer to every need. As it is hardened and developed technology it is not designed to handle the volume, velocity and variety of data required by the largest online services like Facebook or Google. Microsoft is heading in the direction of similar but perhaps smaller systems as well as supporting the demands of the Internet of Things.
Ackoledgement
Magdalena Szmajduch’s research presented in the paper was supported by the Polish Ministry of Science and Higher Education through the Faculty of Physics, Mathematics and Computer Science (Cracow University of Technology), grant no. F3/601/2015/DS-M.
REFERENCES
[1] B. Knight, D. Knight, J.M. Moss, M. Davis, C. Rock: Professional Microsoft SQL Server 2014 Integration Services, John Wiley & Sons, Inc. , 2014
[2] R.Mistry, Introducing Microsoft SQL Server 2014 Technical Overview, Microsoft Press, 2014
[3] http://searchdatamanagement.techtarget.com/definition/OLAP
[4] Luhn H.P. (1959) A Business Intelligence System, IBM Journal, 10/1958, 32-48. [5] http://www.gartner.com/technology/home.jsp
[6] http://olap.com/learn-bi-olap/olap-bi-definitions/business-intelligence/
[7] http://research.gigaom.com/report/bringing-in-memory-transaction-processing-to-the-masses-an-analysis-of-microsoft-sql-server-2014-in-memory-oltp/
[8] https://technet.microsoft.com/pl-pl/library/microsoft-sql-server-przeglad-uslug-analysis-services.aspx [9] http://www.business2community.com/business-intelligence/gain-competitive-edge-business-intelligence-software-analytics-01280045 [10] http://www.comarch.pl/files-pl/file_165/Comarch-Odkrywaj-wiedze-z-danych-PL.PDF [11] http://www.informationbuilders.com/business-intelligence
[12] F. Burstein, C. Holsapple: Handbook on Decision Support Systems 1, Springer, 2008
[13] C. Webb, A. Ferrari, M.Russo: Expert Cube Development with SSAS Multidimensional Models, Packt Publishing, 2014
[14] http://www.codemag.com/article/1308091
[15] A.Jorgensen, B.Ball, S.Wort, R. LoForte, B.Knight: Professional Microsoft SQL Server 2014 Administration, John Wiley & Sons, Inc. , 2014