ISSN(E): 2321-8843; ISSN(P): 2347-4599 Vol. 2, Issue 5, May 2014, 199-206 © Impact Journals
PREDICTION AND ANALYSIS OF ECG SIGNAL BEHAVIOR USING
SOFT COMPUTING
NEERAJKUMAR S SATHAWANE1 & PRAVIN KSHIRSAGAR2
1Student, S. B. J. I. T. M. R, R. T. M. Nagpur University, Nagpur, Maharashtra, India 2
Assistant Professor, M.Tech Co-Ordinator, S. B. J. I. T. M. R, R. T. M. N. U, Nagpur, Maharashtra, India
ABSTRACT
The main cause of human death is cardiovascular disease (CVD) in today’s world. In order to combat and
diagnose this disease, many professionals are using mobile electrocardiogram (ECG) in remote monitoring system. ECG Feature Extraction plays a significant role in diagnosing most of the cardiac diseases. Here comprehensive review has
been made for feature extraction of ECG signal analyzing, feature extracting and then classifying it have been proposed during the past time, and here we introduced Artificial Neural Network (ANN).
To know the present condition of the heart Electrocardiography and is an important tool but it is a time consuming process to analyze a continuous ECG signal as it may contain thousands of continuous heart beats. Here we convert analog signal to digital one and then reverse of it, it helps in accurately diagnosing the signal. Also this paper presents a detection of some heart arrhythmias using Matlab is done. Hence we input ECG signals to the neural network, these signals are processed by ANN and we diagnose heart arrhythmias correctly. Most important thing in analysis of ECG signals is its fundamental features like amplitudes and intervals are required which determine the functioning of heart. Results shown here are explaining the diagnosis and classification of diseases.
KEYWORDS: ECG Signal, Artificial Neural Network
INTRODUCTION
A periodic signal generated by Electrocardiogram (ECG) that reflects the activity of the heart. Abundant information on the normal and pathological physiology of heart can be obtained from ECG. The ECG signals are continuous in nature therefore it is very difficult to visually analyze them. Thus the need is there for computer based methods that is MATLAB tool for ECG signal Analysis we used here. The electrical activity is transmitted throughout the
body and can be picked up on the skin which is the principle behind the ECG. An ECG machine records this activity via electrodes on the skin and displays it graphically. An ECG involves attaching 8-12 electrical cables to the body: One to each limb and six across the chest. ECG is a wave that represents an electrical event in the heart such as atria
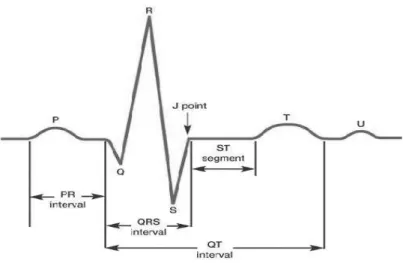
depolarization, ventricular depolarization, atria re-polarization, ventricular re-polarization. The signal consists of a series of repetitive complex waveforms with a frequency of approximately 1 Hz. One cardiac cycle in an ECG signal consists of the P-QRS-T wave which is called P-QRS-T complex.
Conventional methods of monitoring and diagnosing electrocardiographic changes rely on detecting the presence of particular signal features by a human observer [5]. QRS complex is the most prominent feature in electrocardiogram because of its shape and abundant information it carries therefore it is taken as a reference in ECG feature extraction.
Medical diagnosis using Computer systems (here MATLAB tool) have been developed in order to assist medical professionals in the analysis of large volumes of patient data. Transforming the mostly qualitative diagnostic criteria into a more objective quantitative signal feature classification problem [5] this technique is used here.
Figure 1: ECG Signal Showing P-QRS-T Wave
QRS complex is the most prominent of all features in electrocardiogram because of its shape; therefore it is taken as a reference in ECG feature extraction. Medical diagnosis using Computer systems have been developed in order to assist
medical professionals in the analysis of large volumes of patient data which can be extracted from ECG machine. Such techniques work by transforming the mostly qualitative diagnostic criteria into a more objective quantitative signal
feature classification problem [5]. The techniques have been used to deal with this problem such as the analysis of ECG
signals for detection of electrocardiographic changes using the autocorrelation function, frequency domain features, time-frequency analysis, and wavelet transform.
Some methods consist of series of band pass filters having frequency range of QRS complexes but these methods have limited accuracy in analyzing ECG features in presence of high frequency noise as well as the ECG signal affected by severe base line drift [5] which needs to be overcomed. Various techniques proposed earlier in literature for extracting the
features from ECG is analyzed this paper discusses and a review has been made to find out the best among them with less computational complexity and more accuracy in prediction and feature extraction using soft computing.
SYSTEM MODEL DESIGN
ECG Analysis for DiagnosisFeature extraction method of signals using wavelet transform where it transform analog signal to digital one and classification using support vector machines was first proposed in [4]. Following steps were performed. Firstly preprocess the input data then extracted the features of the signals and lastly classification of ECG signals.
Two methods were applied together to extract the features which gives the feature vector of ECG data set. To extract the coefficients of the transform as the features of each ECG segment wavelet transform is used. Concurrently, autoregressive modeling (AR) is also applied to get hold of the temporal structures of ECG waveforms. Then finally the support vector machine (SVM) with Gaussian kernel is used to classify different ECG signal heart rhythm. The results of computer simulations reached the overall accuracy of about 99.50%.
Figure 2: Cardiac Depolarization Root [3]
The cardiac depolarization rout has been shown in figure 2. The wave of depolarization then proceeds rapidly to the bundle of His where it splits into two pathways and travels along the right and left bundle branches [6]. The impulse travels the length of the bundles along the interventricular septum to the base of the heart and this is the place where the bundles divide into the Purkinje system [6]. The wave of depolarization is then distributed to the ventricular walls and initiates ventricular contraction. The first step in extracting ECG features starts from the accurate detection of R peaks in the QRS complex.
A robust R wave detector of ECG signal using the wavelets was developed [5] by Awadesh and Manabendra. The database has been collected from MIT-BIH arrhythmia database and the signals from Lead-II have been analyzed further. The selection of detail coefficient d4 has been done (as it is easy to implement) based on the following important parameters i.e.
• Total energy content of the signals
• Actual Frequency of the signals and
• Lastly Cross-correlation analysis
of decomposition structure of ECG signal. Hundred records were tested for R peaks. The overall of detection using Daubechies (db6) and Symlets (sym11) family of wavelets are 96.55% and 83.37% respectively, which are up to the mark. The importance of using wavelet transform helps in removing noise contained of the signals at each level of filtering
so the requirement of any preprocessing further is not needed. This ensures the usefulness of the method mentioned. Then it is done using different records of the database with noise present in it. The results with db6 are best by varying
threshold than sym11 which picks up false peaks (missed peaks) [7].
The summation of the values from these segments provided the feature vectors of single cycles. This algorithm was tested on two ECG signals, the first was taken from the MIT biomedical database was decomposed into four levels and de-noised by the optimal wavelet “sym4” with global threshold value 1.3073. This ECG signal was with local abnormal heartbeat activity [8]. The second ECG signal was recorded from a patient during an epileptic seizure. The optimal wavelet function was wavelet Coiflet5 “coif5” with global threshold 23.217. The three waves of the QRS complex represent ventricular depolarization [3].
• Small Q waves correspond to depolarization of the interventricular septum of heart as well breathing and are
generally small and thin in QRS complex. It leads to an old myocardial infarction (in which case they are big and wide)
• The R wave reflects depolarization of the ventricles and these are the largest waves of QRS complexes.
• The S wave are due to final depolarization of the ventricles of heart beat. Artificial Neural Network Based Data Processing
The introduced ANN was trained by the main features of the 100 ECG signal images of ten different diseases. The samples are taken from BIT-MIH website and ECG machine of Cardiologists ECG machine. The test results showed that the classification accuracy of the classifier of ANN was up to 92%. The extracted features of the ECG signal using wavelet decomposition (Signal domain change) was effectively utilized by ANN in producing the classification accuracy of more than 90%.
Another algorithm for feature extraction of ECG signals was proposed by in [10]. Here they worked on classification performance of an automatic classifier of the electrocardiogram (ECG) for the detection of abnormal beats of ECG signals. Correct classification of signal is important for correct prediction of heart arrhythmias. Here we focused on RR-intervals. Configuration adopted Kohonen self-organizing maps (SOM) for examination features, clustering of signal. For the development of classifier SOM and learning vector quantization (LVQ) algorithms are used on the basis of ANSI/AAMI EC57 standard.
The ECG signals (normal beat, congestive failure beat, ventricular tachyarrhythmia beat, a trial fibrillation beat) from the Physio-bank database were used here for training and testing of classifiers. MME classifier trained on the three diverse feature vectors produce better performance than that of the ME trained on the composite features. The results of the present study demonstrated that the MME can be used in classification of the ECG signals by taking into consideration the misclassification rates of ECG signals.
In [12] an approach proper feature extraction of ECG signals was described which a composite method developed for
• Complete data Compression of ECG signals
• Signal retrieval of ECG signals &
• Required Feature extraction of ECG signals in specific time
Here it not only compress data but also improves the quality ECG signal. The best topology with two hidden layers and three elements in each hidden layer has been finalized for ECG data compression using a Military Hospital (MH) data base. As compared with other methods of data compression it has been observed that a higher compression ratio can be achieved using ANN because it uses the number of cycles taken for compression in consideration that is signal length. The features like amplitude, slope and time duration are derived from input signal and then it is compared with the standard ECG signals. The results we got are steady and consistent so we can say that for efficient data management and feature extraction in many real-time applications composite method can be used.
Wavelet Analysis of ECG Signals
ECG signals are gathered and stored in analytical instruments (e.g., ECG machines) in the form of time-series. They can be transformed from the time domain into frequency, time-frequency, or other domains depending on the nature of the information required. The wavelet representation can be useful for interrogating the spectral component prevailing at
a given time instant. A feature extraction method using Discrete Wavelet Transform (DWT) was proposed here [13]. In the discrete wavelet transform (DWT) the relevant information from the ECG input data was extracted for the
classification task. The following steps are taken.
• Data acquisition is a primary stage in wavelet transform
• The data is preprocessed for beat detection,
• The important part of analysis is Feature extraction of ECG signals and • Classification for correct prediction.
The feature extraction module the Wavelet Transform (DWT) may lead to an optimal frequency resolution in all
frequency ranges and it has a varying window size, broad at lower and narrow at higher frequencies respectively. It is useful for the stable features of the ECG waveforms. The theories like chaos is used for dynamical systems and
Wavelet transform is used for stationary systems [14]. But here to reduce the dimensionality of the extracted features statistical features were used.
SIMULATION RESULTS
Figure 3: Time Domain Plot of a ECG Signal Trace
Figure 3 contains ECG signal trace taken from a subject with AF for the duration of approximately 10 heartbeats. The trace shows a QRS complex with a significant R-peak followed by a T-wave. The signal is superposed with higher frequency (>6Hz) atrial fibrillation P-waves in lieu of P-waves. After the false nearest neighbor and mutual information
test, the optimal embedding dimension and time delay were determined for reconstruction of the state space from the ECG traces using time delay.
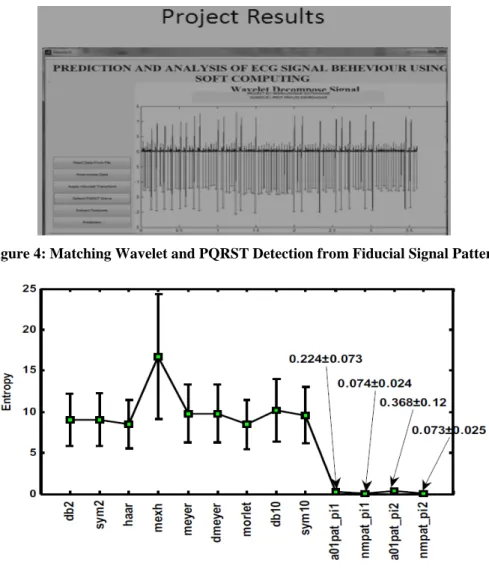
Figure 3 shows the least square matching wavelet design result. The resulting wavelet ψ(t) holds significant similarities to the fiducial pattern ψ'(t) and capture a majority of the variations among the ensembles.
Figure 4: Matching Wavelet and PQRST Detection from Fiducial Signal Pattern
Figure 5: Entropy Distribution for Different Wavelet Representations, Taken over all ECG Signals in the Database Considered
The two orders of magnitude increase in the compactness of ECG signal representation with customized wavelet (measured in terms of entropy reduction) is further evidenced from the examination of the distribution of entropies for eleven signals (a01, a02, a03, b01, b02, n01, n02, s01, s02, t01, t02) in the Physio Net database for the AF challenge with the eleven alternative wavelet bases including the standard and the customized wavelets (see Figure 5). Interestingly, the wavelets customized for an ECG signal from a normal case yield about five times lower entropy compared to that from a non-terminating AF case. Also, it may be noted that, although the customization yield ignorantly low entropy compared to standard wavelet basis. The present work is one of the first attempts to use recurrence analysis for prediction in the presence of generic forms of non stationarities. It combines the principles of statistical estimation with dynamic systems theory.
The following two scenarios are simulated towards evaluating the local recurrence modeling approach: (1) nonlinear and stationary signals generated by contaminating the first component of Lorenz attractor [12] with three different noise levels (signal noise ratios (SNR) between 7.37dB-21.35dB); (2) nonlinear and non stationary signals
obtained by dividing the contaminated Lorenz time series into several segments and randomly rearranging the sequence of these segments (SNR varied between 7.37dB-21.35dB).
Figure 6: Feature Extraction and Diagnosis of Diseases
CONCLUSIONS
This In this paper we had discussed various techniques and algorithms for feature extraction of ECG signal. Also it should be highly accurate and ensure fast extraction of features from the ECG signal then only it is fruitful. In general, the closer the basis function captures the signal characteristics, the more compact is the representation, and more likely are the features sensitive to relevant ECG states and insensitive to variations in extraneous noise. In this chapter, we have customized the basic functions of a continuous wavelet representation by choosing polynomial wavelet basis functions that match the characteristics of a fiducially 1-beat long ECG signal pattern extracted from the Poincare sectioning of ECG state space. The customized representations were found to be roughly two orders of magnitude more compact (measured in term of signal entropy) than the wavelet basis functions available in the standard wavelet library. Though we can successfully classified the heart arrhythmias.
ACKNOWLEDGEMENTS
The author thanks S.B.Jain Institute of Technology, Management & Research for extending financial support to implement the project.
REFERENCES
1. Qian Zheng, Chao Chen, Zhinan Li (2013). A Novel Multi-Resolution SVM (MR-SVM) Algorithm to detect ECG signals anomaly in WE-CARE project – Center for wireless communication and signal processing.
2. Sarikal, P. and Wahidabanu, R. (2010). Robust R peak & QRS detection in electrocardiogram using wavelet transform (IJACSA) International Journal of Advanced Computer Science Applications, 1(6), 48-53.
3. Gothwal, H., Kedawat, S., & Kumar, R. (2011). Cardiac arrhythmias detection in an ECG beat signal using fast
Fourier transform and artificial neural network. Journal of Biomedical Science & Engineering, 4(4), 289-296.
4. Qibin Zhao and LiqingZhan. (2005). ECG Feature Extraction and Classification Using Wavelet Transform and
Support Vector Machines, International Conference on Neural Networks and Brain, ICNN&B, vol. 2, pp. 1089-1092.
5. Awadhesh Pachauri, and Manabendra Bhuyan (2009). Robust Detection of R-Wave Using Wavelet Technique,
6. Ashley EA, Niebauer J. (2004). Conquering the ECG, London: Remedica.
7. F.A Davis (2005). ECG notes.
8. V. S. Chouhan, and S. S. Mehta (2008). Detection of QRS Complexes in 12- lead ECG using Adaptive Quantized
Threshold, IJCSNS International Journal of Computer Science and Network Security, vol. 8, no. 1.
9. M.B. Tayel, and Mohamed E. El-Bouridy (June 2006). ECG Images Classification Using Feature Extraction Based On Wavelet Transformation And Neural Network, ICGST, International Conference on AIML.
10. P. Tadejko, and W. Rakowski, (2007). Mathematical Morphology Based ECG Feature Extraction for the Purpose
of Heartbeat Classification, 6thInternational Conference on Computer Information Systems and Industrial Management Applications, CISIM '07, pp. 322-327.
11. F. Sufi, S. Mahmoud, I. Khalil (May 2008). A new ECG obfuscation method: A joint feature extraction & corruption approach, International Conference on Information Technology and Applications in
Biomedicine, pp. 334-337.
12. S. C. Saxena, A. Sharma, and S. C. Chaudhary (1997). Data compression and feature extraction of ECG signals,
International Journal of Systems Science, vol. 28, no. 5, pp. 483-498.
13. Emran M. Tamil, Nor Hafeezah Kamarudin, Rosli Salleh, M. Yamani Idna Idris, Noorzaily M. Noor, and Azmi Mohd Tamil (2008). Heartbeat Electrocardiogram (ECG) Signal Feature Extraction Using Discrete
Wavelet Transforms (DWT).
14. E.D. Übeyli (2009). Detecting variabilities of ECG Signals by Lyapunov Exponents, Neural computing and applications, vol.18, no. 7, pp. 653-662.
15. Alan Jovic, and Nikola Bogunovic (2007). Feature Extraction for ECG Time- Series Mining based on Chaos Theory, Proceedings of 29thInternational Conference on Information Technology Interfaces.
![Figure 2: Cardiac Depolarization Root [3]](https://thumb-us.123doks.com/thumbv2/123dok_us/692890.2585132/3.892.264.653.125.395/figure-cardiac-depolarization-root.webp)