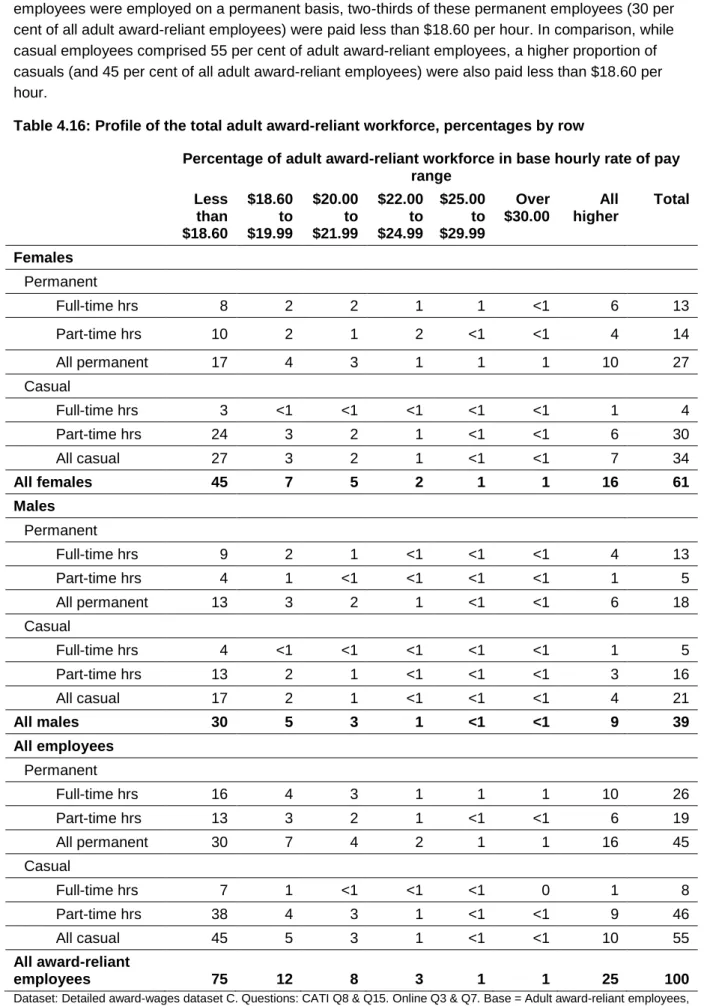
Award reliance
Sally Wright and John Buchanan
Workplace Research Centre, University of Sydney Business School
The contents of this paper are the responsibility of the author and the research has been conducted without the involvement of members of the Fair Work Commission.
ISBN 978-0-9874935-7-6
© Commonwealth of Australia 2013
This work is copyright. Apart from any use as permitted under the Copyright Act 1968, all other rights are reserved. Requests and inquiries concerning reproduction and rights should be addressed to:
Diana Lloyd, Manager, Media and Communications GPO Box 1994
Melbourne VIC 3001 Phone: 03 8661 7680
All research undertaken or commissioned by the Fair Work Commission for the Annual Wage Review 2013–2014 has been agreed by the Research Group. The Research Group comprises a Chair from the Workplace and Economic Research Section, Tribunal Services Branch of the Fair Work Commission, and representatives nominated by:
Australian Chamber of Commerce and Industry (ACCI); Australian Industry Group (Ai Group);
Australian Council of Social Service (ACOSS); Australian Council of Trade Unions (ACTU); Australian Government; and
state and territory governments.
This paper is the work of Sally Wright and John Buchanan of the Workplace Research Centre, University of Sydney Business School.
A draft of this paper was workshopped with the Research Group prior to finalisation. The authors would also like to thank the Research Group for its comments.
The contents of this research paper remain the responsibility of the authors, Sally Wright and John Buchanan.
Acknowledgement
This report has been several years in the making and involved many, many people. This acknowledgement gives recognition to only the most obvious contributors.
The group that made this study possible were the 11 569 employers who completed the survey, especially the subgroup of 2781 that provided extraordinary detail in the second component of the study. These are difficult times for most people to allocate any kind of discretionary time for a public good. It is reassuring that so many employers and their staff went to so much trouble to make this study a success.
The authors would also like to acknowledge the assistance of Fair Work Commission staff of the Workplace and Economic Research Section, in particular Karen Taylor, Samantha Farmakis-Gamboni, Kim Rusling and Joelle Leggett.
Within the research teams at the Workplace Research Centre (WRC) and ORC International (ORC), many people contributed a huge amount of time and expertise. In the initial phases, Sarah Oxenbridge assisted with research design in the project proposal stage. Toby Fattore assisted with project scoping. Assistance in completing the final draft was provided by Damian Oliver and Rose Ryan. Garima Verma assisted in getting the final product completed with tireless support in editing, formatting and data analysis, and Rebecca Fielding provided support in formatting. Within ORC, Phil Hughes was responsible for sample design and executing its construction. He was also involved in all formative stages of scoping, questionnaire development, field work testing and overseeing project field work. Kerry Sproston devoted extensive time and care to refining the questionnaire and undertook extensive work to refine the priority tables that guided the analytical stage of the project. Danielle Belleville and John Nielsen worked with the WRC to program the computer-assisted telephone interviewing and online surveys and in producing data tables. Dominic Pedlar and the team of ORC interviewers did an extraordinary job in testing the survey instruments and recruiting employers to the sample and gathering data from them. Their commitment to quality and being sensitive to respondent needs is much appreciated.
Sally Wright was the locomotive for the project from the development of the questionnaire, through to sample design, priority table specification, field work testing, initial data cleaning, table
production and drafting of the report. I was responsible for overseeing the project at all stages including preparing the proposal and scoping material, clarifying key categories (such as ‘higher classification’ employees) and finalising the draft report.
The final acknowledgement needs to go to the Fair Work Commission itself. This is a body that has, in one form or another, existed for over 100 years. Its research program is exemplary in providing evidence to help it better execute its very important but difficult work. Without its funding and support this project would not have happened.
Professor John Buchanan Director
Workplace Research Centre
University of Sydney Business School December 2013
Table of Contents
Abbreviations list and glossary ... i
Executive Summary ... vii
Research design ... vii
Award reliance in organisations ... viii
Characteristics of award-reliant employees... ix
Professional and other award-reliant employees on higher classifications ... ix
Conclusion ... x
1
Introduction ... 1
2
Research Design ... 4
2.1 Data collection methodology ... 4
2.2 Definitions ... 4
2.2.1 Defining award reliance ... 4
2.2.2 Defining higher classification (including professional) award-reliant employees ... 5
2.2.3 Pay-setting arrangements ... 6
2.3 Sample design and selection ... 8
2.4 Limitations of the research design ... 10
3
Award reliance in organisations ... 11
3.1 Overview of findings ... 11
3.2 Identifying award-reliant organisations ... 12
3.2.1 Mix of pay-setting arrangements across all non-public sector organisations covered by the national workplace relations system ... 12
3.2.2 The incidence of award-reliant organisations in the survey population ... 14
3.3 Award-reliant organisations ... 20
3.3.1 Degree of award reliance ... 20
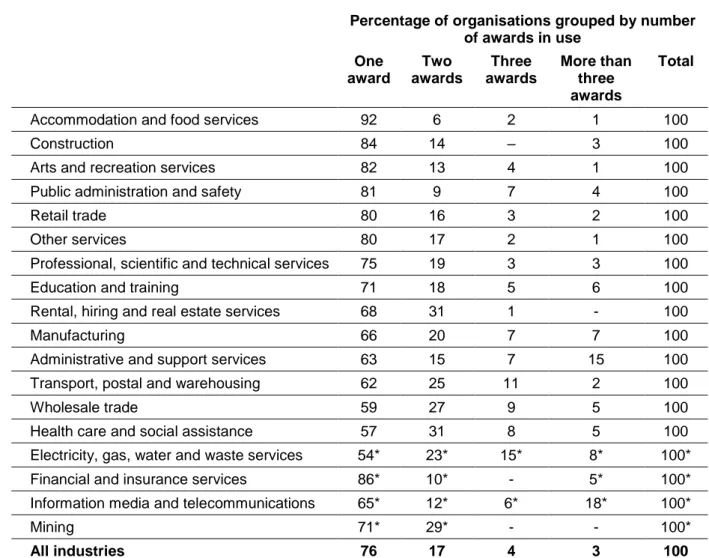
3.3.2 Modern awards used in organisations ... 23
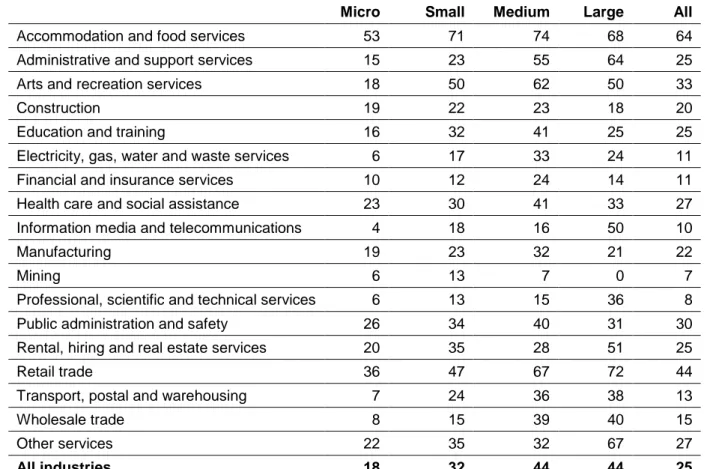
3.3.3 Industries with a high proportion of award reliance ... 25
3.4 Reasons for organisations using awards ... 29
3.4.1 Reasons for award reliance ... 29
3.4.2 Types of workers receiving award rates of pay ... 31
3.4.3 Progression off award rates of pay ... 33
3.4.4 Reasons for paying above award rates of pay ... 34
3.4.5 Passing on minimum wage adjustments ... 37
3.5.1 All industries ... 41
3.5.2 Accommodation and food services ... 44
3.5.3 Retail trade ... 45
3.5.4 Health care and social assistance ... 47
3.5.5 Administrative and support services ... 48
3.5.6 Manufacturing ... 50
3.6 Conclusion... 51
4
Award reliance among employees ... 53
4.1 Overview of findings ... 53
4.2 Identifying award-reliant employees ... 54
4.2.1 Distribution of employees by pay-setting arrangements across all non-public sector organisations covered by the national workplace relations system ... 54
4.2.2 The incidence of award reliance by organisation size in the survey population... 54
4.3 Characteristics of employees in award-reliant organisations ... 61
4.4 Characteristics of award-reliant employees ... 67
4.4.1 Juniors, apprentices, trainees and employees paid under the supported wage system... 69
4.4.2 Industries with a high proportion of award reliance ... 82
4.5 Conclusion... 94
5
Professional and other award-reliant employees on higher classifications ... 96
5.1 Identifying professional and other adult award-reliant employees on higher classifications ... 97
5.1.1 Higher and lower classifications by industry ... 98
5.1.2 Higher and lower classifications by organisation size ... 99
5.1.3 Higher and lower classifications by location ... 100
5.1.4 Higher and lower classifications by state or territory of organisation ... 100
5.1.5 Breakdown of employees in higher and lower classifications in top 25 modern awards ... 101
5.2 Characteristics of professional and other adult award-reliant employees ... 105
5.3 Characteristics of organisations employing professional and other adult award-reliant employees on higher classifications ... 110
5.4 Conclusion... 115
6
Summary and Conclusion ... 116
APPENDIX A—Common Pay Ranges ... 119
APPENDIX B — Categories for Classifying Arrangements that Define Wage
Entitlements ... 121
APPENDIX D — Survey Fieldwork Details ... 127
D.1 Fieldwork timeline ... 127
APPENDIX E — Sample Details ... 128
E.1 Achieved sample for CATI survey ... 128
E.4 Achieved sample for online survey ... 131
APPENDIX F — Detailed and Additional Tables ... 132
APPENDIX G—Comparison with ABS EEH Estimates ... 190
List of Tables
Table 3.1: Mix of pay-setting arrangements by award-reliant status of organisations, cell
percentages ... 13 Table 3.2: Organisations with award-based and award-reliant pay-setting arrangements, cell
percentages ... 13 Table 3.3: Incidence of award-reliant organisations by organisation size, percentages by column ... 14 Table 3.4: Incidence of award-reliant organisations by organisation size, percentages by row ... 15 Table 3.5: Incidence of award-reliant organisations in selected industries, percentages by column . 16 Table 3.6: Incidence of award-reliant organisations in selected industries, percentages by row ... 16 Table 3.7: Award reliance among all organisations by industry and organisation size,
percentages by cell ... 17 Table 3.8: Award reliance among all organisations by location, percentages by cell ... 18 Table 3.9: Award reliance among all organisations by industry, location and size of organisation,
percentages by cell ... 18 Table 3.10: Within industry degree of award reliance, award-reliant organisations only,
percentages by row ... 21 Table 3.11: Degree of award reliance by size of organisation, award-reliant organisations only,
percentages by row ... 22 Table 3.12: Degree of award reliance by state or territory, award-reliant organisations only,
percentages by row ... 22 Table 3.13: Degree of award reliance by location, award-reliant organisations only, percentages
by row ... 23 Table 3.14: Number of awards used to set pay in award-reliant organisations by industry,
percentages by row ... 24 Table 3.15: Number of awards used to set pay by size of award-reliant organisation, percentages
by row ... 25 Table 3.16: Modern awards most commonly used by award-reliant organisations in
Accommodation and food services, ranked from highest to lowest, percentages by column ... 26 Table 3.17: Modern awards most commonly used by award-reliant organisations in Retail trade,
ranked from highest to lowest, percentages by column ... 27 Table 3.18: Modern awards most commonly used by award-reliant organisations in Health care
and social assistance, ranked from highest to lowest, percentages by column ... 27 Table 3.19: Modern awards most commonly used by award-reliant organisations in
Administrative and support services, ranked from highest to lowest, percentages by column ... 28 Table 3.20: Modern awards most commonly used by organisations in Manufacturing, ranked
from highest to lowest, percentages by column ... 29 Table 3.21: Reasons why award-reliant organisations use registered enterprise agreements to
Table 3.22: Reasons why award-reliant organisations set wages over the applicable rate for
some employees, by higher classification, percentages by cell ... 36
Table 3.23: Incidence of annual minimum wage adjustments being passed on to employees on over-award arrangements in award-reliant organisations by industry, percentages by row ... 38
Table 3.24: Incidence of annual minimum wage adjustments being passed on to over-award employees in award-reliant organisations by size of organisation, percentages by row ... 39
Table 3.25: Incidence of annual minimum wage adjustments being passed on to over-award employees in award-reliant organisations by location, percentages by row ... 39
Table 3.26: Business metrics across all award-reliant organisations, by degree of award reliance, percentage by column within metric ... 43
Table 4.1: Award-based and award-reliant pay-setting arrangements for employees, cell percentages ... 54
Table 4.2: Incidence of award-reliant employees by organisation size, percentages by column ... 55
Table 4.3: Incidence of award-reliant employees by organisation size, percentages by row ... 55
Table 4.4: Incidence of award-reliant employees in selected industries, percentages by column ... 56
Table 4.5: Incidence of award-reliant employees in selected industries, percentages by row ... 56
Table 4.6: Share of workforce by pay-setting arrangements by award-reliant status of organisations, percentages by row ... 57
Table 4.7: Share of workforce by pay-setting arrangements by industry, percentages by row ... 58
Table 4.8: Share of workforce by pay-setting arrangements by organisation size, percentages by row ... 59
Table 4.9: Share of workforce by pay-setting arrangements by state or territory, percentages by row ... 60
Table 4.10: Share of workforce by pay-setting arrangements by location, percentages by row ... 60
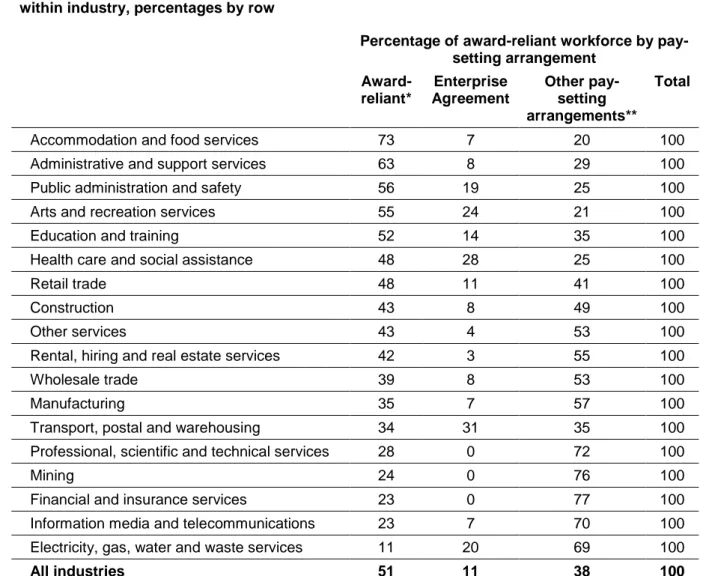
Table 4.11: Share of workforce by pay-setting arrangements within award-reliant workforce, within industry, percentages by row ... 62
Table 4.12: Share of workforce by pay-setting arrangements and organisation size, award-reliant organisations only, percentages by row ... 63
Table 4.13: Share of workforce by pay-setting arrangements and state or territory, award-reliant organisations only, percentages by row ... 63
Table 4.14: Share of workforce by pay-setting arrangements and state or territory, award-reliant organisations only, percentages by row ... 64
Table 4.15: Award reliance by industry and organisation size, award-reliant organisations only, percentages by row ... 65
Table 4.16: Profile of the total adult award-reliant workforce, percentages by row ... 68
Table 4.17: Share of juniors by industry, percentages by column and row ... 70
Table 4.18: Share of juniors by size of organisation, percentages by column and row ... 70
Table 4.19: Share of juniors by location, percentages by column and row ... 71
Table 4.21: Share of apprentices by industry, percentages by column and row ... 73
Table 4.22: Share of apprentices by size of organisation, percentages by column and row ... 74
Table 4.23: Share of apprentices by location, percentages by column and row ... 74
Table 4.24: Share of apprentices by modern award, percentages by column and row ... 75
Table 4.25: Share of trainees by industry, percentages by column and row ... 76
Table 4.26: Share of trainees by size of organisation, percentages by column and row... 77
Table 4.27: Share of trainees by location, percentages by column and row ... 77
Table 4.28: Share of trainees by modern award, percentages by column and row ... 77
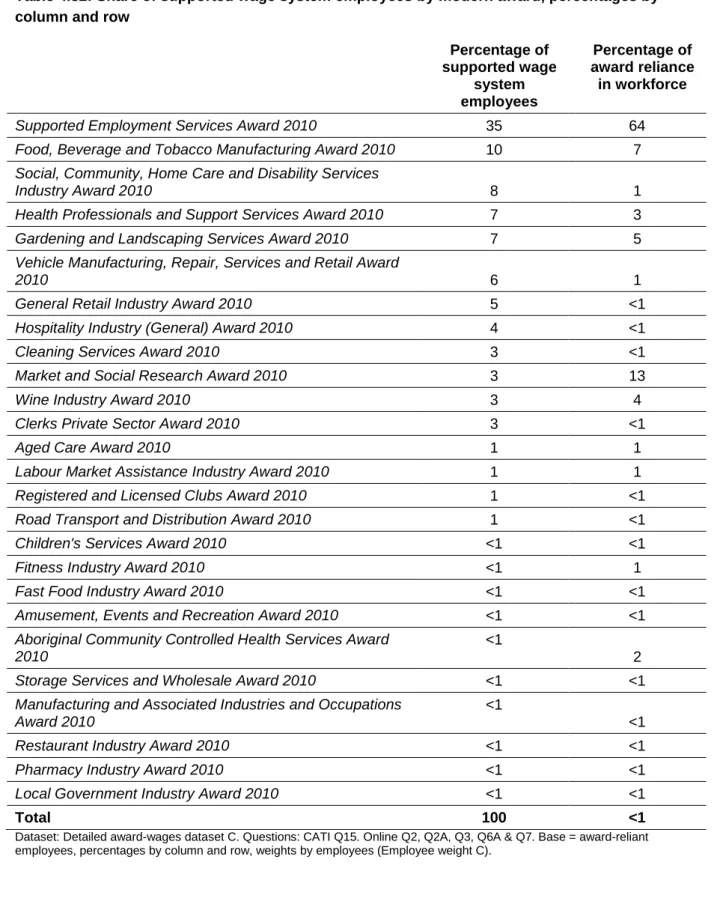
Table 4.29: Share of supported wage system employees by industry, percentages by column and row ... 79
Table 4.30: Share of supported wage system employees by size of organisation, percentages by column and row ... 80
Table 4.31: Share of Supported Wage System employees by location, percentages by column and row ... 80
Table 4.32: Share of supported wage system employees by modern award, percentages by column and row ... 81
Table 4.33: Profiles of the award-reliant and total workforce in award-reliant organisations in the Accommodation and food services industry compared with all industries, percentages by column ... 83
Table 4.34: Modern awards used to set pay for the highest proportion of award-reliant employees in Accommodation and food services, percentages by column ... 84
Table 4.35: Profiles of the award-reliant and total workforce in award-reliant organisations in Retail trade compared with all industries, percentages by column ... 85
Table 4.36: Modern awards used to set pay for the five highest amounts of award-reliant employees in Retail trade, percentages by column ... 86
Table 4.37: Profiles of the award-reliant and total workforce in award-reliant organisations in Health care and social assistance compared with all industries, percentages by column ... 88
Table 4.38: Modern awards used to set pay for the five highest amounts of award-reliant employees in Health care and social assistance, percentages by column ... 89
Table 4.39: Profiles of the award-reliant and total workforce in award-reliant organisations in Administrative and support services compared with all industries, percentages by column ... 90
Table 4.40: Modern award used to set pay for the five highest amounts of award-reliant employees in Administrative and support services, percentages by column ... 91
Table 4.41: Profiles of the award-reliant and total workforce in award-reliant organisations in the Manufacturing industry compared with all industries, percentages by column ... 93
Table 4.42: Modern awards used to set pay for the five highest amounts of award-reliant employees in Manufacturing by award-reliant employees, percentages by column ... 94
Table 5.1: Distribution of adult award-reliant employees across higher award classification rates of pay, all adult award-reliant employees and those covered by awards with professional classifications ... 98
Table 5.2: Adult award-reliant workforce in higher and lower classifications by industry,
percentages by row ... 99 Table 5.3: Adult award-reliant workforce by higher and lower classification by size of
organisation, percentages by row ... 100 Table 5.4: Adult award-reliant workforce by higher and lower classification by location,
percentages by row ... 100 Table 5.5: Adult award-reliant workforce by higher and lower classification by state or territory,
percentages by row ... 101 Table 5.6: Mix of higher and lower classification levels among adult award-reliant employees
across the 25 modern awards with the highest number of adult award-reliant employees,
percentages by column ... 102 Table 5.7: Mix of higher and lower classification levels among adult award-reliant employees
within the 25 modern awards with the highest number of adult award-reliant employees,
percentages by row ... 103 Table 5.8: Modern awards with professional classifications, by percentage of adult employees in
higher classifications, percentages by column and row ... 106 Table 5.9: Characteristics of adult award-reliant employees in modern awards with professional
classifications, percentages by column ... 107 Table 5.10: Pay distribution of adult higher classification award-reliant employees and their
characteristics in modern awards with professional classifications, percentages by row ... 109 Table 5.11: Labour costs in award-reliant organisations by adult award reliance on higher
classification jobs, percentages by column within metric ... 110 Table 5.12: Main revenue stream in award-reliant organisations by adult award reliance in higher
classification jobs, percentages by column within metric ... 111 Table 5.13: Profitability of award-reliant organisations by adult award reliance in higher
classification jobs, percentages by column ... 112 Table 5.14: Profitability of award-reliant organisations by adult award reliance in higher
classification jobs, percentages by column ... 112 Table 5.15: Workforce expansion in award-reliant organisations by adult award reliance in higher
classification jobs, percentages by column ... 113 Table 5.16: Geographic markets of award-reliant organisations by adult award reliance in higher
classification jobs, percentages by column ... 113 Table 5.17: Hours of operation of award-reliant organisations by adult award reliance in higher
classification jobs, percentages by column ... 114 Table 5.18: Years of operation of award-reliant organisations by adult award reliance in higher
classification jobs, percentages by column ... 114 Table A.1: Common ranges for adult award rates of pay ... 120 Table C.1: Distribution of organisations in private sector national workplace relations system, by
industry and organisation size, percentages by row and column ... 123 Table C.2: Distribution of organisations in private sector national workplace relations system, by
Table C.3: Distribution of employees in private sector national workplace relations system, by
industry and organisation size, percentages by row ... 125 Table C.4: Distribution of employees in private sector national workplace relations system, by
industry and organisation size, percentages by column ... 126 Table E.1: CATI survey sample, organisations by industry and award reliance status of
organisation, percentages by row and column ... 128 Table E.2: CATI survey sample, organisations by award reliance status of organisation, size of
organisation and state/territory, percentages by row and column ... 129 Table E.3: CATI survey sample, employees by award reliance status of organisation, by
industry, percentages by row and column ... 130 Table F.1: Modern award usage by award-reliant organisations to pay award rates across all
industries, ranked from highest to lowest, percentages by column ... 138 Table F.2: Modern awards used by award-reliant organisations in the Accommodation and food
services industry, ranked by highest to lowest, percentages by column ... 141 Table F.3: Modern awards used by award-reliant organisations in the Retail trade industry,
ranked from highest to lowest, percentages by column ... 142 Table F.4: Modern awards used by award-reliant organisations in the Health care and social
assistance industry, ranked from highest to lowest, percentages by column ... 143 Table F.5: Modern awards used by award-reliant organisations in the Administrative and support
services industry, ranked from highest to lowest, percentages by column ... 144 Table F.6: Modern awards used by award-reliant organisations in the Manufacturing industry,
ranked from highest to lowest, percentages by column ... 145 Table F.7: Reasons for award reliance by industry, percentages by cell... 146 Table F.8: Typical categories of award-reliant employees by industry, percentages by cell ... 148 Table F.9: Reasons for progression off award rates of pay, Mining industry, percentages by row . 149 Table F.10: Reasons for progression off award rates of pay, Manufacturing industry,
percentages by row ... 149 Table F.11: Reasons for progression off award rates of pay, Electricity, gas, water and waste
services industry, percentages by row ... 150 Table F.12: Reasons for progression off award rates of pay, Construction industry, percentages
by row ... 150 Table F.13: Reasons for progression off award rates of pay, Wholesale trade industry,
percentages by row ... 151 Table F.14: Reasons for progression off award rates of pay, Retail industry, percentages by row 151 Table F.15: Reasons for progression off award rates of pay, Accommodation and food services
industry, percentages by row ... 152 Table F.16: Reasons for progression off award rates of pay, Transport, postal and warehousing
industry, percentages by row ... 152 Table F.17: Reasons for progression off award rates of pay, Information media and
Table F.18: Reasons for progression off award rates of pay, Financial and insurance services industry, percentages by row ... 153 Table F.19: Reasons for progression off award rates of pay, Rental, hiring and real estate
services industry, percentages by row ... 154 Table F.20: Reasons for progression off award rates of pay, Professional, scientific and
technical services industry, percentages by row ... 154 Table F.21: Reasons for progression off award rates of pay, Administrative and support services
industry, percentages by row ... 155 Table F.22: Reasons for progression off award rates of pay, Public administration and safety
industry, percentages by row ... 155 Table F.23: Reasons for progression off award rates of pay, Education and training industry,
percentages by row ... 156 Table F.24: Reasons for progression off award rates of pay, Health care and social assistance
industry, percentages by row ... 156 Table F.25: Reasons for progression off award rates of pay, Arts and recreation services
industry, percentages by row ... 157 Table F.26: Reasons for progression off award rates of pay, Other services industry,
percentages by row ... 157 Table F.27: Business characteristics in the Accommodation and food services industry by
degree of workforce award reliance, percentages by column within characteristic ... 158 Table F.28: Business characteristics in the Retail trade industry by degree of workforce award
reliance, percentages by column within characteristic ... 161 Table F.29: Business characteristics in the Health care and social assistance industry by degree
of workforce award reliance, percentages by column within characteristic ... 164 Table F.30: Business characteristics in the Administrative and support services industry by
degree of workforce award reliance, percentages by column within characteristic ... 167 Table F.31: Business characteristics in the Manufacturing industry by degree of workforce award
reliance, percentages by column within characteristic ... 170 Table F.32: Share of workforce by pay-setting arrangement by award-reliant status of
organisations and industry, percentages by row ... 173 Table F.33: Share of workforce by pay-setting arrangement by size of organisation and
award-reliant status of organisation, percentages by row ... 177 Table F.34: Share of workforce by pay-setting arrangement by state or territory and
award-reliant status of organisation, percentages by row ... 178 Table F.35: Share of workforce by pay-setting arrangement by location and award-reliant status
of organisation, percentages by row ... 180 Table F.36: Modern award used to pay by award-reliant employees, percentages by column
across all industries ... 181 Table F.37: Modern awards used to pay award-reliant employees in the Accommodation and
Table F.38: Modern awards used to pay award-reliant employees in the Retail trade industry,
percentages by column ... 185 Table F.39: Modern awards used to pay award-reliant employees in the Health care and social
assistance industry, percentages by column ... 187 Table F.40: Modern awards used to pay for award-reliant employees in the Administrative and
support services industry, percentages by column... 188 Table F.41: Modern awards used to pay award-reliant employees in the Manufacturing industry,
percentages by column ... 189 Table G.1: ABS EEH survey method of setting pay, all employees by sector, May 2012,
percentages by row ... 190 Table G.2: ABS EEH survey method of setting pay, all employees by industry, May 2012,
percentages by row ... 191 Table G.3: ABS EEH method of setting pay, all employees, states and territories, May 2012,
percentages by row ... 192
List of Figures
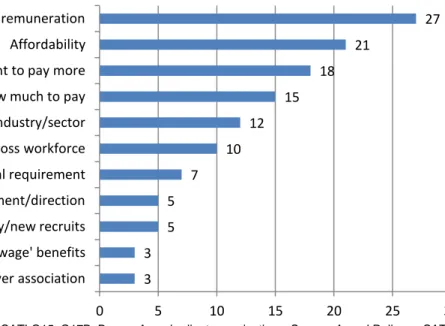
Figure 3.1: Reasons for award reliance, percentages by cell ... 30 Figure 3.2: Typical categories of award-reliant employees, all award-reliant organisations,
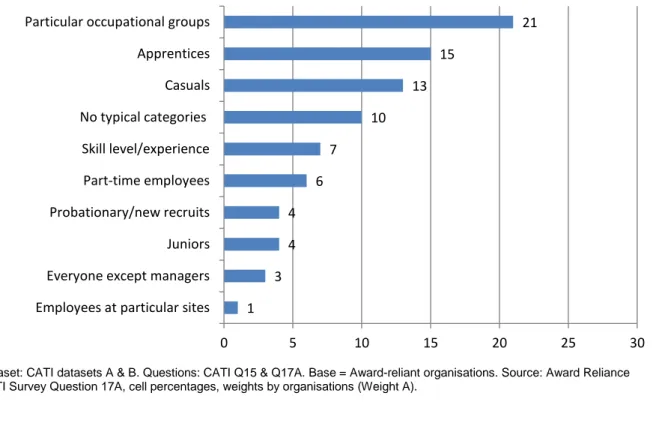
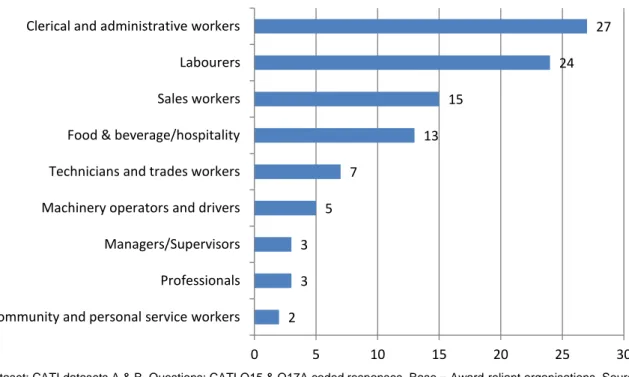
percentages by cell ... 31 Figure 3.3: Particular occupation groups that were typically award-reliant employees,
percentages by cell ... 33 Figure 3.4: Reasons for progression off award rates of pay, all industries ... 34 Figure F.1: Organisations with award-based and award-reliant pay-setting arrangements by
organisation size, percentages by row ... 132 Figure F.2: Organisations with award-based and award-reliant pay-setting arrangements by
industry, percentages by row ... 133 Figure F.3: Organisations with award-based and award-reliant pay-setting arrangements by
location, percentages by row ... 134 Figure F.4: Employees with award-based and award-reliant pay-setting arrangements by size of
business, percentages by row ... 135 Figure F.5: Employees with award-based and award-reliant pay-setting arrangements by
industry, percentages by row ... 136 Figure F.6: Employees with award-based and award-reliant pay-setting arrangements by
i Research Report 6/2013 www.fwc.gov.au
Abbreviations list and glossary
ABS Australian Bureau of Statistics
Annual Wage Review From July each year, the Fair Work Commission conducts the Annual Wage Review. This involves conducting a review of minimum wage rates where the Panel may set or vary minimum wages in modern awards, and must make a national minimum wage order.
ANZSCO Australian and New Zealand Standard Classification of
Occupations 2006
ANZSIC Australian and New Zealand Standard Industrial
Classification 2006
Apprentice A person undertaking an Australian Apprenticeship that combines training and employment and which can lead to a nationally recognised trade qualification.
Apprentices usually get paid a percentage of what a qualified tradesperson would get paid. For example, someone in the second year of a 4-year apprenticeship may get paid 70 per cent of a qualified tradesperson’s wage.
Award An award is an enforceable document containing
minimum terms and conditions of employment in addition to any legislated minimum terms. In general, an award applies to employees in a particular industry or occupation and is used as the benchmark for assessing enterprise agreements before approval. The Fair Work Commission has responsibility for making and varying awards in the national workplace relations system.
Award-reliant employee An employee who has their pay set according to the relevant award rate specified for their classification and not above that relevant rate.
Award-based pay-setting arrangement An award-based pay setting arrangement is one where the rate of pay an employee receives is set, influenced or guided in some way by the applicable rate of pay in the award. Award-based pay setting arrangements include award rates and agreements to pay over award rates of pay.
Award rate of pay The applicable rate of pay specified in the classification structure of the award.
www.fwc.gov.au Research Report 6/2013 ii Award-reliant organisation Those organisations with employees that are
award-reliant only, meaning that their pay is set according to the relevant award rate specified for the classification of the employee and not set above that relevant rate.
BOOT Better Off Overall Test is a test that the Fair Work
Commission uses to assess enterprise agreements against modern awards. An enterprise agreement will pass this test where the Fair Work Commission is satisfied that each employee that would be covered by the agreement would be “better off overall” if the agreement applied to them, rather than the relevant modern award. Individual flexibility arrangements under modern awards and enterprise agreements must also satisfy the test. The BOOT will compare the terms of a proposed enterprise agreement against the relevant modern award to make sure employees will be better off overall. The BOOT replaced the No Disadvantage Test.
C10
The entry level classification for trades qualifiedemployees in the Manufacturing and Associated Industries and Occupations Award 2010. It, and its predecessor (the metal fitter and machinist
classification), has been the benchmark classification for setting award relativities in Australia for nearly a
century. In the Award Reliance Survey, the C10 classification was used as the benchmark for higher classifications, where award-reliant employees who were paid at or above the C10 rate were defined as higher classification and those award-reliant employees who were paid less than the C10 rate were defined as lower classification.
Casual employee Casual employees are usually employed by the hour or by the day. They do not get paid sick leave or annual leave. To make up for this they get extra pay called a casual loading. Casual workers are less likely to have regular or guaranteed hours of work.
Casual loading Casual loading is an amount paid on top of the base rate of pay to casual employees. The purpose of a casual loading is to compensate casual employees for not getting certain entitlements that permanent employees receive, such as paid annual leave and personal (sick) leave. Most modern awards have a casual loading of 25 per cent.
iii Research Report 6/2013 www.fwc.gov.au Classification A classification of employees into types for the purposes
of pay and other entitlements under an industrial instrument (such as a modern award or enterprise agreement). A classification outlines the type of work an employee does and sometimes their expected skill level or required qualifications. Different classifications apply to employees doing different work. Classification structures are included in all modern awards.
Commission
Fair Work CommissionEEH Employee Earnings and Hours
Enterprise award An enterprise award is a type of pre-reform award (made by the Australian Industrial Relations
Commission before 27 March 2006) that applies to one business, activity, project or undertaking. Enterprise awards are not replaced by modern awards but the parties can apply to the Fair Work Commission to replace an enterprise award with a modern enterprise award. If the parties do not make an application to ‘modernise’ their enterprise award by 31 December 2013, it will cease to operate.
Fair Work Act Fair Work Act 2009 (Cth)
Full-time Ordinary paid work of 35 or more hours per week.
Higher classification Award classification with a basic hourly rate of more than $18.58 (benchmarked to C10). This was rounded to $18.60 when presented to survey respondents in questions regarding pay ranges. The equivalent casual rate was $23.25 per hour, the equivalent weekly rate was around $707.00 and the equivalent annual rate was more than $36 720.
Individual arrangement An individual arrangement is where an employee has their pay set by an individual contract, registered individual agreement, common law contract or an individual agreement to receive over award payments.
ITEA Individual transitional employment agreement is a
statutory written agreement between an individual employee and an employer about the employee’s terms and conditions of employment. Australian workplace agreements (AWAs) could not be made after 28 March 2008. From then until up to 31 December 2009 ITEAs could be made. ITEAs have a nominal expiry date of 31 December 2009 (or earlier if specified in the
www.fwc.gov.au Research Report 6/2013 iv
agreement). ITEAs are now individual agreement based transitional instruments.
Junior A junior employee under the Fair Work Act 2009 (Cth) is
a national system employee who is under 21 years of age. This term is defined in section 12 of the Fair Work Act 2009 (Cth).
Lower classification Award classification with a paid a basic hourly rate of less than $18.60 per hour (or equivalent) (benchmarked to below C10).
Metropolitan Organisation with majority of workforce located in a capital city.
Modern award Modern awards operate together with the National Employment Standards (NES) to provide minimum conditions of employment for employers and employees in the ‘national system’. Modern awards supplement the NES by setting out additional minimum terms and conditions that apply in a particular industry or occupation including monetary entitlements such as wages, penalty rates and allowances. Modern awards consolidated and replaced terms and conditions of employment that were previously contained in certain federal instruments (e.g. pre-reform awards and NAPSAs). Modern awards also include minimum wage entitlements that were previously contained in the Australian Fair Pay and Conditions Standard (e.g. pay scales and the federal minimum wage). Modern awards commenced operation on 1 January 2010.
Minimum wage adjustment Any adjustment to minimum wages received by
employees in the national workplace system as a result of the Annual Wage Review. Any adjustments take effect on 1 July each year.
National system From 1 January 2010, state referrals of workplace relations powers from NSW, QLD, SA and TAS to the Commonwealth created a national workplace relations system which includes all private sector employment, other than employment by non-constitutional
corporations in Western Australia. All employment in VIC, the NT and the ACT was already under the national workplace relations system. Employers and employees, other than in WA, that were previously covered by state workplace relations systems because the employer is not a constitutional corporation are covered by the national workplace relations system
v Research Report 6/2013 www.fwc.gov.au established by the Fair Work Act 2009 (Cth). As part of the changes, some public sector and local government employment previously under the national system is now covered by the state systems.
NES National Employment Standards
Organisation Non-public sector businesses and organisations in the national system.
ORC ORC International, the fieldwork company for the Award
reliance project.
Panel Expert Panel of the Fair Work Commission, formerly
Minimum Wage Panel of the Fair Work Commission, formerly Minimum Wage Panel of Fair Work Australia.
Part-time Ordinary paid work of less than 35 hours per week.
Pay-setting arrangement Method of setting pay for employees.
Permanent employee An employee with an ongoing or open-ended contract of employment.
Professional classification A higher classification where tertiary/university level qualifications (excluding vocational education and training qualifications) or highly specialised knowledge or skills is integral to the classification.
Professional employee An employee in a professional classification.
Project The Award reliance research project
Regional/rural Organisation with majority of workforce located outside capital cities.
Registered collective agreement A registered collective agreement is an agreement made between one or more employers and a group of employees or a union representing a group of
employees. It sets out the terms and conditions of employment. This type of collective agreement is lodged with and approved by the Fair Work Commission.
Trainee A person who is employed under a training
arrangement. A trainee must be registered to be paid trainee wages. Trainee wages are usually based on the training course the person is doing, when the person finished secondary school and the highest year of school they completed.
www.fwc.gov.au Research Report 6/2013 vi Training arrangement A training arrangement is a combination of work and
training that is subject to a training agreement or a training contract between the employee and the employer that takes effect under a state or territory law relating to training employees.
Transitional wage instrument While modern awards contain minimum wages, some modern awards have transitional arrangements in place, under which the wage-related components may be phased in over five years.
Unregistered collective agreement An unregistered collective agreement is an agreement made between one or more employers and a group of employees or a union representing a group of
employees. It sets out the terms and conditions of employment. This type of collective agreement has not been lodged with or approved by the Fair Work
Commission.
WRC Workplace Research Centre, University of Sydney
vii Research Report 6/2013 www.fwc.gov.au
Executive Summary
The centralised establishment of minimum wages and the role of awards in determining the wages of employees across an industry or occupation have long been central features of Australia’s wage-fixing system. One key change has been the greater prominence given to bargaining (most recently under the Fair Work Act 2009 (Cth) (Fair Work Act)) at an enterprise level. The federal tribunal responsible for the role of national wage-fixing has undergone a number of major changes including the rationalisation and modernisation of awards to apply nationally, that is, across former federal and state jurisdictions.
In the Annual Wage Review 2009–10,1
the then Minimum Wage Panel noted the need for research into the composition of the award-reliant workforce. The Minimum Wage Panel recognised that an understanding of award reliance is essential to the minimum-wage setting process, stating in its decision for the Annual Wage Review 2009–102
that to inform future reviews it was seeking research to explore the extent and composition of the award-reliant sector.
This project on award reliance was conducted to examine these issues. It was undertaken by the Workplace Research Centre, University of Sydney Business School (WRC) in collaboration with fieldwork company ORC International (ORC) on behalf of the Fair Work Commission. It was supplemented by two other projects, one of which considered incentives to enterprise bargaining among a range of industries in Australia, and the other being a qualitative study of professionals and other employees on higher award classifications.The focus of the Award Reliance Survey was to quantitatively investigate award reliance across and within Australian organisations, and to identify the mix or ‘categories’ of award-reliant employees and their location on award classification scales. The project had two main objectives. The first was to identify the incidence of award reliance across all non-public sector organisations and employees at the organisational level. The second was to identify the nature of award reliance across all non-public sector award-reliant organisations (i.e. organisations paying at least one employee exactly the award rate) in order to:
identify award-reliant employees, and professional and other award-reliant employees on higher award classifications (including the characteristics of these employees);
investigate explanatory variables for award reliance in professional and other higher classification award-reliant employees; and
explore explanatory variables for award reliance at the organisation level.
Research design
Information was collected from a computer-assisted telephone interview (CATI) and an online survey with employers. There are two main terms used to describe award reliance throughout the report. Award-reliant employees were those employees whose applicable instrument was a minimum wage instrument (specifically, a modern award) and whose wages were directly determined by the
instrument for their base rate of pay. While the definition for award-reliant employees is consistent with the award-only category featured in the Australian Bureau of Statistics (ABS) Employee Earnings and Hours (EEH) 2012 Survey, the approach used to collect data on pay-setting arrangements differs from the approach used in the ABS EEH 2012 Survey. In particular, in the Award reliance project data was initially gathered on four main pay setting categories (registered enterprise agreements,
1 Annual Wage Review 2009–10 decision, [2010] FWAFB 4000 (3 June 2010). 2 Annual Wage Review 2009–10 decision, [2010] FWAFB 4000 (3 June 2010).
www.fwc.gov.au Research Report 6/2013 viii unregistered enterprise agreements, award-based arrangements and individual arrangements). Secondly, while the ABS EEH Survey makes reference to the industrial arrangement by which the ‘main part’ of an employee’s pay was set, the Award Reliance Survey referred, more broadly, to how an employee’s pay was set. Perhaps more significant, the sample for the Award reliance project was restricted to non-public sector organisations in the national system, In comparison, the sample for the ABS EEH Survey is drawn from all employees in Australia. Additionally, respondent organisations for the Award reliance project were asked to report on pay-setting arrangements for all of their
employees whereas the ABS EEH Survey asks organisations to draw a random sample of employees from their payroll. For these reasons, it is not possible to directly compare the estimates of award-reliance in the Award award-reliance project with those estimates published in the ABS EEH Survey. Award-reliant organisations were those non-public sector organisations that employed at least one award-reliant employee. Relevantly, there is no comparable equivalent data collected on award-award-reliant organisations in the ABS EEH 2012 Survey.
To promote consistency, the definition of higher classification award-reliant employees draws on the same convention used by Maltman and Dunn3 where such employees are defined as those whose pay was set above the C10 rate in the Manufacturing and Associated Industries and Occupations Award 2010. It was not possible to directly identify award-reliant professional employees through the Award Reliance Survey. Instead, a subset of higher classification award-reliant employees was created comprising higher classification award-reliant employees who were covered by modern awards that contained professional classifications, where professional classifications comprised those in positions requiring tertiary/university level qualifications (excluding vocational education and training qualifications) or highly specialised knowledge or skills.
Data were collected on the three most common methods of pay-setting arrangements (enterprise agreements, awards and individual arrangements). To try to resolve the potential overlap between the pay-setting arrangements, questions in the CATI survey were ordered to seek information on
enterprise agreements first, followed by awards, and then individual arrangements.
The sample design and screening questions for the CATI questionnaire were designed to recruit non-public sector organisations covered by the national workplace relations system. Employees were deemed to be under federal or state workplace relations jurisdictions for pay-setting purposes based on the legal status of their employer. The sample design for the Award Reliance Survey used the Dun and Bradstreet database of registered businesses and was based on 28 survey strata defined
according to industry and employment size. The sample sizes for these strata were defined in terms of quotas for award-reliant organisations in each strata. Oversampling occurred in the five industries which, according to the Australian Bureau of Statistics’ (ABS) Employee Earnings and Hours (EEH) 2012 Survey,4 account for the largest proportion of award-reliant employees.
Award reliance in organisations
Based on the survey sample, 52 per cent of non-public sector organisations based, in some way, the pay of at least one of their employees on awards. Just under half of these (25 per cent of all non-public sector organisations) had at least one employee paid at the exact rate of pay as specified in the relevant award. This latter group constituted what are referred to throughout this report as ‘award-reliant’ organisations.
3
Maltman K and Dunn A (2013), Higher classification/professional employee award reliance qualitative research: Consolidated report, Research Report No. 1/2013, Fair Work Commission, Melbourne.
4
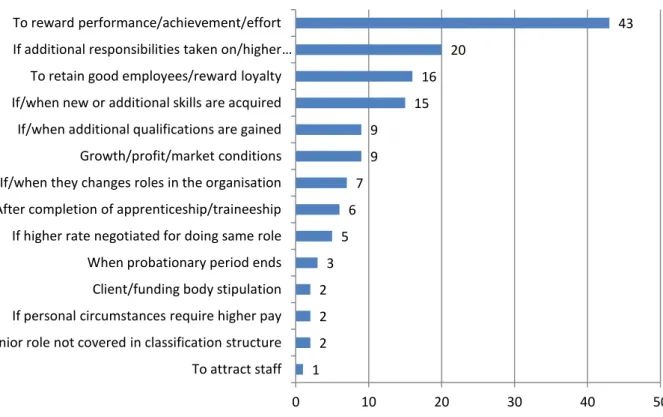
ix Research Report 6/2013 www.fwc.gov.au Award reliance was found to be high among larger non-public sector organisations. It was found that in 50 per cent of reliant organisations, more than three-quarters of employees were award-reliant. Most award-reliant organisations used only one award (71 per cent). Larger organisations were more likely to use more than one award. The types of employees that were typically paid award rates by organisations differed, with particular lower skilled occupational groups, apprentices and those employed on a casual basis the most common categories. Around 30 per cent of award-reliant organisations paid annual wage review increases to over-award employees. The most common reason cited for organisations that pay above the award rate were to reward performance, achievement or effort.
Business characteristics analysed in this report showed that most non-public sector award-reliant organisations had operated for more than five years and had reported a profit or surplus in the 2011– 12 financial year. A majority of award-reliant organisations reported working outside standard
operating hours. Around 30 per cent of award-reliant organisations reported that between 25 per cent and less than 50 per cent of their operating expenses comprised labour costs, across all degrees of award reliance. Across organisations that had more than one-quarter of their workforce award-reliant, over half reported that their workforce had stayed the same compared with the same time last year. For businesses that had less than one-quarter of their workforce award-reliant, a higher proportion reported that their workforce had increased. Although a majority of award-reliant organisations reported that there was an adequate supply of labour (i.e. 70 per cent), this was particularly high for organisations that had more than three-quarters of their workforce award-reliant (i.e. 75 per cent of such organisations). Note that the findings on business metrics and their association with award reliance must be treated with caution, as the data did not enable comparison with the situation in non award-reliant organisations. Also, it was unclear whether the characteristics noted above are linked to award reliance or other factors such as industry and size characteristics.
Characteristics of award-reliant employees
While 40 per cent of employees in non-public sector organisations had their pay based on awards in some way, 19 per cent of employees in the surveyed sample were award-reliant, i.e. had their pay set at exactly the award rate. Such award-reliant employees comprised a higher proportion in
Accommodation and food services, Administrative and support services, Retail trade and Arts and recreation services workforces. Just over one-third (36 per cent) of employees were employed in award-reliant organisations. Of all employees in award-reliant organisations, 51 per cent were found to be reliant. Award-reliant employees comprised a higher proportion of employees in award-reliant organisations in Accommodation and food services and Administrative and support services. Adult award-reliant employees were more likely to be female, employed on a casual basis and working part-time hours. Most adult award-reliant employees were receiving an hourly wage of less than $18.60.
Professional and other award-reliant employees on higher classifications
In its Annual Wage Review 2010–11 decision, the Panel stated that available data suggest that many award-reliant employees have their wages set at award rates higher up the classification scales. The flat dollar form of wage increases in recent times has compressed wages higher up the wage
classifications compared with the minimum wage. To address the Panel’s interest in wage relativities for award classifications higher up the scales, the Award Reliance Survey gathered detailed
information on the incidence and characteristics of professional and other award-reliant employees on higher classifications.
www.fwc.gov.au Research Report 6/2013 x One-quarter (25 per cent) of adult award-reliant employees in non-public sector organisations were found to be on rates of pay greater than $18.60 per hour (or the equivalent of $36 720 per annum). Of these higher classification employees, the two industries with the highest proportion of higher
classification award-reliant employees were Education and training (74 per cent in higher classifications) and Health care and social assistance (68 per cent in higher classifications). The proportion of higher classification award-reliant employees was also higher among employees working in micro organisations and in organisations based in regional/rural locations. Adult award-reliant employees in awards with professional classifications were relatively more likely to be female and employed on a permanent basis.
Conclusion
The Australian workplace relations system has been through some large scale changes over the last 30 years. This report provides important new information that reveals that modern awards are used as the basis for setting rates of pay for far more employees than just low-wage employees on minimum rates. In addition, the use of modern awards to guide pay-setting decisions is not narrowly confined to just the award-reliant organisations and their employees. This was clear with the 36 per cent of organisations that were not award-reliant that referred to pay rates in awards, despite not paying any of their employees at exactly the award rate. It was also clear in award-reliant organisations, 30 per cent passed on the most recent annual wage review increase to their over-award employees.
The authors of this report suggest that a matter worthy of further exploration is the extent to which the higher level classifications in awards are utilised. While the award system has an extensive set of graduated classifications designed to underpin career paths, it would seem that there is significant clustering in the lower reaches of classification structures. How jobs are classified and how workers are allocated to particular levels in awards is a topic that has, to date, received very little attention. The final set of observations from the authors concerns how pay-setting arrangements in modern awards currently operate in organisations across the labour market. This report finds clustering of a limited number of awards around particular parts of the labour market or workforce. While a limited number of awards were used to set the pay of most award-reliant workers, a more diverse group of modern awards were used to set the pay of sub-minimum wage employees. This diversity is associated with the range of work undertaken by sub-minimum wage employees or the type of workers paid sub-minimum rates.
The authors of this report suggest that awards merit recognition as they remain one of the main wage-setting instruments used in Australia. Modern awards have been updated to reflect changing
circumstances in the Australian labour market and, as a result, awards continue to have relevance to a large number of organisations and employees—not just those who rely on awards to determine exact rates of pay. Further investigation as to the extent to which modern awards both reflect and help define job structures is warranted.
1 Introduction
The centralised establishment of minimum wages and the role of awards in determining the wages of employees across an industry or occupation have long been central features of Australia’s wage fixing system. Over the past three decades, however, the national workplace relations system has been subject to considerable change. There have been a number of significant amendments to legislation governing workplace relations, including a shift in the legislative base away from the conciliation and arbitration power (s.51xxxv) to the corporations power (s.51xx) of the Australian Constitution and the expansion of national system coverage. Another key change has been the greater prominence given to bargaining (most recently under the Fair Work Act 2009 (Cth) (Fair Work Act)) at an enterprise level. The federal tribunal responsible for the role of national wage-fixing has undergone a number of major changes, including the rationalisation and modernisation of awards to apply nationally, that is, across former federal and state jurisdictions.
There has been longstanding interest in the impact and role of awards in wage determination.5 The new changes to the wage-fixing system raise new questions about the role of awards and minimum wages in Australia, and the relationship between them and other wage-setting arrangements, including enterprise agreements. Under the Fair Work Act, the Expert Panel (Panel, formerly the Minimum Wage Panel) of the Fair Work Commission (Commission, formerly Fair Work Australia) is required to conduct annual wage reviews, during which it may set, vary or revoke the minimum wages contained in one or more modern awards.6 The Panel must also make a national minimum wage order that sets specific wages for employees not covered by an award or agreement.7 In conducting its review, the Panel is required to establish and maintain a safety net of fair minimum wages in accordance with minimum wages objectives, outlined in s.284 of the Fair Work Act.8
In the Annual Wage Review 2009–10, the Panel noted the need for research into the composition of the award-reliant workforce.9 The Panel recognised that an understanding of award reliance is essential to the minimum-wage setting process, stating in its decision for the Annual Wage Review 2009–10 that to inform future reviews it was seeking research ‘directed to a more precise
identification of the extent and composition of the award-reliant sector’.10
The Panel subsequently outlined in its research program for the Annual Wage Review 2010–11 (reconfirmed in its Annual Wage Review 2011–12 and Annual Wage Review 2012–13 research program statements11) that it wanted research to be undertaken into award reliance covering a number of topics:
A number of gaps have been identified in the understanding of award-reliant employers and employees. There are limitations in identifying award-reliant employers and employees in all major data sources. The Panel is interested in alternative data sources that may shed light on award reliance.
Specific research undertaken on award reliance will endeavour to:
5
A very useful reflection on and synthesis of decades of research on this issue is provided in Hancock K and Richardson S (2004), ‘Economic and Social Effects’ in Joe Isaac and Stuart Macintyre, The New Province For Law & Order: 100 Years of Australian Industrial Conciliation and Arbitration, Cambridge University Press, Cambridge, pp. 139–206.
6
Fair Work Act 2009 (Cth), s.285(2)(b); see also s.284(3) and s.284(4). 7
Fair Work Act 2009 (Cth), s.294(1)(a), s.294(1)(b) and s.294(4). 8
Fair Work Act 2009 (Cth), s.284(1) and s.284(2).
9 Annual Wage Review 2009–10 decision, [2010] FWAFB 4000 (3 June 2010), at para. 428. 10
Annual Wage Review 2009–10 decision [2010] FWAFB 4000 (3 June 2010), at para. 319. 11
Annual Wage Review 2011–12 statement [2011] FWA 7916 (22 November 2011); Fair Work Australia, Annual Wage Review 2012–13 statement [2012] FWAFB 9095 (25 October 2012).
clarify who are the professional, award-reliant employees and other award-reliant employees employed on the higher award classifications and ascertain the extent of award reliance in those groups,
investigate award reliance at the firm level—for example, what mix of employees within a firm are award-reliant and whether people at award-reliant firms are employed across the full range of classifications or are concentrated at particular classifications.
It is anticipated that a greater understanding of the nature of award reliance will, among other things, contribute to a better understanding of the differences in the impact of flat dollar minimum wage increases and percentage minimum wage increases.12
This project on award reliance was conducted to examine these issues. It was undertaken by the Workplace Research Centre, University of Sydney Business School (WRC) in collaboration with fieldwork company ORC International (ORC) on behalf of the Commission. It was supplemented by two other projects, one of which considered incentives to enterprise bargaining among a range of industries in Australia,13 and the other being a qualitative study of professionals and other employees on higher award classifications.14
The focus of the Award Reliance Survey was to quantitatively investigate award reliance across and within Australian workplaces, and to identify the mix or ‘categories’ of award-reliant employees and their location on award classification scales. The approach of undertaking the survey at the enterprise level was an important mechanism to provide this data given the lack of firm level data available by pay-setting arrangement. The project consists of a detailed examination of employment arrangements based on a sample of 11 534 organisations (of which 4270 were award-reliant and 7264 were not award-reliant).
The research also examined wage-setting practices of employers and reasons why employees were paid award rates. A particular focus was to identify professional and other award-reliant employees at higher classifications in order to gain a better understanding of these employees and, where possible, their location among award classifications.
In accordance with the parameters set by the Panel in its research program, the project had two main objectives. The first was to identify the incidence of award reliance across all non-public sector organisations and employees at the organisational level covered by the national workplace relations system.
The second was to identify the nature and extent of award reliance in organisations paying at least one employee exactly the award rate in order to:
identify award-reliant employees, and professional and other award-reliant employees on higher award classifications (including the characteristics of these employees);
investigate explanatory variables for award reliance among professional and other higher classification award-reliant employees; and
explore explanatory variables for award reliance at the organisation level.
This report is structured as follows. Chapter 2 outlines the research design, the definitions of key terms that were used to guide analysis, the sampling methodology and data collection techniques.
12
Annual Wage Review 2010–11 statement, [2010] FWA 7546 (1 October 2010). 13
Buchanan J et al. (2013), Minimum wages and their role in the process and incentive to bargain, Research Report 7/2013, December, Fair Work Commission, Melbourne.
14
Maltman K and Dunn A (2013), Higher classification/professional employee award reliance qualitative research: Consolidated report, Research Report No. 1/2013, Fair Work Commission, Melbourne, p. 72.
Chapter 3 and Chapter 4 provide details on the core findings from the study. For ease of
understanding, statistics on award reliance are reported separately for organisations (Chapter 3) and employees (Chapter 4).
Chapter 3 presents the findings on award reliance for non-public sector organisations. It covers such issues as what proportion of organisations are award-reliant and, in those organisations that are award-reliant, what their characteristics are in terms of organisation size, industry and location. This chapter also examines the reasons why award-reliant organisations have at least one employee whose pay is set exactly at the award rate.
Chapter 4 presents the findings on award reliance for employees in non-public sector organisations. This chapter deals with issues such as what proportion of employees are award-reliant and, of those employees who are award-reliant, what their characteristics are. Particular attention was paid to award reliance among employees working in industries with high levels of award reliance and to groups of employees known to be more likely to rely on award rates of pay such as juniors, apprentices, trainees and those working under the supported wage system.
Chapter 5 presents findings on award reliance for non-public sector organisations employing workers at higher award classifications, including those with employees in professional classifications. The chapter explores the characteristics of organisations that employ workers at higher award
classifications and their reasons for doing so. It also examines the characteristics of employees who have their pay set at higher award classification rates.
Chapter 6 provides a summary and conclusion.
2 Research Design
Chapter 2 presents an overview of the research design used to collect information on the incidence and nature of award-reliant organisations and their employees. Section 2.1 summarises the methods used to collect these data. Section 2.2 defines the terms used throughout this report. Section 2.3 presents an overview of the survey sample and Section 2.4 discusses limitations of the research design.
2.1
Data collection methodology
This research project examines the use and relevance of award wages and minimum wage
adjustments made by the Commission across a sample of non-public sector organisations covered by the national workplace relations system. Information was collected by means of a Computer-Assisted Telephone Interview (CATI) survey and an online survey with employers.
The survey completed using the CATI questionnaire gathered summary information on pay-setting arrangements across all non-public sector organisations, and identified organisations paying at least one employee at the exact applicable modern award rate.
More detailed information on the award classifications used to set pay for award-reliant employees, as well as disaggregated employment information by gender, hours worked and employment status, was collected in two separate ways.15
Organisations that used one modern award and employed fewer than 20 employees provided this information by continuing the original CATI questionnaire.
All other organisations were administered an online survey that they could complete after the CATI questionnaire.
2.2
Definitions
The following section discusses the definitions used throughout this report and how organisations and employees were classified by pay-setting arrangements, including awards.
2.2.1
Defining award reliance
There are two main terms used to describe award reliance among organisations. These are ‘award-reliant employees’ and ’award-reliant organisations’.
2.2.1.1 Award-reliant employees
As prescribed in the Fair Work Act, the Expert Panel for annual wage reviews may adjust minimum wages in modern awards and transitional instruments, and the national minimum wage order, from the previous annual wage review.16 The research in this report therefore focused on employees whose applicable instrument was a minimum wage instrument (specifically, a modern award) and whose wages were directly determined by the instrument for the base rate of pay. These employees are defined in this report as award-reliant employees and receive no payments over the amount in the
15
There were other characteristics of award-reliant employees that may have been of interest, such as age, tenure or educational qualification. Due to the potential burden on respondents and given the research was focussed on the
organisation level, it was not possible to collect data for characteristics in addition to gender, hours worked and employment status.
16
applicable minimum wage instrument.17 This definition is consistent with the award-only category featured in the Australian Bureau of Statistics’ (ABS) Employee Earnings and Hours (EEH) 2012 Survey.18
As a result, the definition of award-reliant employees for this survey included:
employees who had their pay set by transitional minimum wage arrangements in modern awards;
employees on individual arrangements but whose pay was set at exactly the applicable modern award rate;
employees who had their pay set by a non-registered enterprise agreement but who were paid at the exact applicable modern award rate; and
juniors, apprentices, trainees and employees under the supported wage system whose pay rate was set under the terms of the award as a proportion of the applicable rate in the modern award wage schedule.
Excluded from the definition of award-reliant employees were:
employees who had some or all of their conditions of employment set by an award, but were paid an amount ‘over’ or ‘above’ the applicable modern award rate; and
employees who had their pay set by a registered enterprise agreement—even if it was the same as the modern award rate.
It is not possible to directly compare the estimates of award-reliance in the Award reliance project with those estimates published in the ABS EEH 2012 Survey. While the definition for award-reliant
employees is consistent with the award-only category featured in the ABS EEH 2012 Survey, the approach used to collect data on pay-setting arrangements differs from the approach used in the ABS EEH 2012 Survey. The differences in methodology are set out in section 2.2.3.
2.2.1.2 Award-reliant organisations
An award-reliant organisation was defined as an organisation that employed at least one
award-reliant employee. Conversely, an organisation that did not have any award-reliant employees was defined as not award-reliant. Relevantly, there is no comparable equivalent data collected on award-reliant organisations in the ABS EEH 2012 Survey.
2.2.2
Defining higher classification (including professional) award-reliant
employees
To promote consistency, the definition of higher classification award-reliant employees draws on the conventions used by Maltman and Dunn19 where the key reference point is the C10 classification in
17
A useful summary of the research on award reliance is provided by Healy J et al. (2011), Research Framework and Data Collection Strategy, Research Report No. 4/2011, January, Fair Work Australia, Melbourne, pp. 26–29. Detailed longitudinal case studies of workplaces with at least one award-reliant employee are reported in Evesson J et al. (2010) Enterprise Case Studies: Effects of minimum wage setting at an enterprise level, Research Report No. 7/2010, February, Fair Work Australia, Melbourne. Useful material on definitional matters and qualitative insights into higher classification award-reliant employees is provided in Maltman K and Dunn A (2012), Higher classification/professional employee award reliance qualitative research: Interim report, Research Report No. 4/2012, February, Fair Work Australia, Melbourne.
18
ABS, Employee Earnings and Hours, Australia, May 2012, Catalogue No. 6306.0. 19
Maltman K and Dunn A (2013), Higher classification/professional employee award reliance qualitative research: Consolidated report, Research Report No. 1/2013, Fair Work Commission, Melbourne, p. 4.
the Manufacturing and Associated Industries and Occupations Award 2010. The qualitative nature of that study enabled Maltman and Dunn to investigate a wide array of factors that lead to award
reliance at higher classifications, and the impact of award reliance at higher classifications. In defining higher classifications, they drew on a number of sources including the Fair Work Act, annual wage review decisions, materials from the award modernisation process, modern awards and other data.20 The conduct of a large scale survey requires that a more limited range of sources and indicators are used to categorise employees as ‘higher’ or ‘professionally’ classified. For the purpose of this study, a higher classification award-reliant employee was defined as any non-public sector employee whose pay was set above the C10 rate in the Manufacturing and Associated Industries and Occupations Award 2010. At the time of conducting the Award reliance study, this meant that a higher classification award-reliant employee was paid a basic hourly rate of more than $18.58. This was rounded to $18.60 when presented to survey respondents in questions regarding pay ranges. The equivalent casual rate was $23.25 per hour, the equivalent weekly rate was around $707.00 and the equivalent annual rate was more than $36 720. Lower classification employees were paid at or less than $18.60 per hour (or equivalent).21 Further discussion on the common ranges used in modern awards is presented in Appendix A.
It was not possible to directly identify award-reliant professional employees through the Award Reliance Survey. Instead, a subset of higher classification award-reliant employees was identified by proxy. Earlier research had revealed that 36 modern awards contained professional classifications.22 These awards were coded as containing ‘professional classifications’ where the positions required tertiary/university level qualifications (excluding vocational education and training qualifications) or highly specialised knowledge or skills were integral to the award classification. Information from higher paid employees covered by these awards was analysed separately as a distinct population and treated as indicative of the situation prevailing among ‘award-reliant professio