Eective Visualization of Large
Multidimensional Datasets
by
Christopher G. Healey
B.Math, The University of Waterloo, 1990 M.Sc., The University of British Columbia, 1992
A Thesis Submitted in Partial Fulfilment of the Requirements for the Degree of
Doctor of Philosophy
in the Faculty of Graduate Studies Department of Computer Science
We accept this thesis as conforming to the required standard
T H E U N I V E R S I T Y O F B R I T I S H C O L U M B I A
c
In presenting this thesis in partial fullment of the requirements for an advanced degree at the University of British Columbia, I agree that the Library shall make it freely available for reference and study. I further agree that permission for extensive copying of this thesis for scholarly purposes may be granted by the head of my department or by his or her representatives. It is understood that copying or publication of this thesis for nancial gain shall not be allowed without my written permission.
Department of Computer Science The University of British Columbia 2366 Main Mall
Vancouver, Canada V6T 1Z4
Abstract
A new method for assisting with the visualization of large multidimensional datasets is proposed. We classify datasets with more than one million elements as large. Multidimen-sional data elements are elements with two or more dimensions, each of which is at least bi-nary. Multidimensional data visualization involves representation of multidimensional data elements in a low dimensional environment, such as a computer screen or printed media. Traditional visualization techniques are not well suited to solving this problem.
Our data visualization techniques are based in large part on a eld of cognitive psychology called preattentive processing. Preattentive processing is the study of visual features that are detected rapidly and with little eort by the human visual system. Examples include hue, orientation, form, intensity, and motion. We studied ways of extending and applying research results from preattentive processing to address our visualization requirements. We used our investigations to build visualization tools that allow a user to very rapidly and accu-rately perform exploratory analysis tasks. These tasks include searching for target elements, identifying boundaries between groups of common elements, and estimating the number of elements that have a specic visual feature. Our experimental results were positive, sug-gesting that dynamic sequences of frames can be used to explore large amounts of data in a relatively short period of time.
Recent work in both scientic visualization and database systems has started to address the problems inherent in managing large scientic datasets. One promising technique is knowledge discovery, \the nontrivial extraction of implicit, previously unknown, and poten-tially useful information from data". We hypothesise that knowledge discovery can be used as a lter to reduce the amount of data sent to the visualization tool. Data elements that do not belong to a user-chosen group of interest can be discarded, the dimensionality of indi-vidual data elements can be compressed, and previously unknown trends and relationships
can be discovered and explored.
We illustrate how our techniques can be used by applying them to real-world data and tasks. This includes the visualization of simulated salmon migration results, computerized tomography medical slices, and environmental datasets that track ocean and atmospheric conditions.
Contents
Abstract
ii
Table of Contents
iv
List of Tables
viii
List of Figures
ix
Acknowledgements
xii
Chapter 1 Introduction
1
1.1 Research Goals . . . 3
Standard Visualization Systems . . . 4
Multidimensional Visualization Techniques . . . 5
Hybrid Visualization Packages . . . 6
1.2 Research Overview . . . 6
1.3 Multidimensional Visualization . . . 7
1.4 Knowledge Discovery . . . 12
1.5 Contributions . . . 15
Chapter 2 Preattentive Processing
18
2.1 Feature Integration Theory . . . 202.2 Texton Theory . . . 24
2.3 Similarity Theory . . . 26
2.4 Guided Search Theory . . . 29
2.5 Interference Experiments . . . 31
2.6 Three-Dimensional Icons . . . 34 iv
2.7 Motion and Depth . . . 38
2.8 Iconographic Displays . . . 41
Chapter 3 Preattentive Estimation
45
3.1 Salmon Migration Simulations . . . 47Task Selection . . . 50
3.2 Original Estimation Experiments . . . 51
3.3 Experiment 1: Display Duration . . . 55
3.4 Experiment 2: Feature Dierence . . . 58
Chapter 4 Colour and Orientation
62
4.1 Properties of Colour . . . 634.2 CIE XYZ Colour Model . . . 64
4.3 Monitor RGB Colour Model . . . 67
4.4 CIE LUV Colour Model . . . 69
4.5 Munsell Colour Model . . . 71
4.6 Colour in Scientic Visualization . . . 73
4.7 Colour in Preattentive Processing . . . 80
4.8 Linear Separation Eect . . . 85
4.9 Colour Category Eect . . . 89
4.10 Orientation and Texture . . . 91
Chapter 5 Eective Colour Selection
98
5.1 Colour Selection Technique . . . 995.2 Estimating Monitor Gamut . . . 101
5.3 Segmenting Colour Regions . . . 106
Method . . . 109
Results . . . 110
5.4 Evaluating Colour Categories . . . 115
Method . . . 115
Results . . . 117
5.5 Perceptual Overlap . . . 118
5.6 Experiment 1: Distance and Separation . . . 121
Method . . . 124
Results . . . 128
5.7 Colour Category Integration . . . 133 v
5.8 Experiment 2: Colour Category . . . 135
5.9 Experiment 3: Colour Selection . . . 137
Chapter 6 Real-Time Visualization
139
6.1 Experiment 1: Boundary Detection . . . 141Method . . . 143
Results . . . 148
6.2 Experiment 2: Target Detection . . . 151
Method . . . 152
Results . . . 156
Chapter 7 Dataset Management
160
7.1 Database Management Systems . . . 1627.2 Knowledge Discovery . . . 167
7.3 Managing Large Multidimensional Datasets . . . 170
7.4 Decision Trees . . . 172
7.5 Statistical Tables . . . 176
7.6 Interval Classication . . . 179
7.7 Rough Sets . . . 183
Chapter 8 Knowledge Discovery in Visualization
189
8.1 Classication Weights . . . 191 Decision Trees . . . 192 Statistical Tables . . . 193 Interval Classication . . . 193 Rough Sets . . . 194 8.2 Results . . . 195 Decision Trees . . . 196 Statistical Tables . . . 198 Interval Classication . . . 199 Rough Sets . . . 1998.3 Attribute Signicance Weights . . . 204
Decision Trees . . . 205
Statistical Tables . . . 206
Interval Classication . . . 207
Rough Sets . . . 207 vi
8.4 Results . . . 208
Chapter 9 Future Work and Applications
210
9.1 Texture . . . 2109.2 Emergent Features . . . 213
9.3 Practical Applications . . . 214
Oceanography . . . 216
Computerized Tomography Slices . . . 219
Sea Surface Temperatures . . . 223
Bibliography
231
List of Tables
2.1 Preattentive Visual Features . . . 20
5.1 Grey-Line Colour Names . . . 112
5.2 User-Chosen Category Names . . . 118
5.3 Perceptual Overlap Table . . . 120
5.4 Distance and Separation Values . . . 125
5.5 Colour Selection Experiment Summary . . . 127
5.6 Seven-Colour Overlap Table . . . 134
5.7 Neighbour and Linear Separation Distances . . . 136
7.1 Knowledge Discovery Glossary . . . 172
7.2 Interval Classication Grouping . . . 177
7.3 Interval Classication Training Set Example . . . 180
7.4 Range Boundary Frequency Calculation . . . 182
8.1 Decision Tree Leaf Node . . . 192
8.2 Signicance Weight Table . . . 208
9.1 Oceanography Dataset Format . . . 218
9.2 Oceanography Attribute-Feature Mapping . . . 218
9.3 CT Dataset Format . . . 219
9.4 CT Intensity Ranges . . . 220
9.5 CT Attribute-Feature Mapping . . . 222
9.6 COADS Dataset Format . . . 224
9.9 COADS Attribute Ranges . . . 225
9.10 Classication Error Rates . . . 226
9.11 Filtered Classication Error Rates . . . 226
List of Figures
1.1 Research Map . . . 16
2.1 Target Detection . . . 19
2.2 Boundary Detection . . . 21
2.3 Feature Map From Early Vision . . . 23
2.4 Textons . . . 25
2.5 N-N Similarity. . . 27
2.6 Guided Search Theory . . . 30
2.7 Form and Hue Segregation . . . 32
2.8 Hue and Brightness Segregation . . . 32
2.9 Three-Dimensional Icons . . . 35
2.10 Emergent Features . . . 36
2.11 Emergent Feature Targets . . . 37
2.12 Size and Deformation Motion . . . 40
2.13 \Stick-Men" Icons . . . 42
2.14 Cherno Faces . . . 44
3.1 British Columbia Coast . . . 48
3.2 OSCURS Example Output . . . 49
3.3 Example Estimation Experiment Displays . . . 53
3.4 Hue Estimation Display Duration vs. Mean Error . . . 56
3.5 Orientation Estimation Display Duration vs. Average Error . . . 57
3.6 Hue Estimation Feature Dierence vs. Average Error . . . 59
3.7 Orientation Estimation Feature Dierence vs. Average Error . . . 60
4.1 Colour Wavelength Graph . . . 63
4.2 RGB and XYZ Colour Matching Curves . . . 65
4.3 CIE Chromaticity Diagram . . . 67 ix
4.4 RGB Colour Cube . . . 68
4.5 Munsell Colour Space . . . 72
4.6 Coherency Visualization . . . 74
4.7 Critical Colour Dierence . . . 83
4.8 Boundary Colour Positions . . . 84
4.9 Linear Separation Experiments . . . 87
4.10 Linear Separation in CIELUV . . . 88
4.11 Colour Category Experiments . . . 90
4.12 Orientation Category Examples . . . 93
5.1 Constant Colour Distance and Linear Separation . . . 101
5.2 Estimating Boundary Lines . . . 102
5.3 Computing Convex Polytope . . . 104
5.4 Inscribed Circle Within Polytope . . . 105
5.5 Monitor RGB Segmentation . . . 111
5.6 HSV Segmentation . . . 113
5.7 LUV Segmentation . . . 114
5.8 LUV Circle Segmentation . . . 116
5.9 Example Experiment Displays . . . 123
5.10 Monitor's Gamut at L=67.1 . . . 125
5.11 3-Colour and 5-Colour Response Time Graphs . . . 129
5.12 7-Colour and 9-Colour Response Time Graphs . . . 131
5.13 Colour Category Response Time Graphs . . . 135
5.14 Colour Selection Response Time Graphs . . . 138
6.1 Hue Boundary Detection Examples . . . 145
6.2 Form Boundary Detection Examples . . . 146
6.3 Boundary Detection: Error vs. Exposure Duration Graph . . . 150
6.4 Hue Target Detection . . . 154
6.5 Form Target Detection . . . 155
6.6 Target Detection: Error vs. Exposure Duration Graph . . . 157
7.1 Decision Tree Example . . . 175
7.2 Rough Set Diagram . . . 184
8.1 Decision Tree Classication Error Graph . . . 197 x
8.2 Statistical Table Classication Error Graph . . . 200
8.3 Interval Classication Error Graph . . . 201
8.4 Rough Set Classication Error Graph . . . 203
8.5 Signicance Values for Decision Trees . . . 206
9.1 Varying Texture Dimensions . . . 212
9.2 Visualizing Salmon with Emergent Features . . . 215
9.3 Sample PV Output . . . 217
9.4 Examples CT Image Slices . . . 221
9.5 Worldwide Sea Surface Temperatures . . . 228
9.6 North American Sea Surface Temperatures . . . 229
Acknowledgements
A lot of dierent people helped me with various parts of this thesis. Technical support, moral support, mental support, you name it.
I want to thank both mysupervisors, KellyBooth and JimEnns, for their advice, support, and guidance. I would also like to thank my committee members, Dr. Alain Fournier, Dr. Raymond Ng, Dr. Uri Ascher, Dr. Peter Graf, and Dr. Brian Funt, for the time and eort they spent to read and comment on my work.
Ron Rensink wrote the software which was used to run a number of our experiments. He also provided many helpful references in the area of preattentive processing. Ron was the one who introduced me to both preattentive processing and Jim Enns, so if I ever become famous, he can tell everyone \I'm the one who started his career".
I have friends here, but some have been with me (on and o) longer than others. In no particular order: Bill Gates, Gwen Litcheld, Raza Khan, and Vishwa Ranjan. There are also some people who left early, but with whom I still keep in touch: Chris Romanzin and Pierre Poulin.
The most important \acknowledgement" goes to my parents and my girlfriend. My parents put up with me for the rst twenty-four years. Hiroko put up with me for the last ve. I'm not sure who did more work. Either way, they both loved me, supported me, and pushed me when I needed motivation. What more could you ask for?
Chapter 1
Introduction
Scientic visualization in computer graphics is a relatively new eld of research. The term \visualization" was used during a 1987 National Science Foundation (NSF) panel report on how to apply computer science techniques to data analysis problems [McCormick et al., 1987]. The panel dened the domain of visualization to be the development of general purpose tools and the study of research problems that arise in the process. Participants on the panel emphasised a number of research goals, specically:
visualization should combine research results from dierent disciplines (e.g., computer
science, computer graphics, psychology, and visual arts)
visualization should address both the intelligent display of data and the intelligent
management of the underlying dataset
visualization does not have to be complicated in order to be useful
visualization should be performed interactively while the data is being generated
Panel members at a similar visualization roundtable noted that the desire for computer-based data visualization arose from the need to analyse larger and more complex datasets [Wolfe and Franzel, 1988]. Scienticvisualization has grown rapidly in recent years as a direct
Chapter 1. Introduction
2
result of the overwhelming amount of data being generated. New visualization techniques need to be developed that address this \rehose of information" if users hope to analyse even a small portion of their data repositories.
Many traditional computer software tools are now being extended to provide user in-teraction and real-time visualization of results. For example, visual interactive simulation studies ways of adding useful visualization and user interaction components to simulation programs [Hurrion, 1980; Bell and O'Keefe, 1987; Bell and O'Keefe, 1994]. Other types of applications also need to display data in real-time. In air trac control screens are often shared by dierent operators who acquire visual data from dierent parts of the display at the same time. Visualization techniques for this environment must allow a variety of tasks to be performed rapidly and accurately on dynamically changing subsets of the overall display. Medical imaging systems such as CT, MRI, PET, and ultrasound are another type of ap-plication that could benet from real-time visualization. Techniques that allowed rapid and accurate visual analysis of more than one aspect of the data might decrease the amount of time needed to complete the diagnostic task. This is important, since these types of systems often cannot be time-shared by multiple users. Any improvement in visualization would in-crease total throughput for the system. Moreover, better displays might reduce errors made during analysis. Even a small increase in accuracy is important in this type of environment. A variety of methods have been used to convert raw data into a more usable visual for-mat. Both Tufte [1983, 1990] and Collins [1993] give an interesting review of pre-computer visualization techniques. Two of the best known examples are maps and the conversion of nu-meric data into dierent types of graphs. Diverse solutions for displaying high-dimensional datasets in a low-dimensional environment such as the computer screen have been pro-posed [Pickett and Grinstein, 1988; Ware and Beatty, 1988; Grinstein et al., 1989; Enns, 1990a; Enns, 1990b]. Specialized software tools such as the Application Visualization Sys-tem (AVS), apE, VIS-5D, and the Wavefront Data Visualizer [Upson, 1989; Hibbard and
Chapter 1. Introduction
3
Santek, 1990; Vande Wettering, 1990] have been developed for performing visualization on computer graphics workstations.
A recent update on the NSF visualization report described research being performed at a number of academic institutions [Rosenblum, 1994]. Although many visual presentation techniques have been studied (e.g., volume visualization, uid ow, and perceptual visual-ization), much less work has focused on formulating guidelines for their design. Results in this thesis are meant to address this more general issue.
1.1 Research Goals
Our goal is the investigation and development of techniques for visualizing rapidly and accu-rately large multidimensional datasets. We formally dene \large" and \multidimensional" as follows:
large: the size of a dataset is the combination of two separate characteristics: the
absolute number of data elements within a single data frame, and the number of data frames that make up the dataset
multidimensional: the dimensionality of a data element also depends on two separate
characteristics: the number of dierent attributes or dimensions embedded in the el-ement, and the number of unique values each attribute can represent (e.g., a binary, multivalued, or continuous attribute)
A typical workstation monitor has a resolution of approximately one million pixels. This represents a limit on the number of data elements (one per pixel) that can be displayed on a single screen. We dene large to be a dataset with more than one million elements (i.e.,
Chapter 1. Introduction
4
more than can be displayed on a single screen). We dene multidimensional to be a data element with two or more dimensions, where each dimension is at least binary.
It is important to understand how existing visualization systems and techniques address our problem environment. We describe three types of visualization environments: standard visualization systems, multidimensional visualization techniques, and hybrid visualization packages that have access to an underlying database management system.
Standard Visualization Systems
A number of specialized software tools (e.g., AVS, apE, Wavefront Data Visualizer, and Iris Explorer) have been developed to perform scientic visualization on computer graphics workstations. These systems have the potential to visualize large multidimensional datasets, in particular because they are extensible and because they support a wide range of simple visual presentation methods. In spite of this, we feel these systems are missing a number of key components that are necessary for solving the multidimensional visualization problem. First, the built-in data management facilities are usually limited to reading and writing les, plus simple ltering using comparison operators. Attempts to process large datasets often result in the visualization tool being overwhelmed by the amount of data that needs to be managed. Beyond that, no rules or guidelines are provided to deal specically with displaying either large or multidimensional datasets. Users are left to answer key questions on their own, such as: How can I display a dataset that does not \t" in one screen? How can I eectively display multidimensional data elements? How can I show structure in the data (e.g., coherent regions, related elements, elements with unique attributes)? These packages oer a exible foundation for building tools that deal with visualization of large multidimensional datasets, but proper data management and visualization techniques must rst be identied and made available to the user. This thesis investigates exactly these kinds
Chapter 1. Introduction
5
of data management and visualization guidelines.
Multidimensional Visualization Techniques
Our research focuses on multidimensional data visualization. We are trying to address the question: How can I display multidimensional data in a spatially low-dimensional envi-ronment, such as a computer screen or printed media? Researchers have approached this problem in dierent ways. Enns and Rensink [1990a, 1990b] discuss using the human visual system to eciently process multidimensional datasets; they describe geometric icons that combine the power of the computer and the human visual system. Ware and Beatty [1988] have designed a method that uses colour and spatial location to represent multidimensional data elements; subsets of the data with similar values appear as a spatial \cloud" of similarly coloured squares. Pickett and Grinstein [1988, 1989] use results from cognitive psychology as a basis for the design of their visualization tools; they display structure in the data as a set of textures and boundaries, so that groups of data elements with similar values appear as a spatial group with a unique texture in the display. None of these techniques explicitly address the problem of large datasets since they are restricted to, at best, the number of pixels that can be displayed on a single screen. Some of the techniques are limited to a spe-cic task, for example, Ware and Beatty's tool helps a user perform coherency testing, while Pickett and Grinstein's displays regions and boundaries in a dataset. An important question to ask is whether additional visual features can be integrated into any of these techniques. For example, could Pickett and Grinstein use colour to encode additional information in their displays? Variations in colour might mask texture boundaries during visualization, or vise-versa. Finally, it is dicult to see how either Ware and Beatty or Enns and Rensink could easily extend their techniques to handle higher dimensional data elements.
Chapter 1. Introduction
6
Hybrid Visualization Packages
In order to address management of large datasets, researchers are now studying the useful-ness of visualization tools that are a combination of a commercial database package (DBMS) and a visualization system like those described above [Kochevar et al., 1993; Stonebraker et al., 1993]. Because both the visualization system and the DBMS are extensible, it is relatively easy to provide a layer of software to \glue" the two systems together. This makes the functionality of the underlying database available from within the visualization system, dramatically enhancing both the scope and eciency of data management opera-tions. Unfortunately, this does not address all of the problems related to the display of large or multidimensional datasets. Most of the currently available DBMSs are relational. Many scientic datasets contain errors, missing values, or noise, all of which are dicult to rep-resent in a relational database. Relational DBMSs have diculty supporting datasets that do not map conceptually to a relational model (e.g., spatial or temporal datasets). Finally, some of the most promising new data management techniques such as statistical databases, classication, temporal databases, spatial data handling, and knowledge discovery are not immediately available and are dicult to provide, even given the extensibility of the current DBMSs.
1.2 Research Overview
Our investigation of the problem of visualizing large multidimensional datasets is made up of two parts. First, we studied new methods for visualizing multidimensional data. Our techniquesaddress the problemsof dataset size and data elementdimensionalityby exploiting the built-in processing of the human visual system. Second, we studied the eectiveness of a new database technique, knowledge discovery, for compressing and summarizing the
Chapter 1. Introduction
7
important details buried in large datasets. We used our results to design visualization tools that allow users to perform rapid and accurate exploratory analysis tasks such as target detection, boundary detection, region tracking, and estimation. Users can lter their dataset using dierent knowledge discovery algorithms to reduce both its size and dimensionality. The resulting data is displayed in a 2D spatial environment (the computer screen) using visual features such as hue and orientation. Large datasets are divided into sequences of data frames; the frames are displayed rapidly (usually with an exposure duration of 250msec or less per frame) one after another in an animated, movie-like fashion. This allows a user to explore large amounts of data in a relatively short period of time.
The next two sections provide a brief overview of our research and the results we obtained. Each section is divided by chapter titles. More detailed descriptions of our work can be found in the corresponding chapters.
1.3 Multidimensional Visualization
Within the multidimensional visualization context, we focused on techniques for performing rapid and accurate exploratory data analysis. This type of analysis is used to inspect a dataset and quickly identify areas that might benet from further, more detailed investiga-tion. The kinds of tasks performed during this stage of analysis include:
target detection, where users attempt to rapidly and accurately detect the presence or
absence of a \target" element in a display
boundary detection, where users attempt to rapidly and accurately identify boundaries
between groups of elements, where all the elements in each group have some property in common
Chapter 1. Introduction
8
region tracking, where users attempt to track groups of elements with a common
prop-erty as they move through time and space
counting and estimation, where users attempt to count or estimate the number or
percentage of elements in a display that have a specic attribute
We believe results from research in preattentive processing can be used to assist with the design of visualization tools that perform these kinds of tasks.
Chapter 2: Preattentive Processing
Researchers in psychology and vision have been working to explain how the human visual system analyses images. One interesting result has been the discovery of visual properties that are \preattentively" processed. These properties are detected immediatelyby the visual system. Viewers do not have to focus their attention on an image to determine whether elements with a given property are present or absent. Examples of common preattentive features include hue, intensity, orientation, length, and motion. Unfortunately, choosing visual features in an ad hoc manner and matching them to data attributes will not necessarily result in preattentive displays. Indeed, too often the tool itself inhibits the user's ability to extract the desired information. Results from research in preattentive processing can be used to identify and avoid this kind of visual interference.
Properties that are processed preattentively can be used to highlight important image characteristics. Experiments in psychology by Triesman, Julesz, Quinlan, and others have used preattentive features to assist in performing exactly the visual tasks listed above. Re-search in visualization has shown that preattentive features allow users to better perform visual tasks such as grouping of similar data elements, detection of elements with a unique characteristic, and estimation of the number of elements with a given value or range of values [Pickett and Grinstein, 1988; Grinstein et al., 1989; Healey et al., 1993; Healey et al., 1996].
Chapter 1. Introduction
9
The key advantage of preattentive visualization techniques is that they are rapid (a preat-tentive task can usually be completed in less than 250msec, moreover, the time required to complete the task is independent of the number of data elements being displayed) and accurate.
Chapter 3: Preattentive Estimation
Target detection, boundary detection, and grouping (for a single data frame) have been studied in depth in the preattentive processing literature [Julesz, 1981; Julesz and Bergen, 1983; Triesman, 1985; Triesman and Gormican, 1988; Duncan and Humphreys, 1989; Muller et al., 1990]. These results can be extended directly to scientic visualization. Researchers have also studied counting and enumeration in the low-level visual system [Varey et al., 1990; Trick and Pylyshyn, 1994]. Our work investigated another common analysis task, relative estimation, that had not been studied by the preattentive processing community. Our initial results showed that estimation using either hue or orientation was, in fact, preattentive [Healey et al., 1993]. We extended these results by answering three additional questions related to the use of hue and orientation during preattentive estimation [Healey et al., 1996]:
How are hue and orientation estimation aected by varying display duration? How are hue and orientation estimation aected by varying feature dierence?
What is the tradeo between display duration and feature dierence during estimation?
We chose hue and orientation because they are two features that are commonly used in existing visualization software. Both hue and orientation have been shown to be preatten-tive by Triesman, Julesz, and others [Julesz and Bergen, 1983; Triesman, 1985; Quinlan and Humphreys, 1987]. Moreover, research has shown that hue exhibits a strong interference ef-fect over form (or orientation) during certain preattentive tasks [Callaghan, 1984; Callaghan,
Chapter 1. Introduction
10
1989; Healey et al., 1996]. Understanding how hue and orientation interact in a preattentive visualization environment is important. If a visualization tool is being used to display multi-ple independent data values, interference among features must be avoided. If a visualization tool is being used to investigate a specic relationship, the \strongest" feature should be used to encode that relationship. Secondary features used to encode additional data values should not interfere with the primary feature and task.
Chapter 4: Colour
Colour is a common and often-used visual feature. Unfortunately, choosing colours for data visualization is complicated, since a number of dierent factors can aect the interac-tions that occur between colours. We completed a thorough review of colour in preparation for measuring and controlling these eects. Colour is studied from three dierent perspec-tives. First, we describe various three-dimensional models used in computer graphics to accurately represent colour. Next, we examine research on the use of colour in scientic visualization. Finally, we investigate how colour has been studied in the context of preat-tentive processing. This background information identies three separate factors that can be used to measure the eectiveness of a set of colours for representing data values during scientic visualization: colour distance, linear separation, and colour category.
Chapter 5: Eective Hue Selection
Multidimensional visualization techniques must be able to encode data dimensions with more than two individual values. Our preattentive estimation experiments were restricted to data dimensions that were binary, since we wanted to pick hues (and orientations) that were easy to distinguish from one another. This is simple to do when only two dierent values are required (e.g., during estimation two distinct hues, blue and red, were chosen). Continuous data attributes used during our experiments had to be split into two discrete
Chapter 1. Introduction
11
ranges, to \t" our visualization design. In order to move beyond this restriction, we wanted to identify methods for mapping multivalued data attributes onto visual features such as hue and orientation, while still allowing rapid and accurate analysis on the resulting displays. The selection of multiple orientations for use during preattentive tasks has been studied in the preattentive processing literature [Nothdurft, 1985a; Nothdurft, 1991; Wolfe et al., 1992]. We investigated methods for selecting multiple hues for use during visualization by answering the following three questions:
How can we support rapid and accurate identication of individual data elements
through the use of colour?
What factors determine whether a \target" element's colour will make it easy to nd,
relative to dierently coloured \non-target" elements?
How many colours can we display at once, while still allowing for rapid and accurate
target identication?
Results from our experiments showed that we need to consider three separate factors when selecting multiple hues: colour distance, linear separation, and colour category. We developed simple methods for measuring and controlling each of these eects. This allowed us to chose up to seven isoluminant hues for use during visualization. Each hue was equally distinguishable, and each could be identied preattentively in our data displays.
Chapter 6: Real-Time Visualization
A key consideration for visualizing large datasets involves the dierence between static and dynamic data frames. A static frame is shown to a user in isolation. The user then decides how to proceed based on information in the frame. Research to date in preattentive visualization has been restricted to static frames. Unfortunately, this limits the display
Chapter 1. Introduction
12
technique to the resolution of the screen. An obvious question to ask is: If I can perform tasks in 200msec on a static frame, can I perform the same tasks on an sequence of frames displayed at ve frames per second? A dynamic environment displays a sequence of frames to the user one after another in a movie-like fashion. Each frame is shown for a xed period of time, after which it is replaced by the next frame in the sequence. The advantage of such a technique is the ability to scan through large amounts of data in a relatively short period of time. Suppose a data frame displays 400 elements. Since each element in the frame has an available screen region of approximately 5050 pixels, it can use visual features an
individual pixel cannot (e.g., shape, size, orientation, length). A dynamic sequence of ve frames per second could display one million elements in about nine minutes. Even if a user spent 20% of their time browsing the dataset and 80% performing more detailed analysis on individual frames, we can still exceed the display bounds of a single workstation screen in less than an hour. The ability to perform exploratory analysis in real-time allows us to access a large dataset in its entirety.
We show through a set of experiments that important aspects of preattentive processing extend to a real-time environment. A visualization tool that uses preattentive features allows users to perform rapid and accurate target and boundary detection, all in real-time on temporally animated data frames. Moreover, interference properties previously reported for static preattentive visualization were found to exist (with similar consequences) in the dynamic environment.
1.4 Knowledge Discovery
Current database research is extending the original database model in a number of novel and interesting ways. An NSF panel on advanced database systems described the focus
Chapter 1. Introduction
13
of past research, and presented a strong argument for continued work [Silbershatz et al., 1990]. Panel members felt rapid advances in a number of areas that use databases are overwhelming currently available data management techniques. Scientic visualization was specically cited as an area that is moving beyond the boundaries of traditional database systems. The panel identied the following problems as essential to future database research:
new data models that deal with complex objects such as spatial data, time, and
un-certainty
query and access methods to manage very large databases (i.e., over one terabyte in
size); this involves the scaling of current algorithms, the development of new storage and access techniques, and support for heterogeneous, distributed databases
the ability to \mine" implicit patterns, trends, or relationships from very large
scien-tic, biomedical, or business databases
the ability to embed and process eciently declarative and imperative rules within a
database
The NSF panel discussed at some length scientic visualization and the problems inherent in managing scientic datasets. An area of research well suited to address this problem is knowledge discovery, \the nontrivial extraction of implicit, previously unknown, and poten-tially useful information from data" [Frawley et al., 1991]. Statistical, database, and machine learning algorithms can be combined to uncover trends, dependencies, and relationships im-plicit in large multidimensional datasets.
Chapter 7: Dataset Management
We believe that knowledge discovery techniques can be used to improve multidimensional data visualization. These techniques would lie between the visualization tool and the
under-Chapter 1. Introduction
14
lying dataset, acting as a lter to mark or compress regions of interest in the data. Although there is always a measure of uncertainty in the results returned by knowledge discovery al-gorithms, they seem well suited to an exploratory data analysis environment. A user could control, combine, and most importantly analyse the results of knowledge discovery against what is known about the original dataset. Users could interactively choose to pursue or ignore trends, dependencies, or groupings the algorithms suggest. Dierent techniques could be combined in various ways to improve results or increase condence in the information being provided. Knowledge discovery could be used to advance our goal of visualizing large multidimensional datasets in the following ways:
reducing the amount of data to be visualized, by classifying data elements into groups
and ignoring groups that do not contribute to the relationship being investigated
reducing the number of attributes associated with each data element, by using a
dis-covered classication to replace multiple data dimensions
reducing the number of attributes associated with each data element, by ignoring
dimensions that are independent of the relationship being investigated
showing structure in the dataset; this goes beyond simply showing whether data
ele-ments are coherent or not
compressing time-varying data along the time axis, to reduce the amount of data to
visualize, and the length of any corresponding \animation" of the data frames
nding and visualizing previously unknown trends or relationships within or among
Chapter 1. Introduction
15
Chapter 8: Knowledge Discovery in VisualizationFour dierent knowledge discovery algorithms were implemented and integrated into our visualization environment. Each algorithm was modied to identify attribute dependencies that were found when classication rules were built. The algorithms were also extended to provide condence weights for each classication they performed. This allows a user to assess the condence an algorithm attaches to a particular result. The eectiveness of knowledge discovery in scientic visualization was measured by examining the increased accuracy and size reductions obtained when we visualized NASA's Comprehensive Ocean-Atmospheric Data Set.
1.5 Contributions
The research reported in this thesis directly addresses the requirements put forward by the NSF and other visualization panels. Figure 1.1 provides an overview of how our dierent experiments t within the overall goal of visualizing large, multidimensional datasets. Our techniques build on earlier research in computer graphics, databases, and cognitive psy-chology. Preattentive visualization is computationally simple, which makes it applicable to interactive environments such as real-time displays and visual interactive simulation. Our research investigates both the display of data elements and management of the underlying dataset. We believe that our work contributes the following advances to current research in visualization, preattentive processing, and database systems.
1. Hue and orientation feature spaces have been investigated more fully. We determined through experimentation both the perceived feature dierence and the display duration needed to perform an estimation task using either hue or orientation. We also measured the tradeo between these two properties.
Chapter 1. Introduction
16
- Colour Selection:
hues which can be rapidly and accurately distinguished from one another during visualization
Method for choosing multiple - Preattentive Estimation:
in a single display Hue and orientation do not interfere with one another during estimation, so they can be used simultaneously
Knowledge Discovery: Compress multiple attributes into a single classification value; identify significant attributes during classification
-- Knowledge Discovery: Compress size of dataset by classifying, then displaying elements with a specific classification value
Real-Time Visualization: Allows a user to rapidly and accurately visualize large datasets in their entirety -Number of Elements Number of Attribute Values Dimensionality
Large, Multidimensional Datasets
Figure 1.1: An overview of how research reported in this thesis addresses the three types of large (total number of elements, dimensionality of each element, and the number of unique values for each attribute) inherent in large, multidimensional datasets
2. Methods for mapping hue and orientation onto multivalued data attributes were in-vestigated. Our techniques describe how to choose multiple hues and orientations that allow rapid and accurate analysis on the resulting displays.
3. Experiments were conducted to show that traditional preattentive tasks such as target detection and boundary detection (and associated interference eects) extend to an environment where dynamic sequences of frames are displayed rapidly one frame after another.
4. Various knowledge discovery algorithms were investigated in the context of exploratory data analysis. Normalized condence weights were provided for each task the algo-rithms performed so that users could assess the condence an algorithm assigned to the results it returned.
Chapter 1. Introduction
17
The results we provide in each of these areas should help to improve understanding of sci-entic visualization in general, and visualization of large multidimensional datasets in par-ticular. Our results can be interpreted as a set of general guidelines for the use of common visual features such as hue, form, and orientation. The results also help to describe the eects of visual phenomena such as feature interference and emergent features in scientic visualization. Finally, the integration of knowledge discovery into a visualization environ-ment demonstrates that intelligent manageenviron-ment of the underlying dataset can reduce both the amount and the dimensionality of the data that is displayed to the user.
Chapter 2
Preattentive Processing
For many years vision researchers have been working to explain how the human visual system analyses images. One very interesting result has been the discovery of a limited set of visual properties that are processed preattentively, without the need for focused attention. Typically, tasks that can be performed on large multi-element displays in less than 200 to 250msec are considered preattentive. Eye movements take at least 200msec to initiate, and random locations of the elements in the display ensure that attention cannot be prefocused on any particular location, yet subjects report that these tasks can be completed with very little eort. This suggests that certain information in the display is processed in parallel by the low-level visual system.
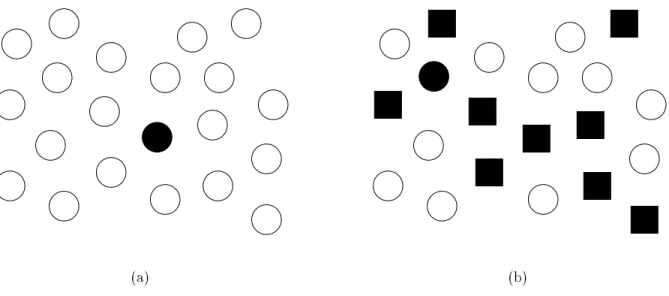
A simple example of preattentive processing is the detection of a lled circle in a group of empty circles (Figure 2.1a). The target object has the visual feature \lled" but the empty distractor objects do not (all nontarget objects are considered distractors). A viewer can tell at a glance whether the target is present or absent.
Objects that are made up of a conjunction of unique features cannot be detected preat-tentively. A conjunction target item is one that is made up of two or more features, only one of which is contained in each of the distractors. Figure 2.1b shows an example of conjunction search. The target (again a lled circle) is made up of two features, lled and circular. One
Chapter 2. Preattentive Processing
19
(a) (b)
Figure 2.1: Examples of target detection: (a) lled circle target can be preattentively detected because it contains the unique feature \lled"; (b) lled circle target cannot be preattentively detected because it contains no preattentive feature unique from its distractors
of these features is present in each of the distractor objects (lled squares and empty circles). Numerous studies show that the target cannot be preattentively detected, forcing subjects to search serially through the display to nd it.
Visual properties that are processed preattentively can be used to highlight important image characteristics. Table 2.1 lists some of the visual features that have been identied as preattentive. Experiments in psychology have used these features to perform the following preattentive visual tasks:
target detection, where users attempt to rapidly and accurately detect the presence or
absence of a \target" element with a unique visual feature within a eld of distractor elements (Figure 2.1)
boundary detection, where users attempt to rapidly and accurately detect a texture
boundary between two groups of elements, where all of the elements in each group have a common visual property (Figure 2.2)
Chapter 2. Preattentive Processing
20
Feature Researchers
line (blob) orientation Julesz & Bergen [1983]; Wolfe et al. [1992]
length Triesman & Gormican [1988]
width Julesz [1985]
size Triesman & Gelade [1980]
curvature Triesman & Gormican [1988]
number Julesz [1985]; Trick & Pylyshyn [1994] terminators Julesz & Bergen [1983]
intersection Julesz & Bergen [1983]
closure Enns [1986]; Triesman & Souther [1985]
colour (hue) Nagy & Sanchez [1990, 1992]; D'Zmura [1991]; Kawai et al. [1995]; Bauer et al. [1996]
intensity Beck et al. [1983]; Triesman & Gormican [1988]
icker Julesz [1971]
direction of motion Nakayama & Silverman [1986]; Driver & McLeod [1992] binocular lustre Wolfe & Franzel [1988]
stereoscopic depth Nakayama & Silverman [1986]
3-D depth cues Enns [1990]
lighting direction Enns [1990]
Table 2.1: A list of two-dimensional features that \pop out" during visual search, and a list of researchers who describe preattentive tasks performed using the given feature.
counting, where users attempt to count or estimate the number of elements in a display
with a unique visual feature
2.1 Feature Integration Theory
Triesman has provided some exciting insight into preattentive processing by researching two important problems [Triesman, 1985]. First, she has tried to determine which visual properties are detected preattentively. She calls these properties \preattentive features". Second, she has formulated a hypothesis about how the human visual system performs preattentive processing.
Chapter 2. Preattentive Processing
21
(a) (b)
Figure 2.2: Examples of boundary detection: (a) the horizontal boundary between two groups (empty objects on the top, lled objects on the bottom) is preattentively detected because each group contains a unique feature; (b) the vertical boundary is not apparent (lled circles and empty squares on the left, empty circles and lled squares on the right), because both groups use the same features (lled versus empty and square versus circle)
Triesman ran experiments using target and boundary detection to classify preattentive features. For target detection, subjects had to determine whether a target element was present or absent in a eld of background distractor elements. Boundary detection involved placing a group of target elements with a unique visual feature within a set of distractors to see if the boundary could be preattentively detected.
Researchers test for preattentive target detection by varying the number of distractors in a scene. If search time is relatively constant and below some chosen threshold, independent of the number of distractors, the search is said to be preattentive. Similarly, for boundary detection, if users can classify the boundary within some xed exposure duration, the feature used to dene the boundary is said to be preattentive. A common threshold time is 200 to 250msec, because this allows subjects \one look" at the scene. The human visual system cannot decide to change where the eye is looking within this time frame.
Chapter 2. Preattentive Processing
22
be preattentively detected (Table 2.1). It is important to note that some of these features are asymmetric. For example, a sloped line in a sea of vertical lines can be detected preat-tentively. However, a vertical line in a sea of sloped lines cannot be detected preatpreat-tentively. Another important consideration is the eect of dierent types of background distractors on the target feature. These kinds of factors must be addressed when trying to design display techniques that rely on preattentive processing.
Triesman breaks low-level human vision into a set of feature maps and a master map of locations in an eort to explain preattentive processing. Each feature map registers activity in response to a given feature. Triesman proposes a manageable number of feature maps, including one for each of the opponent colour primaries green, red, yellow, and blue, as well as separate maps for orientation, shape, texture, and other preattentive features.
When the human visual system rst sees an image, all the features are encoded in parallel into their respective maps. One can check to see if there is activity in a given map, and perhaps get some indication of the amount of activity. The individual feature maps give no information about location, spatial arrangement, or relationships to activity in other maps. The master map of locations holds information about intensity or hue discontinuities at specic spatial locations. Focused attention acts through the master map. By examining a given location, one automatically gets information about all the features present at that location. This is provided through a set of links to individual feature maps (Figure 2.3).
This framework provides a general hypothesis that explains how preattentive processing occurs. If the target has a unique feature, one can simply access the given feature map to see if any activity is occurring. Feature maps are encoded in parallel, so feature detection is almost instantaneous. A conjunction target cannot be detected by accessing an individual feature map. Activity there may be caused by the target, or by distractors that share the given preattentive feature. In order to locate the target, one must search serially through
Chapter 2. Preattentive Processing
23
Colour Maps Orientation Maps Map of Locations blue yellow red AttentionFigure 2.3: Framework for early vision that explains preattentive processing; individual maps can be accessed to detect feature activity; focused attention acts through a serial scan of the master map of locations
the master map of locations, looking for an object with the correct combination of features. This use of focused attention requires a relatively large amount of time and eort.
In later work, Triesman has expanded her strict dichotomy of features being detected either in parallel or in serial [Triesman and Gormican, 1988; Triesman, 1991]. She now believes that parallel and serial represent two ends of a spectrum. \More" and \less" are also encoded on this spectrum, not just \present" and \absent". The amount of dierentiation between the target and the distractors for a given feature will aect search time. For example, a long vertical line can be detected immediately among a group of short vertical lines. As the length of the target shrinks, the search time increases, because the target is harder to distinguish from its distractors. At some point, the target line becomes shorter than the distractors. If the length of the target continues to decrease, search time decreases, because the degree of similarity between the target and the distractors is decreasing.
conjunc-Chapter 2. Preattentive Processing
24
tion search is preattentive. In particular, conjunction search tasks involving motion, depth, colour, and orientation have been shown to be preattentive by Nakayama and Silverman [1986], Driver et al. [1992], and Wolfe et al. [1989b]. Triesman hypothesises that a sig-nicant target{nontarget feature dierence would allow individual feature maps to ignore nontarget information contained in the master map. For example, consider a search for a green horizontal bar within a set of red horizontal bars and green vertical bars. This should result in conjunction search, since horizontal and green occur within each of the distractors. In spite of this, Wolfe et al. [1989b] showed that search times are independent of display size. If colour constituted a signicant feature dierence, the red colour map could inhibit information about red horizontal bars. Thus, the search reduces to nding a green horizontal bar in a sea of green vertical bars, which can be done preattentively.
2.2 Texton Theory
Texture segregation involves preattentively locating groups of similar objects and the bound-aries that separate them. Triesman used texture segregation during her experiments with boundary detection. Figure 2.2a is an example of a horizontal texture boundary with empty shapes on the top and lled shapes on the bottom. Figure 2.2b is an example of a vertical texture boundary with lled circles and empty squares on the left, and empty circles and lled squares on the right.
Julesz has also investigated texture perception and its relationship to preattentive pro-cessing [Julesz, 1981; Julesz and Bergen, 1983; Julesz, 1984]. He has proposed his own hypothesis on how preattentive processing occurs. Julesz believes that the early visual sys-tem detects a group of features called textons. Textons can be classied into three general categories:
Chapter 2. Preattentive Processing
25
(a) (b)
Figure 2.4: Example of similar textons: (a) two textons that appear dierent in isolation; (b) the same two textons cannot be distinguished in a randomly oriented texture environment
1. Elongated blobs (e.g., line segments, rectangles, ellipses) with specic properties such as hue, orientation, and width
2. Terminators (ends of line segments) 3. Crossings of line segments
Julesz believes that only a dierence in textons or in their density can be detected preat-tentively. No positional information about neighbouring textons is available without focused attention. Like Triesman, Julesz believes preattentive processing occurs in parallel and fo-cused attention occurs in serial.
Figure 2.4 shows an example of an image that supports the texton hypothesis. Although the two objects look very dierent in isolation, they are actually the same texton. Both are blobs with the same height and width. Both are made up of the same set of line segments and each has two terminators. When oriented randomly in an image, one cannot preattentively
Chapter 2. Preattentive Processing
26
detect the texture boundary between the two groups of these objects.
2.3 Similarity Theory
Some researchers do not support the dichotomy of serial and parallel search modes. Initial work in this area was done by Quinlan and Humphreys [1987] . They investigated conjunction searches by focusing on two factors. First, search time may depend on the number of items of information required to identify the target. Second, search time may depend on how easily a target can be distinguished from its distractors, regardless of the presence of unique preattentive features. Triesman addressed this second factor in her later work [Triesman and Gormican, 1988]. Quinlan and Humphreys found that Triesman's feature integration theory was unable to explain the results they obtained from their experiments.
Duncan and Humphreys proceeded to develop their own explanation of preattentive pro-cessing. Their model assumes that search ability varies continuously, depending on both the type of task and the display conditions [Duncan, 1989; Muller et al., 1990]. Search time is based on two criteria: T-N similarity and N-N similarity. T-N similarity is the amount of similarity between the targets and nontargets. N-N similarity is the amount of similarity within the nontargets themselves. These two factors aect search time as follows:
as T-N similarity increases, search eciency decreases and search time increases as N-N similarity decreases, search eciency decreases and search time increases T-N similarity and N-N similarity are related (Figure 2.5); decreasing N-N similarity
has little eect if T-N similarity is low; increasing T-N similarity has little eect if N-N similarity is high
Chapter 2. Preattentive Processing
27
(a) (b)
Figure 2.5: Example of N-N similarityaecting search eciency: (a) high N-N similarityallows easy detection of target shaped like the letter L; (b) low N-N similarity increases diculty of detecting target shaped like the letter L
Triesman's feature integration theory has diculty explaining the results of Figure 2.5. In both cases, the distractors seem to use exactly the same features as the target, namely oriented, connected lines of a xed length. Yet experimental results show displays similar to Figure 2.5a produce an average search time increase of 4.5 milliseconds per additional distractor, while displays similar to Figure 2.5b produce an average search time increase of 54.5 milliseconds per additional distractor.
In order to explain the above and other search phenomena, Duncan and Humphreys proposed a three-step theory of visual selection.
1. The visual eld is segmented into structural units. Individual structural units share some common property (e.g., spatial proximity, hue, shape, motion). Each structural unit may again be segmented into smaller units. This produces a hierarchical represen-tation of the visual eld. Within the hierarchy, each structural unit is described by a set of properties (e.g., spatial location, hue, texture, size). This segmentation process
Chapter 2. Preattentive Processing
28
occurs in parallel.
2. Because access to visual short-term memoryis limited,Duncan and Humphreys assume that there exists a limited resource that is allocated among structural units. Because vision is being directed to search for particular information, a template of the informa-tion being sought is available. Each structural unit is compared to this template. The better the match, the more resources allocated to the given structural unit relative to other units with a poorer match.
Because units are grouped in a hierarchy, a poor match between the template and a structural unit allows ecient rejection of other units that are strongly grouped to the rejected unit.
3. Structural units with a relativelylarge number of resources have the highest probability of access to the visual short-term memory. Thus, structural units that most closely match the template of information being sought are presented to the visual short-term memory rst. Search speed is a function of the speed of resource allocation and the amount of competition for access to the visual short-term memory.
Given these three steps, we can see how T-N and N-N similarity aect search eciency. Increased T-N similarity means more structural units match the template, so competition for visual short-term memory access increases. Decreased N-N similarity means we cannot eciently reject large numbers of strongly grouped structural units, so resource allocation time and search time increases.
Chapter 2. Preattentive Processing
29
2.4 Guided Search Theory
Jeremy Wolfe has recently suggested a visual search theory that he calls \guided search" [Wolfe and Cave, 1989; Wolfe et al., 1989; Wolfe, 1994]. He believes an activation map based on both bottom-up and top-down information is constructed during visual search. Attention is drawn to peaks in the activation map that represent areas in the image with the largest combination of bottom-up and top-down inuence.
As with Triesman, Wolfe believes early vision divides an image into individual feature maps (Figure 2.6). In his theory, there is one map for each feature type (e.g., one map for colour, one map for orientation, and so on). Within each map a feature is ltered into multiple categories. For example, in the colour map there might be independent represen-tations for red, yellow, green, and blue. Wolfe has already found evidence that suggests that orientation is categorized into steep, shallow, right, and left [Wolfe et al., 1992]. The relationship between values within a feature map is dierent than the relationship between values from dierent maps (i.e.,the relationship between \red" and \blue" is dierent than the relationship between \blue" and \shallow").
Bottom-up activation follows feature categorization. It measures how dierent an element is from its neighbours. Dierences for each relevant feature map are computed and combined (e.g., how dierent are the elements in terms of colour, how dierent are they in terms of orientation?) The \metrics" used to measure dierences in each feature map are still being investigated.
Top-down activation is a user-driven attempt to nd items with a specic property or set of properties. For example, visual search for a blue element would generate a top-down request that activates \blue" locations. Previous work suggests subjects must specify requests in terms of the categories provided by each feature map [Wolfe et al., 1992]. Thus,
Chapter 2. Preattentive Processing
30
R G B Y right left shallow steep steep steep steep G G G G G Bottom-Up Top-DownFigure 2.6: Framework for guided search, user wants to nd a green steep target: image is ltered into cate-gories for each feature map, bottom-up and top-down activation \mark" regions of the image; an activation map is built by combining bottom-up and top-down information, attention is draw to the highest \hills" in the activation map
subjects could search for \steep" or \shallow" elements, but not for elements rotated by a specic angle. Obviously, subjects should pick the category that best dierentiates the target from its distractors. Finding the \best" category is often nonintuitive, however. Wolfe suggests this might explain cases where subjects' performance for a task improves over time. The activation map is a combination of bottom-up and top-down activation. The weights assigned to these two values are task dependent. A conjunction search would place priority on top-down information, since bottom-up results are, in essence, useless. Search for a target with a unique feature would assign a high weight to bottom-up activation. Hills in the activation map mark regions that generated a relatively large amount of bottom-up or top-down inuence. There is no information in the activation map about the source of a hill. High activation from a colour map looks exactly the same as high activation from an orientation map. A subject's attention is drawn from hill to hill in order of decreasing
Chapter 2. Preattentive Processing
31
activation.
Wolfe's theory easily explains traditional \parallel" visual search. Target elements pro-duce the highest level of activation, regardless of the number of distractor elements. This causes the target to \pop-out" of the scene in time independent of the number of distractors. This also explains Duncan and Humphreys' similarity theory results. Low N-N similarity causes distractors to report higher bottom-up activation, since they now dier from their neighbours. High T-N similarity causes a reduction in the target elements' bottom-up ac-tivation. Moreover, guided search also provides a possible explanation for situations where conjunction search can be performed preattentively [Nakayama and Silverman, 1986; Wolfe et al., 1989]. User-driven top-down activation may permit ecient searching for conjunction targets.
2.5 Interference Experiments
Results from preattentive processing can help to identify various types of \visual interfer-ence". These interference eects inhibit a user's low-level visual system, and should be avoided during visualization. One example is conjunction search. Visualization techniques designed to allow a user to rapidly search for data elements with a unique characteristic should ensure that the visual features chosen to represent the elements do not form a feature conjunction.
Tara Callaghan has conducted research to see how similarity within feature groups af-fects texture segregation [Callaghan, 1990]. She found that varying certain irrelevant features within a group can interfere with boundary detection. Her initial experiments investigated identifying a horizontal or vertical texture boundary [Callaghan, 1984]. Subjects were pre-sented with a six by six array of elements. A texture boundary was formed by either a
Chapter 2. Preattentive Processing
32
(a) (b)
Figure 2.7: Form and hue segregation: (a) vertical hue boundary is preattentively detected (blue on the left, red on the right), even though form varies in both groups; (b) random hue interferes with detection of horizontal form boundary (squares on the top, circles on the bottom)
(a) (b)
Figure 2.8: Hue and brightness segregation: (a) random intensity interferes with detection of vertical hue texture boundary (blue on the left, red on the right); (b) horizontal brightness texture boundary is detected preattentively (dark elements on the top, bright elements on the bottom), even though hue varies in both groups
Chapter 2. Preattentive Processing
33
dierence in hue or a dierence in brightness. For hue segregation, the brightness in both groups varied randomly between two values. For brightness segregation, hue varied randomly between two values (Figure 2.8). Subjects had to determine whether the texture boundary was vertical or horizontal. Control experiments were run to see how quickly subjects could detect simple hue and brightness boundaries. The control arrays had a uniform brightness during hue segregation, and a uniform hue during brightness segregation.
Callaghan found that non-uniform brightness interferes with hue segregation. It took subjects signicantly longer to identify the texture boundary, relative to the control array. However, a non-uniform hue did not interfere with brightness segregation. A brightness texture boundary was detected in a constant amount of time, regardless of whether hue varied or not. This asymmetry was veried through further experimentation [Callaghan, 1990].
Callaghan's more recent work has shown a similar asymmetry between form and hue [Callaghan, 1989]. As before, subjects were asked to identify a boundary as either horizontal or vertical in a six by six array. During the experiment, the arrays were segregated by either hue or form. For hue segregation, form varied randomly within the array (circle or square). For form segregation, hue varied randomly. Results showed that variation of hue interfered with form segregation, but that variation of form did not interfere with hue segregation (Figure 2.7).
These interference asymmetries suggest some preattentive features may be \more im-portant" than others. The visual system reports information on one type of feature over and above other features that may also be present in the display. Callaghan's experiments suggest that brightness overrides hue information and that hue overrides shape information during boundary detection.
Chapter 2. Preattentive Processing
34
2.6 Three-Dimensional Icons
To date, most of the features identied as preattentive have been relatively simple. Examples include hue, orientation, line length, and size. Enns and Rensink have identied a class of three-dimensional elements that can also be detected preattentively [Enns and Rensink, 1990b; Enns and Rensink, 1990a]. They have shown that the element's three-dimensionality is what makes it \pop-out" of a visual scene. This is important, because it suggests that more complex high-level concepts may be processed preattentively by the low-level vision system.
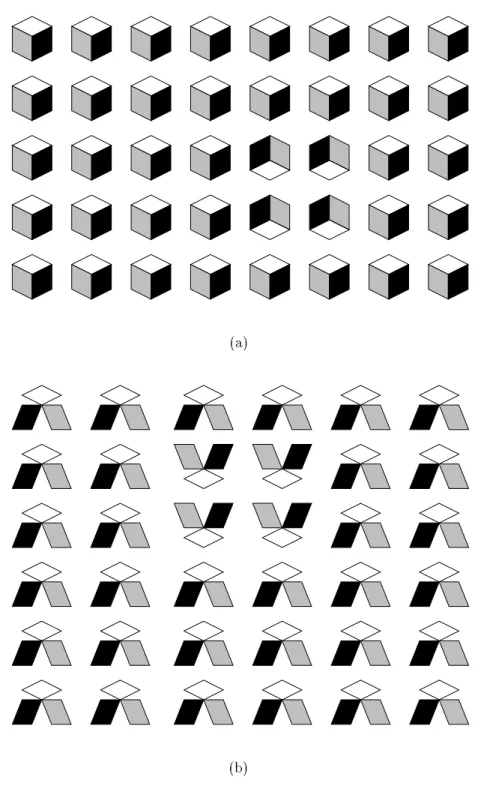
Figure 2.9 shows an exampleof these three-dimensionalicons. The elementsin Figure 2.9a are made up of three planes. The planes are arranged to form an element that looks like a dimensional cube. Subjects can preattentively detect the group of cubes with a three-dimensional orientation that diers from the distractors. The elements in Figure 2.9b are made up of the same three planes. However, the planes are arranged to produce an element with no apparent three-dimensionality. Subjects cannot preattentively detect the group of elements that have been rotated 180 degrees. Apparently, three-dimensional orientation is a preattentive feature.
Enns and Rensink have also shown how lighting and shadows provide three-dimensional information that is processed preattentively [Enns, 1990a; Enns, 1990b]. Spheres are drawn with shadows so they appear to be lit either from above or from below. Subjects can preat-tentively detect the group of spheres that appear to be lit dierently than the distractors.
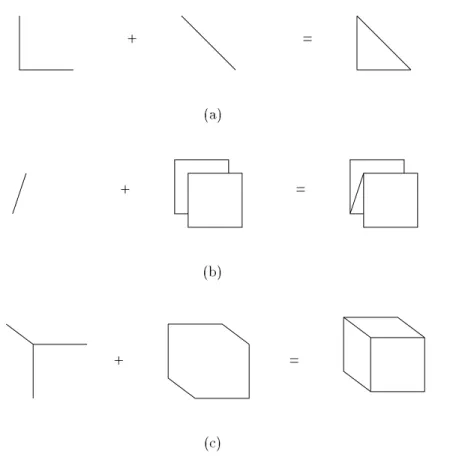
Three-dimensional icons are related to an area of preattentive processing that studies emergent features. An emergent feature is created by grouping several simpler shapes to-gether. The emergent feature cannot be predicted by examining the simpler shapes in isolation (Figure 2.10). A careful choice of simple shapes will form a target element that
Chapter 2. Preattentive Processing
35
(a)
(b)
Figure 2.9: Three-dimensional icons: (a) when the cubes appear \three-dimensional", the 22 group with
a dierent orientation is preattentively detected; (b) when three-dimensional cues are removed, the unique 22 group cannot be preattentively detected
Chapter 2. Preattentive Processing
36
+ = (a) + = (b) + = (c)Figure 2.10: Combination of simple components to form emergent features: (a) closure, a simple closed gure is seen; (b) 3-dimensionality, the gure appears to have depth; (c) volume, a solid gure is seen
can be detected as an emergent feature. For example, in Figure 2.11a, the target element cannot be identied preattentively. However, by simply rotating one of the component ele-ments, we create a new target with an emergent feature, non-closure, that is easily detected (Figure 2.11b).
Additional experiments by Brown conrmed that three-dimensional orientation is preat-tentive [Brown et al., 1992]. One explanation of visual processing is the recognition-by-components (RBC) theory proposed by Biederman. RBC suggests that objects can be decomposed into the combination of a limited number of basic volumetric shapes called ge-ometric icons or geons. This is analogous to the idea of phonemes in speech recognition.
Chapter 2. Preattentive Processing
37
Shape 1 Shape 2 Distractor Target (a) Shape 1 Shape 2 Distractor Target (b)Figure 2.11: A proper choice of initial components will form a target with an emergent feature that can be detected preattentively: (a) the target contains no unique emergent feature, so detecting the target group is dicult; (b) the target contains a unique emergent feature, non-closure, so the target group is easily detected
Chapter 2. Preattentive Processing
38
Brown tested the hypothesis that geons are p