Conservation-Compatible
Practices and Programs:
Who Participates?
United States Department of Agriculture
www.ers.usda.gov
A Report from the Economic Research Service
Dayton Lambert, Patrick Sullivan,
Roger Claassen, and Linda Foreman
February 2006 Economic Research Report Number 14
Abstract
In recent years, the Federal Government has increased its emphasis on conser-vation programs that reward good stewardship on working farmland. This report examines the business, operator, and household characteristics of farms that have adopted certain conservation-compatible practices, with and without financial assistance from government conservation programs. The analysis finds that characteristics of the farm operator and household, in addition to the characteristics of the farm business, are associated with both the likelihood that a farmer will adopt certain conservation-compatible practices and the degree to which the farmer participates in different types of conservation programs. For example, operators of small farm operations and operators not primarily focused on farming are less likely to adopt conservation-compatible farming practices that are management-intensive and to participate in working-land conservation programs than operators of large enterprises whose primary occu-pation is farming.
Keywords: Conservation programs, conservation-compatible management practices, conservation structures, farm households, Conservation Reserve Program, Environmental Quality Incentives Program
Acknowledgments
The authors thank ERS colleagues Kitty Smith and Carol Jones for the encour-agement and direction they provided for this analysis and Stan Daberkow, James Johnson, and William McBride for their suggestions on conservation-compatible practices. We appreciate the helpful comments we received on earlier drafts of this report from Margriet Caswell, Jorge Fernandez-Cornejo, Daniel Milkove, Glenn Schaible, and Keith Wiebe, all with ERS. We also thank outside reviewers Alex Barbarika and Skip Hyberg of the Farm Service Agency, Liu-Hsiung Chuang, Doug Lawrence, and several anonymous reviewers from the Natural Resources Conservation Service, Paul Ferraro of Georgia State University, and Steven Kraft of Southern Illinois University. Finally, we gratefully acknowledge Courtney Knauth for editorial assistance,
Contents
Summary . . . .iii
Introduction . . . 1
Why Is Farmer Behavior Important? . . . 1
Conservation-Compatible Practices . . . 2
Conservation Programs . . . 7
Who Has Adopted Conservation-Compatible Practices? . . . 9
Who Participates in Conservation Programs? . . . .20
Conclusions, Policy Implications, and Data Constraints . . . 27
References . . . 31
Appendix: Modeling Approach and Explanatory Variables . . . .35
ii
Conservation-Compatible Practices and Programs: Who Participates?/ERR-14 Economic Research Service/USDA
Summary
What I
s
the I
ss
ue?
Farm operators have a financial incentive to maintain the quality of their land by limiting soil erosion, avoiding excessive use of chemical inputs, and taking other steps to protect soil productivity. Because many farm operators live on or near their farms, they also have an incentive to reduce the onsite environmental degradation often associated with farm production. However, farm operators have little financial motivation to reduce offsite impacts, and farming remains a significant source of sedimentation and nutrient loading in some watersheds. The Federal Government provides technical and financial support to farm oper-ators for a wide range of conservation practices meant to reduce these offsite environmental impacts. Because these programs are voluntary, their effective-ness depends on the willingeffective-ness of farm operators to participate. Operators’ decisions can be influenced by considerations other than profits and the envi-ronment, such as off-farm work commitments and farm ownership status. By examining the characteristics of farms that have adopted conservation-compat-ible practices and participate in USDA conservation programs, we can better understand how potential participants might respond to market and program incentives.
What Did the Study Find?
The results of the analysis suggest that farm size, commodity mix, and operator motivation are all associated with decisions to use various types of conserva-tion practices, but in different ways.
Conservation-Compatible Management Practices
Management practices that provide environmental benefits and profitability without large conversion costs (such as conservation tillage, crop rotation, and the use of insect-resistant or herbicide-tolerant plants) have been adopted by farms of all sizes, largely without direct financial assistance from conservation programs. However, operators of small enterprises focused on nonfarm occupa-tions are less likely to adopt practices requiring extra time or expense (such as variable-rate application of inputs or integrated pest management) than opera-tors of large enterprises whose primary occupation is farming. Higher educa-tion, the use of outside expertise, farm household reliance on farm income, and receipt of commodity program payments all affect the likelihood of a farmer’s adopting conservation-compatible practices that are more management-inten-sive.
Structural and Vegetative Conservation Practices
Conservation structures like grass waterways and riparian buffers, and vegeta-tive measures such as planting farmland to grasses and other conservation cover crops, come at a cost, both for installation and in forgone production. Younger operators who consider farming their primary occupation and who rely less on off-farm income are more likely to install grass waterways, contour strips, and other working-land structures compatible with agricultural produc-tion. Farmers who install these structures tend to receive only modest
assis-tance from conservation programs. More farm operators who plant conserva-tion cover crops (either to retire cropland or as part of some other land-use change) consider themselves to be retired than those in the conservation struc-ture group, and they receive more conservation program payments than other operators.
Working-Land Conservation Programs
Larger farms whose operators consider farming their primary occupation are more likely to seek participation in working-land conservation programs, such as the Environmental Quality Incentives Program (EQIP). Farmers who take advantage of conservation programs to install working-land practices typically enroll relatively little acreage in the programs, particularly if they are involved in the production of high-value crops.
Land Retirement Programs
Intensive use of land retirement programs is most common among smaller “retired” and “lifestyle” farms. Smaller farms whose operators are focused on nonfarm activities are also more likely to take land out of production. “Whole-farm” enrollees (those who effectively replace income from farm production with Conservation Reserve Program (CRP) payments) are generally older than other farm operators, are more reliant on nonfarm sources of income, and account for roughly half of the farms participating in the CRP. Most of the remaining participants use CRP to retire selected fields or portions of fields from production. These “partial-farm” enrollees tend to be operators of larger farms who consider farming their primary occupation.
Policy Implications
Because working-land and land retirement programs appeal to different types of farmers, both approaches may be needed to address the conservation needs of a diverse agricultural sector. Also, program incentives that assume that all farmers aim to maximize farm profits may not be as effective or efficient as flexible incentive structures that can accommodate other farm operator goals, such as timesaving and ease of use. Finally, policies other than direct subsidies can provide substantial environmental benefits. For example, conservation-compliance regulations, technical assistance, and research to improve standard farming practices (such as crop rotation) can all provide conservation payoffs.
How Wa
s
the Study Conducted?
This report analyzes the business, operator, and household characteristics of farms, focusing on those that have adopted one or more of a select group of conservation-compatible management practices or have installed one or more conservation structures, with and without the assistance of USDA's major conservation programs. Particular attention is focused on the Department’s farmland retirement programs, the largest of which is CRP, and its working-land programs, most notably EQIP and the working-working-land structures funded by CRP. Crop-specific data from the Agricultural Resource Management Surveys (ARMS) of farms growing corn (in 2001), soybeans (in 2002), and cotton (in 2003) allow us to examine the characteristics of farms that adopt conservation-management practices. A special section of the 2001 ARMS survey of all farms and ranches is used to examine the adoption of structural and vegetative conservation practices.
iv
Conservation-Compatible Practices and Programs: Who Participates?/ERR-14 Economic Research Service/USDA
Introduction
Farm operators who own their land or who expect to lease it year after year have a profit motivation to ensure that its quality and productivity do not deteriorate over time. Further, many farm operators live near their farms, giving them an incentive to reduce farming-related environmental degrada-tion such as air, noise, and groundwater polludegrada-tion. Nonetheless, farming remains an important source of sedimentation and nutrient loading in our Nation’s rivers and streams (Ribaudo, 2000; Claassen et al., 2001). Some conservation practices require costly investments that can reduce farm prof-itability, particularly in the short run. In addition, much of the unintended environmental damage caused by farm production is felt far downstream or only after a considerable time lag. If the farm operator will not benefit enough from adopting conservation practices, farming-related environmental problems are less likely to be addressed.
As an incentive to reduce both the onsite and offsite environmental impacts of farming, the Federal Government provides technical and financial support for farm conservation efforts. USDA’s conservation programs share with farmers the cost of adopting conservation practices, but because these programs are voluntary, their cost and effectiveness depend on what farm operators demand in return for altering their farming practices. For the farmers, considerations other than profits and environmental outcomes, such as household budget constraints, farm structure and ownership, and personal goals, can affect the decision. This report examines farm operator adoption of selected conserva-tion-compatible farming practices and participation in USDA’s conservation programs. By identifying the characteristics of farm households that adopt conservation-friendly farming practices and participate in conservation programs, we can begin to understand how potential participants might respond to market and program incentives.
Why I
s
Farmer Behavior Important?
Farmland accounts for about half of the land area within the 48 contiguous States. Farming practices adopted by America’s roughly 2 million farm operators have a major impact on the health of the ecosystem and on soil erosion, sedimentation levels in streams and rivers, nutrient and pesticide runoff, groundwater contamination, and air quality. National water quality assessments by the U.S. Geological Survey suggest that agriculture
contributes toward water quality problems (Ribaudo, 2000). Agriculture has also been cited as a major contributor to declining levels of groundwater (Gollehon et al., 2003; Alley et al., 1999), pesticide contamination of groundwater (Barbash et al., 1999), nitrogen contamination in groundwater (USGS, 1999), nitrogen loads to the Gulf of Mexico, which contributes to hypoxia or oxygen-deficient waters (Goolsby et al., 1999), declining air quality near large confined animal feeding operations (NRC, 2003), and
toxic Pfiesteriaoutbreaks (Staver and Brinsfield, 2001). Improved
conserva-tion practices can mitigate these unintended environmental consequences of agricultural production. For example, improved farming practices played a large role in reducing soil erosion from U.S. cropland by nearly 40 percent between 1982 and 1997 (Claassen et al., 2004). Variable-rate fertilizer appli-cation has decreased nutrient loadings into the environment in some cases
(Bongiovanni and Lowenberg-DeBoer, 2004). The establishment of perma-nent cover on farmland enrolled in land retirement programs has improved wildlife habitat and increased carbon sequestration (Claassen et al., 2001). Economists typically assume that the decision to adopt a specific farming practice is based on profit-maximizing behavior, given the resources— including the type of farmland and the amount of time and management skills—of the farm operator. Indeed, research has shown that the operator’s profit motive is often sufficient to elicit cost-cutting conservation efforts. For example, 75 percent of the reduction in soil erosion by corn producers between 1982 and 1997 can be attributed to the adoption of conservation tillage practices for business reasons (Hopkins and Johansson, 2004). But is profit the only motive behind the decision to practice good stewardship? Roughly 44 percent of farm operators are classified as “residential” by ERS, suggesting that the decision to pursue farming is based on quality-of-life factors in addition to the farm’s ability to generate profits. Decisions based on enhancing the household’s preferred lifestyle may result in different farming practices than those based on profit alone. An additional 19 percent of farm operators regard themselves as “retired.” Concerns over succession, the desire to limit the time and energy spent farming, and the need for income stability can all affect decisions about farming practices and conser-vation program participation. These two types of farms, residential and
retiree-operated, control over 24 percent of the Nation’s farmland.1These
farmers may weigh the importance of farm profits and quality of life differ-ently than full-time commercial farmers, and their farming decisions can have a sizeable effect on the farm sector’s environmental impacts.
This report examines the economic and demographic profiles of farm opera-tors who adopt conservation-compatible management practices, with and without Federal assistance. The factors driving the decision to adopt a conservation practice or participate in a conservation program are diverse, and they vary from household to household. Different types of farmers adopt different kinds of conservation practices. In designing conservation programs that maximize environmental benefits and rely on voluntary participation, it is critical to understand the motivating principles of various types of farmers.
Con
s
ervation-Compatible Practice
s
What are good conservation practices? USDA’s Natural Resources Conser-vation Service (NRCS) lists 151 structural farming practices (e.g., the construction of riparian buffers, terraces, and sediment basins) and 16 management practices (e.g., conservation crop rotation, pest management, and nutrient management) that are eligible for Federal cost sharing under one or more of its conservation programs (NRCS, 2004). Each practice addresses one or more of the major concerns underlying USDA’s conserva-tion efforts: soil and land conservaconserva-tion, water quality and conservaconserva-tion, crop nutrient management, livestock manure management, wildlife habitat management, and air quality improvement (NRCS, 2003). Not all conserva-tion practices have the same environmental impact, and their applicability depends on the situation. The conservation benefits from adopting a practice depend on the farmland’s attributes, the farming practices in place, and a
2
Conservation-Compatible Practices and Programs: Who Participates?/ERR-14 Economic Research Service/USDA
1These data include retired and
res-idential limited-resource farm opera-tors (see box “Farm Typology”) and so differ slightly from published data using the ERS farm typology, which includes such farms as a separate group.
(www.ers.usda.gov/data/arms/app/ Farm.aspx).
host of other factors, including the commodities grown, timing of the growing cycle, and input use. For example, conservation tillage can save on labor, machinery, and fuel costs while it reduces erosion and runoff. But farmers may need to increase their use of herbicide or other inputs to attain optimal yields, potentially reducing or eliminating conservation tillage’s environmental benefits (Padgitt et al., 2000).
In assessing the extent to which farm operators practice conservation or use conservation-compatible practices, we have only limited information about the actual farming practices followed. (See box “Data Sources and Limita-tions,” p. 5.) No attempt is made to assess the degree to which individual farmers are “good stewards of the land.” Rather, we examine the household, operator, and farm characteristics of operations that have adopted one or more selected farming practices consistent with good stewardship, chosen for their broad applicability in different geographic locations and across different types of farming operations.
The practices we consider vary depending on the data source, and they are most relevant for farms engaged in crop production. For specific crops, we
analyze three groups of conservation-compatible management practices.2
The first group, which we term “standard practices,” consists of farming practices that do not require highly specialized management skills: • Conservation tillage. Mulch-till, ridge-till, and no-till practices can
maintain or enhance soil quality while reducing soil erosion associated
with conventional tillage practices.3
• Crop rotation. By interrupting the life cycles of some pests and reducing fertilizer needs, crop rotation can reduce the use of chemical inputs and
soil erosion.4
• Insect/herbicide-resistant plant cultivation.Growing crops resistant to insects or tolerant of herbicides can reduce the need for chemical
inputs.5
The second group, which we term “decision aids,” provides the farm oper-ator with information needed to pursue farming practices that moderate chemical input use:
• Soil testing.This is a first step toward targeted fertilizer application rates that can reduce nitrate leaching and phosphorous run-off.
• Pest scouting.As a first step for integrated pest management systems, pest scouting can lead to reduced pesticide applications.
• Soil mapping.Information on the soil characteristics enables strategic placement and timing of inputs.
The third group, “management-intensive practices,” requires extra effort on the farm operator’s part to manage inputs. Operators who make this effort can be identified by their use of data, gathered through decision aids, to apply nutrients and chemicals for maximum effect:
• Input placement and timing.Variable-rate application of fertilizers, her-bicides, and pesticides may indicate that farm operators are using the results of soil tests and pest scouting to target input applications.
2This list of management practices
builds on research reported in Caswell et al. (2001) and Quinby et al. (forth-coming).
3Mulch tillage allows at least 30
percent of crop residue to remain on the soil (Massey, 1997). Ridge tillage is a system in which ridges are formed during cultivation or after harvest, depending on which crops are planted. Crop residue accumulates between the ridges (Reeder et al., 1992). No-till systems leave the soil relatively undis-turbed, with 60-95 percent of the field surface covered with crop residue (Hoette, 1997).
4Conservation crop rotation is used
in about 80 percent of conservation-compliance plans (Claassen et al., 2004).
5Adoption of herbicide-tolerant
plants can reduce the need for repeated applications of herbicides and can reduce the toxicity of herbicides that are applied (Fernandez-Cornejo et al., 2002).
• Nutrient management. Nitrogen applications based on the results of soil
and plant-tissue tests are evidence of management-intensive farming.6
• Pest management.The use of written records on pest infestation, input applications based on university-developed infestation thresholds, or one or more recognized integrated pest management practices indicates a
management-intensive approach.7
While these practices do not necessarily imply good stewardship, their use indicates that the farm operator is knowledgeable about the costs and bene-fits of altering farming practices to achieve conservation goals. The standard practices considered here characterize “embodied knowledge” technology (Griffin et al., 2004). That is, these technologies are self-contained,
requiring little or no new equipment purchases, retrofitting of equipment, or
additional cultivating skills.8Use of insect/herbicide-tolerant plants,
conser-vation tillage, and crop rotation all involve practices with which farm opera-tors are already familiar. At the other end of the spectrum, nutrient and pest management practices tend to be “knowledge intensive” in that they require the farmer to gather and process information and use farming techniques that may be new (Griffin et al., 2004).
In general, as one moves from standard practices to more management-intensive practices, management costs tend to rise. Management-management-intensive technologies are often scale-intensive.
For the producer willing to purchase a new combine, the extra charge of a global positioning system for the combine is negligible. But these technolo-gies are human-capital intensive as well (Lowenberg-DeBoer, 2003). The extra time required may often be high enough to discourage producers from learning how to accumulate, store, process, and interpret laboratory results in the field or data generated electronically using office computers (Fountas et al., 2003). Being able to spread human capital costs and added equipment costs over more acres makes adoption of management-intensive technolo-gies more likely.
The management-related practices discussed above were identified using data collected on specific crops. To supplement such data, we also looked at the use of a small number of conservation cover practices and structures (for example, grasses, trees, and riparian buffers) by all types of farmers and ranchers. These practices include:
• Whole-field grasses and trees.Native grasses, legumes, and trees planted on farmland retired from production can provide a wide array of envi-ronmental benefits.
• Wildlife habitat enhancement and protection of rare or declining habi-tats.Native wildlife habitats can be rejuvenated by installation of food stands, demarcation of sensitive wetland areas, and cessation of farming or grazing. Most benefits accrue off-farm or to the farmer in the form of nonfarm returns (for example, hunting or viewing fees).
• Grass waterways, filter strips, contour strips, and riparian buffers.Grass or vegetative strips and filters capture sediment and organic matter by slowing runoff. Riparian buffers along streams and waterways reduce
4
Conservation-Compatible Practices and Programs: Who Participates?/ERR-14 Economic Research Service/USDA
8Hybrid corn in the 1920s is an
example of embodied knowledge tech-nology. When it was introduced in the United States, hybrid corn was a new technology, but the knowledge needed to implement the technical package was already well-established. Two other examples of embodied knowl-edge technologies are Bt corn and Round-up Ready™ soybeans.
6All NRCS-approved nutrient
man-agement plans must balance nutrient inputs with nutrient outputs (NRCS, 2003).
7This definition follows that used
by Fernandez-Cornejo and Jans (1999) to identify farms engaged in integrated pest management practices.
9For a description of ARMS, see
“ARMS—what farmers tell us about their businesses and households” (www.ers.usda.gov/Briefing/ARMS/).
10We refer to any practice eligible
for cost-share or rental payments under one of USDA’s conservation programs as a reimbursable conserva-tion practice.
11The ARMS data do not include
information from USDA administra-tive files on program usage or payment receipts, but rely entirely on the respon-dent for program-related information. Because of differing concepts of what constitutes a farm among the program agencies and the National Agricultural Statistics Service (which administers the ARMS questionnaires), as well as confi-dentiality concerns, administrative data cannot readily be matched to ARMS respondents.
Data Sources and Limitations
Because this research focuses on the characteristics of farms, operators, and households that have adopted conservation-compatible practices and partici-pate in conservation programs, we rely primarily on USDA's Agricultural Resource Management Survey (ARMS). ARMS is the only annual source of data on the finances and practices of a nationally representative sample of U.S. farms that includes information on the characteristics of farm operators and their households. ARMS is a collection of annual surveys, some of which focus on the farm enterprise and some on specific fields growing specific crops. This report uses data from the 2001 Phase III ARMS questionnaires for a representative sample of all farms in the United States, supplemented with 2001-2003 Phase II/III ARMS data on specific crops. Phase II data allowed for a closer look at the adoption of a consistent set of farming practices on farms growing corn (in 2001), soybeans (in 2002), and cotton (in 2003).9
Given our interest in farm operator and household characteristics associated with conservation-compatible practices and program participation, our focus is on family farm operations for which household information is available and meaningful. That is, we exclude nonfamily corporate and cooperative farms and other operations with a hired farm manager. Family farms operated 875 million acres of U.S. farm and ranchland in 2003 (94 percent of the total) and accounted for more than 98 percent of U.S. farms.
Note that ARMS is not designed to evaluate conservation practices or program use. While the questionnaires elicit information on a select group of manage-ment practices that are consistent with good stewardship, they make no attempt to collect information on all recognized conservation practices, or to tie the adoption of identified practices to a conservation need or, in most cases, conservation program funding. ARMS tells us if the farm has adopted one or more of a select group of reimbursable conservation practices and whether the farm received conservation funding, but we do not know if the funding was for the identified practices or for some other approved practice.10For farms that
follow conservation practices during the year of the survey but do not report receiving conservation program funds, we cannot rule out the possibility that those practices were paid for with program funds received in previous years. With these caveats in mind, we know whether a farm has adopted some of the farming practices thought to have conservation benefits and whether it is currently receiving conservation program funding.
ARMS asks the respondents to specify the amount of conservation program funds received during the survey year and the number of acres enrolled in conservation programs.11In some years, the survey collects information for specific types of programs, but in other years, only combined information is collected for participation in the three major programs (the Conservation Reserve Program (CRP), the Wetland Reserve Program (WRP), and the Envi-ronmental Quality Incentives Program (EQIP)). Rather than restrict our analysis to a consistent (aggregated) set of programs, we exploit detailed program data when it exists and is of interest.
Finally, little information is available on the need for conservation practices on land farmed by the respondent or the eligibility of nonparticipating farms for conservation program assistance. For specific crops, information is available on highly erodible land and wetlands, but for all farms and ranches, only county-wide measures of erodibility are available using National Resource Inventory data. If the distribution of other or intracounty landscape character-istics requiring remedial action is correlated with business, operator, or house-hold characteristics, the relationships identified with ARMS data can be misleading.
runoff and stabilize banks. They can have both onsite and offsite benefits and are often compatible with existing farm production practices.
By comparing farms that have chosen to adopt these conservation practices with farms that have chosen not to adopt them, we can identify the charac-teristics of farming operations that appear to follow practices consistent with good stewardship. Then, by focusing on the characteristics of farms that chose to participate in conservation programs, we can begin to understand how certain programs encourage good stewardship practices within the diverse group of farms operating across the country.
6
Conservation-Compatible Practices and Programs: Who Participates?/ERR-14 Economic Research Service/USDA
Conservation Programs
Efforts to mitigate unwanted environmental side effects from agriculture are not new. In 1894, the Federal Government established the Division of Agricul-tural Soils to curtail soil erosion caused by agriculture (NRCS, 2000). For most of its history, the Department’s conservation efforts focused on the onsite bene-fits of reducing soil erosion. In recent decades, the Department has broadened its emphasis (although soil erosion reduction remains an important goal of conservation policy) to target water and air quality improvement and wildlife habitat protection. Together, these goals help define “good stewardship” of privately owned agricultural land.
Today, the NRCS and the Farm Service Agency manage several voluntary conservation programs for private land with the objective of fostering good stewardship practices. Funding for voluntary conservation programs was $3.8 billion in 2006. Federal programs providing conservation funding directly to farmers and ranchers focus largely on either: (1) retiring environmentally sensi-tive farmland from production or (2) improving conservation practices on working farmland. Examples of voluntary conservation programs include: • The Conservation Reserve Program (CRP)was authorized by the Food
Security Act of 1985 (the 1985 Act) to retire environmentally sensitive land from agricultural production for 10 to 15 years. In return for an annual rental payment and partial reimbursement for the cost of establishing and maintaining approved groundcover, participants agree to take enrolled land out of production and plant grasses, trees, and other conservation cover crops. Since 1996, producers have also had the option of enrolling land through a continuous signup program focused on developing riparian buffers and other working-land conservation structures. The program is limited mostly to cropland. In 1997, the Department began funding the Conservation Reserve Enhancement Program (CREP), a Federal-State part-nership that targets farmland in specific geographic areas for retirement to further local conservation goals. Nearly 600,000 acres have been enrolled in the CREP, which is administered through CRP. In 2004, farmers and landowners were paid $1.8 billion in cost-share and rental payments on roughly 35 million acres of enrolled land (USDA, 2005a).
• The Wetland Reserve Program (WRP)was first implemented in the early 1990s to retire and restore wetlands that had been converted to crop-land (Heimlich et al., 1998). The Farm Security and Rural Investment Act of 2002 (the 2002 Act) authorized enrolling slightly over 2 million acres in WRP. The WRP program restores and protects wetlands through cost-share assistance as well as 30-year and permanent easements.
• The Environmental Quality Incentives Program (EQIP)provides finan-cial and technical assistance to help participants install or implement con-servation practices on eligible agricultural land. EQIP is a working-land program designed to help farmers institute conservation practices and inte-grate conservation structures into their farming operations. For structural or vegetative practices, EQIP can reimburse up to 75 percent of the
installa-tion costs.12Producers can also receive incentive payments for adopting
management practices. Since EQIP’s inception in 1996, $720 million in EQIP funds has helped nearly 46,500 ranchers and farmers improve air, soil, and water quality on private working land (USDA, 2005a). At least 60
12With passage of the 2002 Act,
most practices are now cost-shared at 50 percent, and incentive payments are fixed by practice and county.
percent of EQIP funds go to livestock producers, including large confined livestock operations.
• The Conservation Security Program (CSP)was authorized by the 2002 Act. It is a working-land program that rewards ongoing environmental stewardship and provides producers incentives to adopt additional conser-vation practices. But unlike EQIP, CSP can reimburse farmers for continu-ing conservation practices already in place. In 2004, the first year of the program, 2,200 farmers received $35 million for conservation practices on roughly 2 million acres of working land (USDA, 2005a).
Other programs include the Farm and Ranch Lands Protection Program, the Grassland Reserve Program, the Wildlife Habitat Incentives Program, and Agricultural Management Assistance. The 2002 Act provided a $17 billion increase above the baseline spending for these programs over 10 years, with the major recipients being CRP, CREP, EQIP, and WRP (Lovejoy and Doering, 2002). This report focuses on these programs.
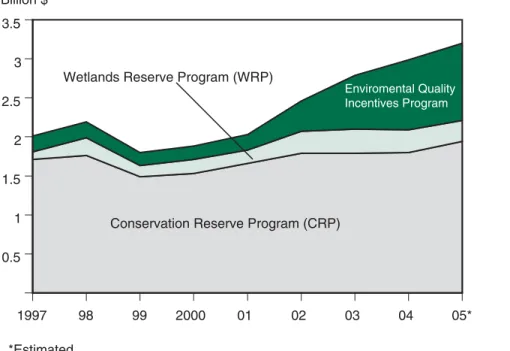
In the years following CRP’s authorization in 1985, most conservation payments to farmers funded land retirement. But with the 2002 Act, funding for working-land programs has risen rapidly (fig.1). While land retirement and working-land practices are not mutually exclusive (several practices, such as riparian buffers, can be funded under either type of program), one would expect land retirement programs to appeal to a different segment of the farming population than working-land programs. Land retirement may appeal more to those who wish to curtail their farming activity, either because of retirement plans or to take advantage of more lucrative off-farm activities. Working-land programs may appeal more to those who see farming as their primary occupa-tion and can afford to invest time and managerial skill to experiment with new farming practices. We focus on any differences between participants in these
two general types of conservation programs.13
8
Conservation-Compatible Practices and Programs: Who Participates?/ERR-14 Economic Research Service/USDA
USDA conservation expenditures for selected programs, 1997-2005
Figure 1 Billion $ 1997 98 99 2000 01 02 03 04 05* 0 0.5 1 1.5 2 2.5 3 3.5
Conservation Reserve Program (CRP)
Enviromental Quality Incentives Program
Wetlands Reserve Program (WRP)
*Estimated
Source: ERS analysis of Office of Budget and Policy Analysis data.
13To highlight the “land retirement”
vs. “working-land” aspects of Federal program assistance, we treat some CRP assistance as a working-land pro-gram. Farmers who sign up whole fields are assumed to focus on the land retirement aspects of CRP. Those who enroll smaller tracts of land to meet specific conservation needs (i.e., to install riparian buffers, grass strips, grass waterways, or other conservation structures) consistent with working-land practices are assumed to use the program in conjunction with produc-tion on adjacent land.
Who Has Adopted
Conservation-Compatible Practices?
To anticipate the characteristics of farmers who have chosen to adopt conservation-compatible practices, it helps to consider why they might do so. We have already alluded to the most powerful argument for adopting many conservation-compatible practices: to reduce costs or increase revenue. For example, variable rate applications of inputs not only reduce the likelihood of excessive use of nutrients and chemicals, but they can also reduce the cost of growing a crop. However, variable rate applications may require new or retrofitted fertilizer application equipment and new manage-ment skills. Being able to spread these fixed costs over more acres makes conversion more appealing. Thus, the scale of the farming operation is likely to be a major determinant in many farming practice decisions. Simi-larly, the farmer’s planning horizon can influence cost-effectiveness calcula-tions; young farmers, or those who plan on farming for many years, may be more willing to retool than farmers looking forward to retirement.
But profits are not the only consideration in farm management decisions. Even practices that promise higher returns may not be appealing to some operators if they require lifestyle changes inconsistent with household goals. Off-farm employment and the relative importance of farm profits to farm household income and well-being may make it more important to minimize the amount of time the operator spends farming than to maximize farm profits.
Not all conservation-compatible practices save time or reduce costs. When a conservation practice would cause a drop in production or require increased cost and management skills to hold production steady, what would motivate the farmer to adopt it? One motivation might be the need to satisfy conser-vation-compliance requirements to ensure continued receipt of Federal farm
payments, especially for operators who receive large payments.14Further,
commodity payments reduce the financial risk farmers face in changing farming practices, making adoption of conservation-compatible practices for business reasons less risky. Another consideration is the share of adoption costs borne by the farm operator; operators who participate in conservation programs may find the out-of-pocket expenses of conservation practices much reduced. Finally, farm operators can value land stewardship and the environment apart from any profit motive. While environmental sentiments are not the province of any particular type of farm, adoption of conservation practices may be more likely in environmentally sensitive areas and when the cost is relatively low.
Figure 2 shows the percentages of corn, soybean, and cotton farms whose operators report that they are engaged in selected farming practices consis-tent with conservation behavior. While there are variations among crops, a high percentage of farm operators report using one or more “standard” conservation-compatible farming practices-conservation tillage, crop rota-tion, or insect/herbicide-tolerant plants. Fewer farm operators perform soil tests, systematically scout for pests, or develop soil maps to help them manage their input use. Still, fewer report using management-intensive conservation-compatible practices, such as variable-rate application of
14The 1985 Food Security Act
required producers cropping highly erodible land to implement soil con-servation plans or risk losing their Federal farm program benefits. More stringent conservation requirements were imposed on highly erodible land cropped for the first time (Claassen et al., 2004).
inputs and nutrient and pest management systems. Because these are all working-land management practices, they are not reimbursable under any of the land retirement programs (CRP, CREP, or WRP). While many of these practices do qualify for reimbursement under EQIP, program funding was limited in 2001-2002. According to the ARMS data, only about 1 percent of corn and soybean farms were reimbursed for these or related
conservation-compatible management practices.15
Farm size and farm household characteristics that might influence farming practice decisions are summarized in the ERS farm typology (Hoppe et al., 2000). Retirement and residential farms are generally smaller and less engaged in farming as an occupation. Low-sales farm operators who consider farming their primary occupation may lack the resources to remain viable in the long run without significant off-farm income. Farms with higher sales are more focused on farming as an income source and have the scale needed to make farming investments pay off (see box “Farm
Typology”). Figure 3 shows the distribution of corn, soybean, and cotton farms that have adopted one or more farming practices in each of our three classes of conservation-compatible management activities. Farm size and farm type do not appear to be related to the adoption of standard practices. However, the distribution of farms collecting field-level information to support production decisions and of farms using management-intensive practices suggests that scale and farm/off-farm work considerations may be factored into decisions about practices that require more operator skill or time.
Larger corn farms and farm households with relatively little off-farm income are more likely to employ decision aids and adopt management-intensive
10
Conservation-Compatible Practices and Programs: Who Participates?/ERR-14 Economic Research Service/USDA
Use of conservation-compatible management practices on selected fields from farms growing corn (2001), soybeans (2002), and cotton (2003)
Figure 2
Note: Nonfamily farms are excluded. Source: 2001-2003 ARMS, Phase II/III.
Pest management Nitrogen management Variable application Soil mapping Pest scouting Soil/tissue test Resistant seed Crop rotation Conservation tillage 0 10 20 30 40 50 60 70 80 90 Standard practices Decision aids Management-intensive practices Corn Soybean Cotton Percent of farms
15EQIP funding was not tracked as
a separate item for cotton farms in 2003.
practices (table 1). Thus, the larger the farm and the more important its prof-itability to the farm household’s income and well-being (as evidenced by the operator’s primary occupation and the farm household’s degree of reliance on off-farm income), the more receptive the operator will likely be to
prac-tices that may reduce costs or increase yields.16If these practices cut costs
by reducing chemical input use or runoff, they can have broader environ-Farm Typology
(Family farms)
To highlight segments of the farming population, we modified the standard ERS farming typology (Hoppe et al., 2000) to focus on four groups of family farms, which differ depending on the data analyzed:
Retired. Small farms (those with sales under $250,000) whose operators report they are retired.
Residential. Small farms whose operators report a major occupation other than farming.
For corn, soybean, and cotton farms, which tend to be larger than many other family farms, we combine the retired and residential categories.
Low-sales. Farms with sales less than $100,000 whose operators report farm-ing as their major occupation.
High-sales. Farms with sales of $100,000 or more whose operators report farming as their major occupation and farm with sales of $250, 00 or more, regardless of the operator’s occupation.
For analyses of corn, soybean, and cotton farms, we separate the high-sales group into:
Small/higher sales. Farms with sales of $100,000 to $249,999 whose opera-tors report farming as their major occupation.
Commercial.Farms with sales of $250,000 or more.
Farms organized as nonfamily corporations and cooperatives, and farms oper-ated by hired managers, are excluded from our analysis.
Key characteristics of each group are as follows:
High sales
Variable Retired Residential Low Small Commercial
sales
Farm operators (1,000s) 398 933 469 135 151 Average farm size (acres) 172 163 423 1,165 1,987 Average farm income ($) 4,885 642 7,905 41,486 155,969 Percent of HH* income nonfarm 102 106 99 51 27 Percent of U.S. farmland 7 16 21 17 32 Percent of U.S. cropland 6 12 17 21 41 Percent of U.S. farm production 2 5 8 12 59 Percent receiving govt. payments 33 27 44 84 75 Percent receiving conservation pmts. 17 11 10 18 19 Nonfamily farmsare excluded, so the percentages of U.S. totals do not sum to 100.
Source: 2003 ARMS, all versions.
*HH=Household.
16While we cannot infer cause and
effect based on a comparison of means or from any of our econometric results, farms that practice more man-agement-intensive farming practices have higher average yields.
12
Conservation-Compatible Practices and Programs: Who Participates?/ERR-14 Economic Research Service/USDA
Table 1
Farm, operator, and household characteristics of corn farms and conservation-compatible management practices adopted, 2001
Standard Decision Management No listed
Characteristic Units practices1 aids2 intensive3 practice
Farm characteristics
Average farm size Acres 575 BCD 648 ACD 854 ABD 386 ABC
Average net farm income Dollars 15,390 BC 23,753 A 32,981 AD *17,327 C
Average commodity payments Dollars 17,409 BCD 24,587 ACD 34,833 ABD 4,561 ABC
Average conservation payments Dollars 548 D 764 D *761 *243 AB
Acres owned that are operated Percent 45 D 41 D 43 D 63 ABC
Farm with HEL/wetlands Percent 20 D 24 CD 17 BD *8 ABC
Irrigated land Percent *4 C *10 15 AD *3 C
Average corn yield Bu/acre 119 BCD 135 AD 142 AD 60 ABC
Operator characteristics
Average age Years 53 BC 51 A 51 A 53
Average experience Years 27 25 27 26
Major occupation:
Farming Percent 69 BC 81 A 84 AD 74 C
Nonfarm occupation Percent 28 BCD 17 A 14 AD 21 AC
Retired Percent *3 **2 *3 **5
Education:
High school Percent 54 48 46 46
Some college Percent 20 28 26 21
Completed college Percent 13 C 14 C 20 ABD *8 C
Used outside advice4 Percent 7 BCD 12 ACD 28 ABD *2 ABC
Household (HH) characteristics
Farm income shared with others Percent 15 12 D 14 18 B
Off-farm work (operator) Percent 44 CD 38 31 A 34 A
Off-farm work (spouse) Percent 48 53 D 46 41 B
Average off-farm income Dollars 33,176 31,52 30,494 27,582
Share of HH income off-farm Percent 70 59 51 62
Number of observations 484 745 459 142
Number of corn farms 108,494 141,569 73,963 32,902
Share of all corn farms Percent 30 40 21 9
1 Farmsusing conservation tillage, crop rotation, or insect/herbicide-resistant plants, but not other listed practices.
2Farms that collect soil or plant tissue tests, systematically scout for pests, or map soil characteristics, but do not use any mana
gement-inten-sive practices.
3Farms that use variable rate application of fertilizersand pesticides, rely on soil tests for nitrogen application, or display evidence of integrated
pest management practices.
4 Farmers who rely on crop consultants or extension service personnel when deciding how much nitrogen to apply.
Notes: Nonfamily farmsare excluded. Coefficient of variation = (standard error/estimate) x 100.* indicates that CV is greater than 25 and less
than or equal to 50.** indicates that CV isabove 50.
Letters A, B, C, and D indicate significant column differencesbased on pairwise two-tailed [Ho:B1=B2] delete-a-group Jackknife t-statisticsat a
90-percent confidence level or higher with 15 replicates (Dubman, 2000). A = standard practices, B = decision aids, C = management-intensive practices, and D = no listed practice.
mental benefits. While farming practices vary depending on the commodity grown, a similar pattern emerges for soybean and cotton farms (not shown). Corn farm operations tend to be larger than many other family farm opera-tions, averaging 644 acres, compared with 414 acres operated by the typical family farm in 2001. However, even with a distribution skewed toward full-time farming operations, the effect of scale on farming practice decisions is clear. As the management skill needed to make a farming practice profitable increases, so does the average size of farms adopting the practice (in terms of acres operated, net farm income, and commodity payments received). Increased use of management-intensive practices corresponds with higher education levels of farm operators and greater operator reliance on outside consultants, perhaps reflecting the human capital needed.
Many farm operations had adopted at least one of the standard conservation-compatible practices we examined, such as crop rotation. Those that had not adopted these practices were smaller than the adopting farms and had lower average yields. Farm operators who had not adopted any of the farming practices we examined also had fewer years of formal education, relied less on outside consultants, and had lower household income levels, on average. We estimated an econometric model to explore how the likelihood of corn farmers’ adoption of management-intensive conservation techniques varied
with specific business, operator, and household characteristics.17(See
appendix for details.)
Conservation management practices used on corn, soybean,
and cotton farms, by type of farm (2001, 2002, and 2003, respectively)
Figure 3
Percent of farms in each type
Note: Nonfamily farms are excluded. Source: 2001-2003 ARMS, Phase II/III.
0 10 20 30 40 50 60 70 80 90 100 Low sales Retire-ment/ resid. lifestyle Higher sales Com-mercial Com-mercial Com-mercial Retire-ment/ resid. lifestyle Retire-ment/ resid. lifestyle Low sales Higher sales Low sales Higher sales Standard Practices Decision aids intensive practices
17The analysis focuses on corn
farms that completed Phases II and III of the 2001 ARMS. Therefore, conclu-sions should not be extrapolated to other farm operations.
From our analysis of corn operations that had adopted or not adopted conservation-compatible practices, we found that, holding other factors constant:
• Larger corn operations are more likely than small operations to use
deci-sion aids or management-intensive technologies.
• Farms that combine corn production with production of high-value crops
(fruits, vegetables, and nursery products), poultry, or hogs are more like-ly to use decision aids or management-intensive technologies.
• Corn farm operators who receive commodity program payments are
more likely to use decision aids or management-intensive technologies than operators who do not receive payments.
• Corn farm operators who seek advice from consulting services or
exten-sion agents are more likely to use deciexten-sion aids or other management-intensive information systems.
• Operators of irrigated corn farms are more likely to use management
decision aids or management-intensive technologies than operators who do not irrigate.
• Corn farm operators reporting higher levels of educational attainment
(on a continuum from high school through graduate study) are more likely to use decision aids or management-intensive practices than opera-tors with less education.
• Corn farm operations that classify themselves as family corporations are
more likely to use decision aids and management-intensive technologies on their farms, but farms sharing income with other households are less likely to adopt these technologies.
We do not find a connection between conservation program payments and the decision to adopt conservation-compatible practices, perhaps because working-land program budgets were relatively small in 2001. However, as funding for working-land programs increases, more farmers may take advantage of these programs to adopt reimbursable conservation practices. Our findings are generally consistent with those reported by Caswell et al. (2001) in an analysis of farming practices in the 1990s. That study found a correlation between farm size, receipt of government commodity program payments, use of expert advice, educational attainment, and use of irrigation systems and the decision to adopt “modern” farming practices (which loosely correspond to our “management-intensive” conservation-compatible practices).
Farm operators can also install conservation structures on working and retired farmland. Figure 4 shows the share of all farm operations that had installed conservation structures or rotated fields out of production in
2001.18Scale seems to be important when the conservation structure is
compatible with ongoing farming operations (for example, grass waterways or contour strips, which are used more frequently on large farms than on smaller ones), but appears less important when practices involve land retire-ment and wildlife enhanceretire-ment. Furthermore, participation rates in a conser-vation program are higher among farms that planted whole fields to grasses, etc., and installed wildlife enhancements than among farms that installed
14
Conservation-Compatible Practices and Programs: Who Participates?/ERR-14 Economic Research Service/USDA
18The question on whole fields
planted to grasses, etc., does not require the respondent to differentiate between cropland and pastureland or between "permanently" retired fields, fields left temporarily fallow, or planted to grasses/legumes as part of a planned crop rotation. For farms par-ticipating in CRP, CREP, or WRP, land is retired for a multiyear contract period and is managed for conserva-tion purposes. But for other farms, land could come back into production at any time (or may currently be work-ing pastureland) and so may have only limited environmental benefits.
working-land-compatible conservation structures. Table 2 presents descriptive statistics on the business, operator, and household characteristics of farms that had installed conservation structures and those that had not. Most farms had none of the identified structures in place in 2001. Of the 25 percent that had one or more conservation structures, over half were in the form of whole fields planted to conservation cover (grasses, legumes, etc.), with working-land-compatible structures accounting for another one-third of “practicing” farms. Major differences between farms that had not installed conservation structures and those that had were largely restricted to the working-land structures. The only significant differences between farms that had not installed conservation structures and farms that had retired whole fields were the lower share of retired farm operators, the lower level of Federal conservation payments, and
the higher share of production from high-value crops among noninstallers.19
Differences abound between farms that “retired” whole fields and those that installed grass waterways, filter strips, and other structures compatible with working land. Farms that installed conservation structures were generally larger grain farms that relied less on conservation payments. The farm operator who installed them was more likely to consider farming his/her primary occupation, was slightly younger, and relied less on off-farm income than the farm operator who participated in land retirement programs. These differences are consistent with our previous finding that farm operators who focused on farm production and relied on farm income were more likely to invest in costly and manage-ment-intensive, conservation-compatible practices.
19We do not include an exhaustive
list of conservation structures eligible for reimbursement under CRP or EQIP. As a result, the "No listed prac-tice" group includes farms that receive conservation payments for other activi-ties.
Conservation structural and vegetative practices on all family farms with and without conservation program funding, by type of farm, 2001
Figure 4
Percent of farms in each type
Note: The darkest portion of each bar represents farms that have conservation structures in place and that received conservation funding in 2001. The program funding need not be for the specific practice highlighted. Whole fields planted to grasses, etc., that are obviously pastureland are excluded, but this category can still include land never intended for crop production or cropland left fallow on a temporary basis.
Source: 2001 Arms, Phase III, Cost and Returns Report, Version 1. 0 5 10 15 20 25 30 35 Resi- dential Low sales High sales Retired Resi- dential Low sales High sales Retired Resi- dential Low sales High sales Retired
Whole field grasses,
Wildlife enhancement,
Grass waterways,
Payments No payments
trees, etc. filters, etc.
To supplement table 2, we used an econometric model to determine the charac-teristics associated with the likelihood that an operation used working-land-compatible structures, installed wildlife enhancements, or planted whole-field conservation cover (see the appendix, particularly app. table 2). Holding all other factors constant, as the contribution of grain production to total produc-tion revenue increased, the likelihood of a farm operaproduc-tion planting whole fields to conservation cover crops lessened. On the other hand, farms specializing in grain production were more likely than farms that focused on other products to
16
Conservation-Compatible Practices and Programs: Who Participates?/ERR-14 Economic Research Service/USDA
Table 2
Farm, operator, and household characteristics of farms with selected conservation structures in place, 2001
Whole field Wildlife Working No listed
Characteristic Units grasses, etc. enhancement lands1 practice
Farm characteristics
Average farm size Acres 494 *705 *592 388
Average net farm income Dollars ***14,844 ***7,308 *30,877 D *12,033 C
Average commodity payments Dollars 5,352 C *6,648 C 19,427 ABD 5,689 C
Average conservation payments Dollars *3,043 CD *3,258 CD 711 ABD *189 ABC
Average share of production from:
Grains Percent 10 C *14 C 47 ABD 12 C
High-value crops Percent ***2 BD *9 AC ***2 BD *8 AC
Livestock Percent 36 **24 36 43
Other Percent 17 **32 *9 D 22 C
Operator characteristics
Average age Years 58 C 54 53 A 54
Average experience Years 24 *22 26 22
Major occupation:
Farming Percent 35 C **29 C 68 ABD 40 C
Nonfarm occupation Percent 41 *58 *26 D 50 C
Retired Percent 25 CD *12 *6 A *10 A
Education:
High school Percent 42 *29 43 41
Some college Percent 21 ***34 27 24
Completed college Percent *14 ***18 13 13
Female operator Percent *17 C ***9 *3 AD 8 C
Household (HH) characteristics
Average size of household Number 2.6 2.9 3.1 2.7
Farm income shared with others Percent ***4 — 5 D **2 C
Off-farm work (operator only) Percent *17 ***21 19 *24
Off-farm work (spouse only) Percent **15 *8 C 22 B 13
Off-farm work (dual) Percent 34 *48 31 32
Average off-farm income Dollars 52,811 *77,778 44,192 D 60,499 C
Share of HH income off-farm Percent 83 88 C 74 BD 83 C
Observations Number 546 223 488 4,090
Farms Number 263,553 82,322 166,863 1,499,219
Share of all farms Percent 13 4 8 75
1 Conservation structures consistent with farm production, such as grass waterways, filters, and riparian buffers. Notes: Nonfamily farmsare excluded. Coefficient of variation (CV) = (standard error/estimate) x 100.
* indicates that CV is greater than 25 and less than or equal to 50.
** indicates that CV is greater than 50 and less than or equal to 75.
*** indicates that CV isabove 75.
Letters A, B, C, and D indicate significant column differencesbased on pairwise two-tailed [Ho:B1=B2] delete-a-group Jackknife t-statisticsat a
90-percent confidence level or higher with 15 replicates (Dubman, 2000). A=whole field grasses, etc., B=wildlife enhancement, C=working-land practices (grass waterways, filter strips, etc.), and D=no listed practice.
— indicates legal disclosure problems.
install working-land-oriented conservation structures. Conservation payments as a proportion of the total value of farm production had a positive influence on the likelihood that an operator participated in land retirement and wildlife enhancements. Farms operating on land susceptible to water erosion, or farms located near water sources (such as streams, rivers, or lakes), were also more likely to use working-land structures.
In summary, there are differences in the adoption of conservation-compatible practices that embody knowledge and skill within the technology itself (such as insect/herbicide-resistant plants) and the adoption of practices that require farm operator knowledge and skill (such as variable rate application of inputs). Conservation-compatible practices that require relatively little specialized management skill and cost the farm operator little in forgone profits or out-of-pocket expenses are widely dispersed among the farming population. Their adoption may have environmental benefits, but the farm operator’s primary
consideration is likely to be minimizing cost and time.20Farm practices that
require more intensive management skills and a considerable investment in working and human capital, but that offer a sound investment return, may appeal more to farm operators concerned with maximizing farm profits. Large-scale farm operations can spread the cost of such practices over more acres, making it easier to justify the initial investment in equipment and management skill. For example, contour farming or strip cropping is easier using autoguid-ance systems. These navigating systems are relatively expensive, costing up to $35,000 (Griffin et al., 2005). However, large commercial operations can quickly recapture this capital outlay through input cost savings and soil produc-tivity enhancement. Likewise, younger farmers may be more willing to make these investments because of their longer farming horizons.
Conservation structures that encompass whole fields are likely to appeal to farm operators who: (1) have marginal land that cannot be profitably farmed year after year, (2) own pasture not intended for crop production, or (3) have a primary goal other than maximizing crop yields. This goal might be maxi-mizing rental returns (in the form of CRP payments), finding time for other pursuits (such as retirement or an off-farm career), or increasing the value of farmland for nonfarm activities (such as hunting, fishing, and scenic enjoy-ment). Older, retired farm operators and those receiving significant conserva-tion program payments are more likely than other farm operators to plant whole fields with grasses and other conservation cover. Structures compatible with continued crop production, such as filter strips, appeal to larger operations that receive more in Federal commodity payments than in conservation program payments. Thus, the role of conservation programs in influencing conservation practice decisions likely varies by the type of practice, the farm’s cost structure, the operator’s skill, and the household’s goals.
20Nehring et al. (2002) argue that
practices that do not add to farm prof-itability by cutting costs or increasing yields, such as herbicide-tolerant plants, are popular on soybean farms because they reduce the time and effort the farm operator needs to devote to the operation.
18
Conservation-Compatible Practices and Programs: Who Participates?/ERR-14 Economic Research Service/USDA
Tables 1 through 3 compare farm, operator, and house-hold attributes, and each is supplemented with the results of a multivariate regression model. Details of these models are provided in the appendix. The model variables include (1) farm production characteristics, (2) government payments received by farm households, (3) farm household demographic variables, (4) environ-mental factors, and (5) regional variables.
Farm Production Characteristics
• Value of production shares.To measure effects of farm diversification, we include the value of produc-tion shares from high-value crops (e.g., revenue from fruits, nursery products, and vegetables), grain crops (such as corn, soybeans, rice, barley, sorghum, and wheat), and sales of cattle and dairy, hogs, and poultry.
• Tenure.The proportion of land owned to land oper-ated reflects the effects of tenancy on the adoption of conservation-compatible practices and land enroll-ment in conservation programs. In general, we expect this ratio to be relatively small for larger farms engaged in agriculture for profit, as these farms tend to rent land for production purposes.
• Gross cash farm income less government payments.
Scale effects may be important with respect to partici-pation in conservation programs and adoption of conservation-compatible practices, particularly costly or management-intensive practices. We use gross cash farm income less government payments to measure farm size. We hypothesize this variable to be posi-tively related with participation in working-land programs.
• Acreage expansion since 1996.For farms engaged in production agriculture, one strategy to increase revenue is expansion of operations. A binary variable (0,1) indicating whether the operator had expanded acres since 1996 is included to capture this effect. We hypothesize this variable to be negatively correlated with participation in land retirement programs and positively correlated with working-land conservation activities.
• Use of extension/consultant advice.A dummy vari-able indicates whether an operator used recommenda-tions from an extension service or a hired consultant for nitrogen management. Many of the “high-tech” solutions to nutrient management problems are not single-component, “one-size fits all” technologies
(Griffin et al., 2004). We use this variable to proxy an operator’s willingness to seek outside advice.
Producers who follow expert advice on nitrogen management are expected to be more likely to use advice on other farming practices as well.
• Cost/output ratio.The economic cost-to-output ratio is calculated as 100 x (total expenses + noncash expense paid to labor + depreciation expense + adjusted charge to management + estimated charge to operator + total contractor reimbursed operator expense)/(total value of production - total value of production to landlord + government payments) (Banker et al., 2001). This variable captures the effects of farm efficiency with respect to total costs and output.
• Asset turnover ratio.Because the cost-to-output ratio was not calculable for many farms in the 2001 ARMS III dataset, the asset turnover ratio (ATR) is used as a measure of farm efficiency. The ATR is calculated as the ratio of gross farm income to total assets (Banker et al., 2001). It is expected that this variable will be negatively associated with the decision to participate in land retirement practices and programs and posi-tively associated with the decision to practice working-land conservation.
Government Assistance
Government payments, which can include fixed income, marketing loan, disaster, and conservation payments, may influence the adoption choice of some conservation-compatible practices or participation in conservation programs. In some models, we include the commodity payments as a separate variable from the conservation payments. Because government payments are highly correlated with farm scale, the sum of Agri-cultural Marketing Transition Act (AMTA) payments, disaster payments, and loan deficiency payments (LDPs) was normalized by the total value of produc-tion. Conservation payments were scaled to total farm acres operated.
Household Characteristics and Human Capital
• Off-farm income.Income from off-farm sources aver-aged 83 percent of total farm household income in 2001. The off-farm income share of total household income is included to measure the effect of nonfarm income sources on the decision to participate in a conservation program or adopt conservation-compat-ible practices. In addition, whether the farm operator,