Non-accelerating wage inflation rate
of unemployment in Poland
NATIONAL BANK OF POLAND
WORKING PAPER
N
O
. 48
The author would like to thank Wojciech Charemza, Adam Czy˝ewski and Ryszard Kokoszczyƒski for helpful comments and support when writing this paper. The paper as well benefited from comments of Adam G∏ogowski, Micha∏ Gradzewicz, Marek Góra, Marcin Kolasa, Krzysztof Rybiƒski.
Please send any suggestion to this paper at Katarzyna.Budnik@mail.nbp.pl.
Design: Oliwka s.c.
Layout and print: NBP Printshop
Published by:
National Bank of Poland
Department of Information and Public Relations 00-919 Warszawa, 11/21 Âwi´tokrzyska Street phone: +48 22 653 23 35, fax +48 22 653 13 21
© Copyright by the National Bank of Poland, 2008
Contents
Contents
Tables and figures . . . .4
Abstract
. . . .51 Introduction. . . 6
2 Labour market in Poland . . . . . . .8
3 NAWRU in ECMOD model . . . 11
4 Bargaining model. . . .13
5 Empirical model of wages and employment . . . .15
6 NAWRU . . . .19
6.1 Short run NAWRU . . . .19
6.2 Long run NAWRU . . . .21
7 Impulses. . . . . . 26
7.1 Monetary impulse . . . .26
7.2 Social contribution effective rate impulse . . . 27
7.3 Personal income effective tax rate impulse . . . .28
7.4 Value added effective tax rate impulse . . . 28
7.5 Unemployment benefits replacement rate impulse . . . .29
7.6 Current government’s expenditures impulse . . . 29
8 Conclusions. . . 31
Annexes. . . .32
Tables and figures
Tables and figures
List of figures
Figure 1
Unemployment rate . . . 37Figure 2
CPI inflation . . . .37Figure 3
Wage inflation . . . .37Figure 4
Unemployment benefit replacement rate . . . 38Figure 5
Percentage of registered unemployed who collected unemployment benefits. . . .38Figure 6
Social relief as percentage of a household total income in households with at least one unemployed . . . .38Figure 7
Shadow income replacement rate . . . 39Figure 8
Tax wedge . . . 39Figure 9
NAWRU . . . .39Figure 10
NAWRU vs. actual unemployment rate . . . .40Figure 11
Steady-state NAWRU . . . .40Figure 12
Steady-state NAWRU calculated on the basis of the natural interest rate. . . .. . . .40Figure 13
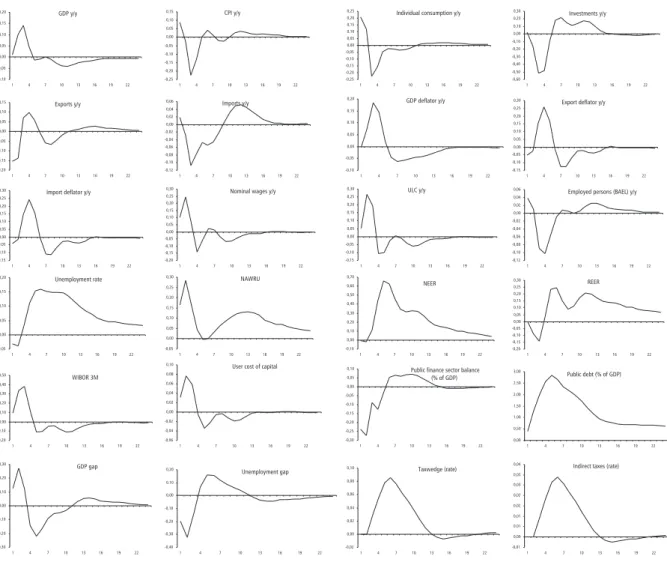
Reaction of the economy to the monetary impulse . . . .41Figure 14
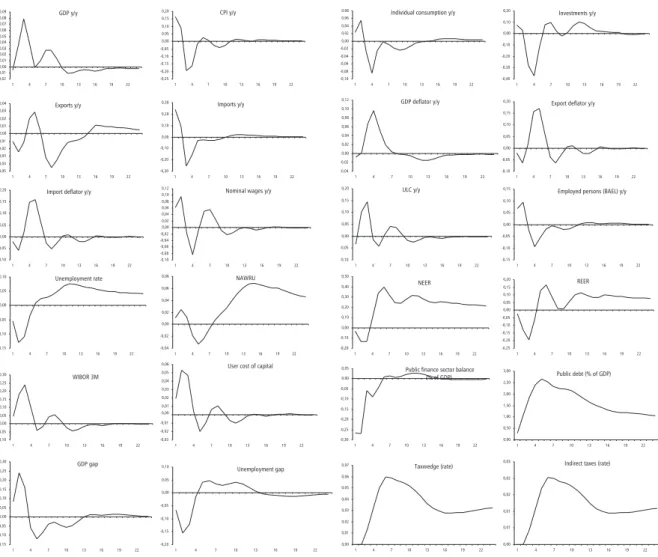
Reaction of the economy to the employer’s social contribution rate impulse . . . 42Figure 15
Reaction of the economy to the employee’s social contribution rate impulse. . . 43Figure 16
Reaction of the economy to the personal income tax rate impulse . . . .44Figure 17
Reaction of the economy to the value added tax rate impulse . . . 45Figure 18
Reaction of the unemployment benefit replacement rate impulse . . . . .46Figure 19
Reaction of the current government expenditures impulse . . . .47List of tables
Table 1
Parameters . . . .34Abstract
Abstract
The model of the wage bargaining constitutes a framework for calculation of the NAWRU in Poland. The approach used in the paper let me trace changes of the natural unemployment rate in Poland in the context of structural changes in the economy in the last decade. Moreover, I introduced the endogenous equilibrium rate into the existing macroeconomic model — ECMOD. It allowed me to simulate NAWRU behavior after economic shocks. Simulation results shed some light on channels and speed of adjustment of the modelled economy. Interestingly, when NAWRU is tied to the stock of capital, relative prices and fiscal variables, the model is able to replicate high degree of the unemployment persistence.
JEL Classification:E10, E17, E24, E62
1
Introduction
1
Introduction
This paper attempts to describe the concept and the evolution of the non-accelerating wage inflation rate of unemployment in Poland within the last ten years, partly for the clear interest of the results and partly to enhance forecasting and simulation performance of the macroeconometric model of the National Bank of Poland. The non-accelerating wage inflation rate of unemployment is treated as some approximation of the equilibrium or natural unemployment rate. When unemployment is at its natural level, expectations are confirmed and wages should stay at their medium or long run track, so that no acceleration or deceleration of wages growth takes place. Even though I recognize the difference between the two terms, the equilibrium unemployment rate and the NAWRU, are used interchangeably in the paper.
Three main approaches which enable to pin down the changes in the natural unemployment rate in an economy are present in the literature. First approach assumes that the equilibrium unemployment rate follows a smooth stochastic process. Data on the current unemployment rate are filtered and fluctuations of the variable at lower than cyclical frequency are interpreted as changes in the equilibrium rate. Second approach refers to the Philips curve. The Philips curve describes the relation between the wage inflation and the unemployment gap (or price inflation and the unemployment gap). The NAWRU (or the NAIRU) is obtained by estimating the above relation, with an optional use of supply shift variables, and calculating the implied unemployment rate corresponding with a stable inflation rate. Both methods were already used for the estimation of the natural unemployment rate in Poland (Kuczyƒski and Strza∏a (2001), BRE (2002), Gradzewicz and ˚ó∏kiewski (2006)).
Third approach, which is exploited in the paper, concerns the wage curve concept. In contrast to the Philips curve, the wage curve depicts the relation between the unemployment and the level of the wage rate. The negative relation between the level of wages and the unemployment rate is a standard finding of the efficiency wage or the bargaining models. The unemployment rate in those models abates expected utility when out of job and via this channel the reservation wage. The wage curve was popularized by microeconomic studies of Blanchflower and Oswald (1994, 1995, 2005). The authors conducted the analysis of individual wages and regional unemployment rates in the developed countries, confirming the existence of negative correlation between the variables. At the aggregate level, the wage curve is often referred to as a wage-setting relation.
Blanchard (1988) and Blanchard and Katz (1999) indicated there need to be no incoherency between the Philips curve and the wage curve specifications. Additional constraints put on expectations of workers and firms or on the determinants of workers reservation wage let the authors derive the relation between the inflation and the unemployment gap from the wage curve specification. Furthermore, they claim that the wage curve may describe the European labour markets better than the Philips curve because of their generally low flexibility (especially when benchmarked to the United States).
In the first step, I present the model of the wage bargaining of McDonald and Solow (1981) which constitutes a framework for the estimated wage equation. In the model, firms, which are the price setters, and workers bargain over wages and employment. Two cointegrating relations are derived based on the model, which describe firm-worker
1
Introductioninteractions. The first one is interpreted as the ”price curve” and the second as the ”wage curve”. The equilibrium unemployment rate is an unemployment rate consistent with wage and price setting behavior of agents in the absence of inflation surprises. Therefore the natural unemployment in the described system is fully endogenous and results from the wage and price decisions of workers and firms.
I explicitly distinguish between the short run (or medium run) and the steady-state NAWRU. The short run NAWRU corresponds with the one-period Walrasian equilibrium and is dependant both on institutional and on state variables: the labour force, the stock of capital, the level of the total factor productivity, the relative prices . The natural rate of unemployment may be therefore affected by the past evolution of the unemployment or the cyclical up and downturns. Hence, the proposed approach to modeling of the equilibrium unemployment rate accommodates the critique of the dichotomy between factors affecting NAWRU und those triggering the actual unemployment changes (Bean (1994), Blanchard (1988), Blanchard and Katz (1997), Ball et al. (1999)) and allows for hysteresis in the equilibrium unemployment rate. In the long run, the NAWRU converges to the steady-state level which alters in line with structural changes in the economy but is resistant to temporary and cyclical shocks.
The second step was to build in the endogenous NAWRU as well as the distortionary taxation into the core forecasting macroeconomic model of the National Bank of Poland — ECMOD. I document how the model with the endogenous equilibrium unemployment rate reacts to different shocks. Introduction of the endogenous NAWRU proved, in point of fact, to enrich the system's responses foremost to impulses which affect the potential product of the economy. An interesting finding is a material unemployment persistence which can be generated after the NAWRU endogenization. The channels of hysteretic development of the labour market are: the capital accumulation, the economic policy and the net foreign assets position of the economy.
First part of the article includes sketchy characterization of factors which could have impact on the development of the natural unemployment rate in Poland throughout the last decade. Next I shortly describe ECMOD model and the rationales for endogenizing the NAWRU in the model's framework. In the third part I introduce the bargaining model which served as a basis for derivation of the estimated relations. In the consecutive chapters, both the short and the long run NAWRU are calculated and their evolution described. Last chapter describes the simulation results of the macroeconometric model with the endogenous NAWRU.
2
Labour market in Poland
2
Labour market in Poland
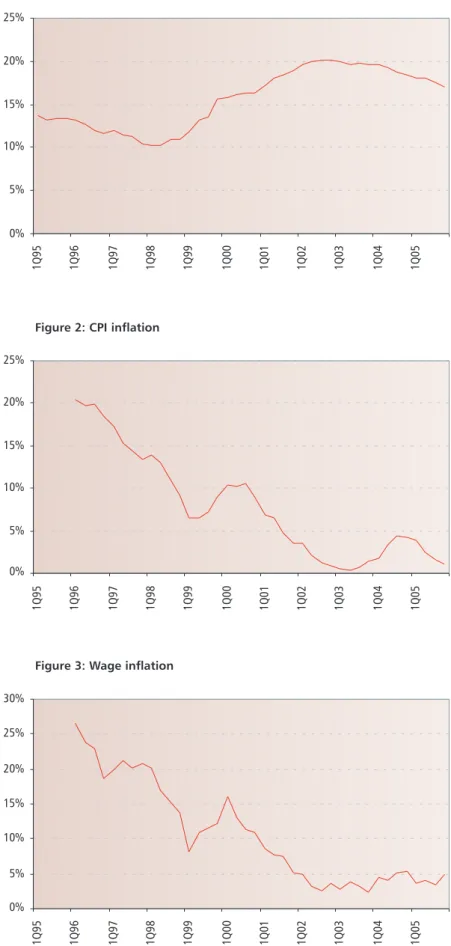
The unemployment rate in Poland remained between 10%–13% from 1995 until the mid of 1998. Following the negative foreign demand shock and the later economic slowdown from 1999 on, the unemployment rate was gradually rising to reach a peak of 20% in 2002. Adjustment of the production structure, linked to the sudden decrease of exports to the Eastern European countries and the resulting deceleration of growth, not only contributed to an increase of the actual unemployment rate but also revealed institutional weaknesses of the Polish labour market. The long-term unemployment went sharply up. Along with the cyclical upturn the unemployment rate trundled to lower levels to be around 17% at the end of the period under consideration, however, with significantly higher long-term unemployment component than before the slowdown (Figure 1).
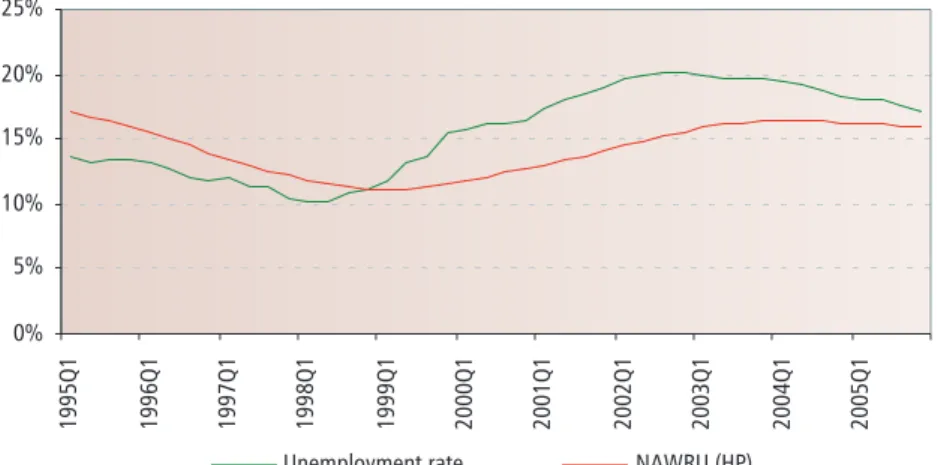
Decomposition of changes in the actual unemployment rate into variation of its cyclical component and of the natural unemployment rate is greatly hampered by the fact that data which are at disposal cover mainly the transformation period. Between 1995 and 2001 Polish economy witnessed nearly continuous disinflation — both in prices (Figure 2) and wages (Figure 3). Only beginning from 2002, the wage inflation stabilized at around 4% and started to reflect mostly cyclical changes: declined to below 1% in 2003, bobbed up to over 4% in the EU accession period and came back to the inflation target of 2.5% in 2005 after the accession growth acceleration faded out. Evolution of wages and unemployment can give some scant intuition about stability of the unemployment gap at the end of the period under consideration and, when the actual unemployment rate correction in 2004 and 2005 is added into the picture, about a temperate fall in the NAWRU. To keep track of the equilibrium unemployment rate's development a closer look at changes of labour market institutions should be taken. Quantitative measures of quality of institutions are scarce but some obvious shifts in economic policy, which could have had a bearing on the NAWRU, can still be identified.
The unemployment benefits system underwent a number of legislative changes in the first years of the transformation period. An economically relevant amendment to the act on employment and the unemployment prevention was introduced in 1997. The amendment substantially reduced the generosity of the unemployment benefits system: benefits were differentiated in relation to work experience of individuals, unemployed had to substantiate longer employment period to be eligible for benefit, replacement rate was on average reduced (Figure 4). As a result only in one year the percentage of unemployed who collected unemployment benefits was reduced twofold (Figure 5). The amendment also singled out groups of individuals who lost their unemployed status.
Concurrently with the unemployment benefits system reform, the pre-retirement allowances and benefits program were introduced. Pre-retirement transfers were targeted at elderly unemployed and together with an increase in the number of retirement pensions granted to people in pre-retirement age contributed to a decline of the activity rate of the elderly (which could be observed since 1999). To some extent, those negative effects on the activity rate were compensated by higher restrictiveness of the disability benefits system after 1999, as compared with previous years. Reduced pool of labour force could have temporarily reduced both the actual unemployment rate and the NAWRU. Some reasons exist to consider the social relief system as reinforcing changes in the natural unemployment rate not only through the changes in the labour supply. It appears that
2
Labour market in Polandhouseholds with at least one unemployed are relatively strongly dependant on social assistance benefits1 (exclusive of unemployment, retirement and disability benefits) (compare Figure 6). Eligibility for social benefits is often means-tested and conditional on the household per capita income. In the effect transition to employment may be followed by loosing the entitlement to that source of income. Relevance of the social relief benefits for the level of shadow wage plausibly increased in the period both due to the effects of the introduction of the amendment to the act on employment and the unemployment prevention and increasing availability of different types of social support benefits (with representative example of alimony benefits).
The third source of income of unemployed, beside unemployment benefits and social relief benefits, which should be considered, is unregistered income. In 1998 circa 25% of the formally unemployed were working in the shadow economy (”Unregistered Employment in Poland in 1998” (1999)). As a result, income from unofficial activities could have substantially affected the reservation wage of unemployed. Still, the evidence indicate that the replacement rates for shadow income (income from the activity in the shadow economy related to the level of wages in official economy corrected for taxes and social contributions) were roughly stable (around 30%) in years for which the corresponding data are available (Figure 7). It suggests that even if the shadow economy income played an important role in determining the fallback position of the unemployed, it was probably not the crucial source of the equilibrium unemployment changes.
Other factor which is often mentioned in the context of the efficiency of the labour market is the burden of taxation. Leaving the discussion whether taxes or social security contributions can influence employment in the long run for the next chapter, here only the main tendencies in the sample period are described. The tax wedge — both defined as the effective direct income tax rate plus the effective social security contribution rates or including the effective indirect tax rates remained generally invariant between 1995 and 2005 (Figure 8). Still, at least two important facts can be easily overseen when looking only at the level of the tax wedge within the period. One of the outcomes of the social insurance system reform in 1999 was the strengthening of the relation between social security contributions and benefits. Retirement, disability, sick, accident and healthcare contributions were singled out from the previous combined contribution levied only on employers. Only those who regularly allot the respective contributions were eligible to benefits in the event of risk realization. Secondly, the burden of social contributions was divided between employers and employees. Those changes could have led to a material alternation in the subjective quasi-tax rates. Also launching of defined-contribution retirement system (partly capital funded), which replaced the pay-as-you-go defined benefit one, could have got the ground off for greater internalization of the social contribution charges.
Other aspect of the social security system reform were restrictions imposed on the access of non working population to the healthcare insurance. Since 1999 only the registered unemployed have been eligible to public healthcare without having had to fulfill other criteria or cover the cost of the services. Therefore the reform made the situation of those unemployed significantly more attractive than those of non-participants. The effects mentioned above, namely an increase in the internalization of the quasi-tax burden and stricter constraints put on entitlement to public healthcare, can be expected to have had opposite impact on the natural unemployment rate.
Two other phenomena could have had some impact on the NAWRU. In the period considered, the baby boom generation entered the labour market, which was coupled with relatively high unemployment of the young. Through compositional effects, it could have led to a transitional raise in the natural unemployment rate. Secondly, after the EU
1 Under social benefits I understand survival benefits, pre-retirement benefits and allowances, alimony, child, family, maternity and nursing benefits, rent allowances (and some other benefits of similar character).
2
Labour market in Poland
accession emigration propensity increased sharply leading to a marked outflow of population in the working age to the former European Union countries. The outcome of removing some of the barriers for the entering of foreign labour markets can be higher expected utility of workers after job separation. These labour supply factors were however not taken into account in the empirical analysis. The former because of labour homogeneity assumed in the existing model. The latter mostly due to lack of respective data but also because of an conceptual ambiguity of the influence of the better emigration opportunities on the NAWRU.
3
NAWRU in ECMOD model3
NAWRU in ECMOD model
The ECMOD model is a forecasting and simulation tool of the National Bank of Poland. It is a hybrid, supply-demand model. Behavioral equations include cointegrating vectors which embody theoretical long run relationships between macroeconomic variables. Here, only the general, non-technical summary of the key model elements are delivered. For more detailed depiction of the model look in Fic et al. (2005).
The ECMOD model consists of seven blocks: production, markets for production factors, aggregate demand, prices, external sector, general government sector, economic policy. The segmentation of the into separate sectors is equivocal and set out only for the ease of description.2 The production technology is described by the Cobb-Douglas function. The function constitutes the base for the potential product calculation.
There are two factors of production: capital and labour. The capital stock is accumulated in line with the investment process. The investment demand is in turn related to the aggregate demand in the economy and the real user cost of capital. The labour market is described by the employment and wage equations. The employment equation refers to the inverse of the production function. The wage equation hangs on the labour productivity, prices and the difference between the actual unemployment rate and the NAWRU (the unemployment gap).
Prices’ block consists of equation describing the core CPI dynamics, the fuel prices dynamics and the GDP dynamics. Import and export prices enter the external sector block. The core of the external sector is the exchange rate equation with the long-run appreciation trend in the real exchange rate ascribed to the workings of the Balassa-Samuelson effect. Deviations of the real exchange rate from the long-run path affect import and export prices and indirectly imports and exports.
The actual GDP is calculates as a sum of its components. Namely the net exports, investments, stocks of inventories and the private and government consumption. The general government sector takes account of all major expenditures and revenues categories. The general government sector balance is the difference between sum of expenditures and revenues. The public debt is calculated as the accumulated general government balance. Two rules close the model: Tylor-like monetary policy rule and the fiscal rule which stabilizes the general deficit to the GDP ratio.
In the original version of the model, the NAWRU was estimated outside the model and introduced into the model purely exogenously. It represented the level of the unemployment rate which (if the labour supply remains constant) limits the potential product of the economy and is consistent with the stable wage inflation. The deviation of the current from the natural unemployment rate contributed to the output gap. In fact, the NAWRU affected the price level via two channels: by the presence of the output gap term in the core inflation equation and the presence of the unemployment gap in the wage equation.
In forecasting and simulation exercises the NAWRU constituted the expert input. Still, the interactions between the natural unemployment rate and the other macroeconomic variables were heavily constrained to the one-way dependencies. This
2 In particular the authors of the model prefer to distinguish six separate sectors with slightly different split of the equations between the blocks.
3
NAWRU in ECMOD model
modelling approach motivated apparent questions about the integrity of the forecast of the equilibrium unemployment rate and the projections of the remaining economic categories. The ECMOD model encompasses all key macroeconomic variables and a relatively complex (in its model category) fiscal module. Therefore, intuitively, changes of some of the variables present in the model could be expected to have a bearing on the level of the NAWRU. Not least importantly, the cointegrating relations in the ECMOD model stand for the long run equilibrium of the economy. In the equilibrium the natural unemployment rate should be identified. The external estimates of the NAWRU gave no guarantee of cohesion between the NAWRU and the model equilibrium.
These were the rationales for the NAWRU endogenization in the framework of the forecasting model. The model augmented with the endogenous equilibrium unemployment rate was expected to deliver more coherent responses of the modelled economy to supply side shocks. In the effect, it should represent better forecasting device for the needs of conducting monetary policy in Poland. On the other hand, mapping out the natural unemployment rate in the ECMOD framework put some constraints on both estimation process and ways of the NAWRU determination. Two conditions had to be fulfilled: the original structure and logic of the model had to be preserved and the natural unemployment rate be forecastable.
4
Bargaining model4
Bargaining model
The empirical model of wages and consequently of the NAWRU is based on the bargaining model of McDonald and Solow (1981). The wage bargaining model delivers the rationale for real wage rigidity and for persistence of non-zero unemployment rate in the equilibrium.
McDonald and Solow consider bargaining process over both wages and employment between a union and a firm. The firm maximizes profit πas the difference between revenues and the labour cost, subject to the level of wages and employment
where Lstands for the level of employment, wthe wage rate and R(L)revenues as a function of employment. The objective of the union is to maximize expected utility of its members. If the union has Nmembers and out of those Lare employed then the expected utility of the representative union member is given by:
where first part of the expression is the utility from receiving the wage rate w
corrected for some fixed disutility of working D. U(b)stands for utility from receiving an income bwhen unemployed (bcan be thought of as an unemployment benefits or other form of support for low-income households).
The outcome of bargaining will be efficient if one party cannot be better off without infringing the welfare of the other. Efficient combinations of wages and employment are points in a wage-employment plane where slopes of the union indifference curve and the firm's isoprofit curve are equal. Therefore the efficiency condition for bargaining is:
where w*is the reservation wage rate defined by U(w*)=D+U(b). Wage rates below
w*do not compensate employed workers for disutility of working and receiving income b
when unemployed. When the wage rate is close to w*union members remain indifferent between working and unemployment.
Chamberlin et al. (2002) argued that preferences of the union and the employer in the bargaining process can be represented by two separate cointegrating vectors. Namely:
p(L) 5 R(L) 2wL L N — L N —
(
U(w) 2D)
1(
1 2)
U(b)(
U(w) 2U(w*))
!
U'(w) 5 w 2 R'(L) w 2 R'(L) 5 H‚ (1) (2) (3) (4)4
Bargaining model
His a variable which captures relative bargaining power of the firm and the union. The authors interpret above equations as ”labour demand” and ”labour supply” relations. Moreover, they show that these cointegrating vectors are overidentified in a full system describing labour and goods markets.
Here, I refer to the results of Chamberlin et al but move one step further. I treat the first cointegrating vector as the ”price curve” constituting ”warranted wage” condition and the latter as the ”wage curve” binding wage level with the unemployment rate. Eventually, the NAWRU shall be laid out as a rate of unemployment for which both conditions (4) and (5) are satisfied. That perspective of worker-employer relations assumes that in the equilibrium labour market does not clear because of the real wage rigidities on the labour market and, possibly, due to frictions on the other markets (reflected in H).
The unemployment rate included into the second cointegrating vector is a measure of the labour market tightness and, at once, a discipline device for workers. The higher is the unemployment rate the stronger are fear (worse fallback position of workers after the job separation) and threat (higher probability that the firm will be able to replace fired workers with some new ones) effects which in turn lead to lower wage pressure of employees.
The approach used in the paper corresponds with the ”wage curve” specification of the relation between wages and the unemployment rate. The ”wage curve” captures the relation between level of the wage rate and the unemployment rate in contrast to the Philips curve specification which base on the relation between the rate of growth of wages and the unemployment rate.
5
Empirical model of wages and employment5
Empirical model of wages and employment
The cointegration relations corresponding with the ”price curve” and the ”wage curve” constitute foundation of the new labour market module in the model. The „price curve” cointegrating relation enters the wage and the producer prices (GDP deflator) equations. Further, the ”price curve” is consistent with the long-run relationship describing core inflation and with the employment equation. The presence of the ”price curve” cointegrating relation in the above mentioned behavioral equations reflects interrelation of pricing, employment and wage decisions of firms. All of those are based on profit maximizing behaviour. The estimated cointegrating vector derived from the first order condition for profit maximization has a form:
where wage is the average nominal wage rate in the economy, glt_corp_tr the effective rate of social contributions levied on employers, gdp is product (measured by GDP), pgdpis the producer price level (measured by GDP deflator), p_imp*is the import price level (measured by import deflator) adjusted for custom duties and import tax rates
and empnais the non-farm employment level. All variables are given in logarithms and their
full description is given at the end of the article. Long run elasticity of wages to labour productivity equals one. Parameter θ1stands for the elasticity of the wage rate to the price
level. Long run dynamic homogeneity restriction is imposed on the elasticities so that the wage growth in the long run is constrained by the growth rate of the labour productivity and prices.
The relation (6) is corrected with the dummy d99q1for grossing up of wages in 1999. The objective for including dummy into the estimated long-run relation was twofold. The average wage time series was corrected for years 1995–1998 using theoretical rate of social contributions. In case the adjustment which was carried out infringed comparability of time series in the two subsamples (before and after 1999) to the dummy should control for possible correction error. Secondly, the dummy was expected to capture any spillovers from introduction of the reform of the social insurance system.
Rearranging (6) I get the relationship between the producer prices, the import prices and the unit non-farm labour cost ulcna:
The long run equation (7) corresponds closely with the cointegrating relation present hitherto in the ECMOD model. The only differences lie in the unit labour cost definition (which includes the effective rate of social insurance contribution) and presence of the year 1999 dummy.
The ”wage curve” cointegrating vector is based on the relation between the aspiration real net wage of employees and their shadow wage. The real net wage is
wage 1 glt_corp_tr 2 gdp 1 empna 2 (1 1 u1) pgdp 1 u1p_imp*2
2 u2 (1 2 d99q1) 2 u0 5 02
(6)
2
5
Empirical model of wages and employment
represented by the average wage deflated with the CPI, corrected for the social security contributions (the effective rate of social security contributions levied on employees
glt_emp_tr and and the effective rate of the healthcare insurance glt_hc_tr ) and the
personal income tax rate gpit_tr. The variables which have a bearing on the bargaining position of workers include: the unemployment rate unemp, the unemployment benefit replacement rate rp_benefit(in logarithm) and the social relief replacement rate rp_relief(in logarithm). The dummy controls for sharp deterioration of generosity of the unemployment benefit system after the reform in 1997. Some other variables were taken into consideration in the process of estimation: the minimum wage, demographic variables, variables controlling for the reform of the social insurance system. However performance of regressions including those variables was disappointing. Ultimate ”wage curve” relation has the form of:
where cpi consumer price level (measured by CPI) and tfp the total factor productivity, both variables are given in logarithms.
Both in (6), (7) and (8) the unit direct elasticity of wages to social contribution rates and personal direct tax rate was assumed. Although, the elasticities of the wage rate to tax and quasi-tax rates were calibrated that was only the second-best solution. The estimation of the elasticities was impeded by low in-sample variability of the social insurance and tax rates. It may be expected that pass-through of fiscal burden into wages is in the long run higher and, as a result, less detrimental for the labour market, than it is accepted in the paper.
The irrelevance theorem does not hold even if the direct elasticities of wages are equal. The retirement, disability, sick and accident insurance contribution rates enter via both replacement rates when the direct income tax rate and healthcare only via the social relief replacement rate. In the effect, responses of wages and employment to changes in various fiscal charges will be slightly different.
The presence of the TFP in the ”wage curve” manifests the proposition that workers take into account labour productivity changes when negotiating wages. Although there is consensus in the literature how exactly labour the productivit affects the shadow wage, the productivity term into ”wage curve” asserts an absence of a trend in the equilibrium unemployment rate.
The parameter which precedes TFP was calibrated as the inverse of the elasticity of product to labour input α in Cobb-Douglas production function and the unit elasticity constraint was imposed on the wage rate to the consumer price level elasticity to preserve the long-run dynamic homogeneity. The cointegrating vectors (7) and (8) were estimated separately using Engel and Granger two-step technique. Joint estimation of the two cointegrating vectors could not be applied due to insufficient time series length. In fact I referred to the results of Chamberlain et al. (2002) and assumed that these cointegrating vectors are identified but I did not test that assumption. One additional restriction was imposed on the elasticity of the wage rate to the social relief replacement rate in the ”wage curve” cointegrating vector. Namely, it was assumed that the elasticity of wages to the social assistance replacement rate is one third of the elasticity of the wage rate to the unemployment benefit replacement rate. The restriction curtails the magnitude of the effect of the average relief changes on the average wage and the NAWRU. The social assistance benefits are an important source of income for households of unemployed. Nevertheless, the restriction was imposed to account for the fact that the average social relief time series is the aggregate measure of the generosity of the social support systems (the average social relief time series is calculated on the basis of the ministry's of finance
2
wage 2 glt_emp_tr 2 gpit_tr 2 glt_hc_tr 2 cpi 2a21tfp 1 b
1unemp 2
2b2rp_benefit 2 b3rp_relief 2 b4(1 2 d97q1) 2 b05 0
5
Empirical model of wages and employmentfinancial statements and includes all forms of public support for households apart form retirement, disability and unemployment benefits) and did not necessarily corresponded closely with the dynamics of the benefits addressed to unemployed. The other problem was inability to distinguish between social benefits which have a bearing on duration of unemployment and benefits which push their recipients out of the labour market. Plausibly, significant share of the social relief benefits have stronger effect on the activity rate and the labour supply than on wages (and through this channel on the unemployment rate). Therefore, both quality of the time series and the twin economic role of the social relief benefits made it desirable to avoid too strong responses of the wage rate and the NAWRU to changes in the social assistance replacement rate.
The short-run employment and wage equations are given below. The ordinary least squares method was employed to estimate the equations:
The first regression models the growth rate of employment in the economy empas dependant on the labour supply lfand demand-push factors (deviation of the GDP from the long run trend fixed by the growth rate of TFP). There is certain degree of inertia in employment dynamics. Moreover, the employment is positively related to the level of real expenditures on the active labour market policy per unemployed almp. The active labour policy was accounted for in the model greatly with respect to an increased role of that policy after joining the EU. The cointegrating vector entering the employment equation reflects the inverse of the Cobb-Douglas production function and its parameters were calibrated. Again the number of economically active, the stock of capital kand the active labour policy expenditures are expressed in logarithms.
The nominal wage regression includes two cointegrating vectors described in (6) and (8). The estimate of the half elasticity of the wage rate to the unemployment rate is 1.21 which remains close to the standard estimate of the parameter based on the micro data. Short run dynamics of wages depends on inflation and labour productivity growth and is characterized by significant degree of inertia.
Dempt 5 0.74Dlf 2 0.06
(
gdpt–1 2 0.68empt–1 2 0.32kt–1 (1.2) 1 tfp_hpt–1)
1 0.26Dempt–1 1 0.02 almpt–1 1 1 0.31 (Dgdpt–1 2 Dtfp_hpt–1 ! 0.68) 1 dummies, (2.2) (2.8) (0.8) R2 5 0.68, DW 5 2.00, (9) (24.6) (22.1) (2.5) (2.6)Dwaget 5 0.29Dwaget–1 1 0.28Dwaget–2 1 0.43Dcpit–1 2
1 0.43D(gdpt!empnat) 2 0.10
(
waget–1 1 glt_ corp_trt–1 22 gdpt–1 1 empnat–1 2 1.45pgdpt–1 1 0.45p_imp*t–12
2 0.07(1 2 d99q1) 2 4.87
)
2 0.05(
waget–1 2 cpit–122 glt_emp_trt–1 2 gpit_trt–1 2 glt_hc_trt–1 1 1.21unempt–1 2
2 0.68rp_benefitt–1 2 0.22rp_relieft–1 2 0.08(1 2 d97q1) 2
2 1.47ftpt–1 2 1.87
)
1 dummies,R2 5 0.79, DW 5 2.34.
5
Empirical model of wages and employment
In both the employment and the wage equation dynamic homogeneity holds both in the long run and in the short run. The elasticities of the growth rate of employment to the past realization of the employment growth and changes in labour supply are jointly constrained to one. Short run dynamics of wages depends, in turn, on past realizations of wage dynamics, inflation and labour productivity growth. The restrictions on the coefficients in the wage regression assure that the nominal wage rate moves in line with the price and labour productivity levels. Lower coefficients on the ”wage curve” relationship in the wage equation suggests that pace of convergence to the level of wages desired by workers was historically slower than accommodation of deviations form optimal level of wages on the side of employers (convergence to the ”warranted wage” level.
6
NAWRU6
NAWRU
6.1 Short run NAWRU
The unemployment rate which prevails on the labour market when the outcome of wage bargaining is efficient may be calculated once the ”price curve” and the ”wage curve” relations (6 and 8) are estimated. If the wage level satisfies both cointegrating relations, the wage growth follows inflation and labour productivity changes.
In the first step, I equalize both relations and rearrange the terms to get the unemployment rate in equilibrium as a function of structural and state variables included in the cointegrating vectors:
where:
The unemployment rate in the equilibrium depends positively on the tax wedge, the difference between consumer and producer prices which I call the price wedge and the unemployment benefits as well social relief systems generosity. As stated earlier, the production function includes two factors of production: capital and labour. Labour input is represented by the employment in the economy:
Still, the labour input relevant for the first order condition for profit maximization in (6) and (7) is non-farm employment. The intention behind introduction of this apparent discrepancy is to avoid problems with estimating the ”price curve” cointegrating vector (or the core CPI cointegraing vector) originating in the high variation of employment in the agricultural sector foremost around the turn of the century that was driven by structural changes. These institutional changes have led to high variation in agricultural employment dynamics what in turn impaired the link between the GDP, the level of aggregate employment and the level of wages. Subtracting from both sides of (12) the logarithm of the non-farm employment and rearranging I get:
unemp 5 b1–1(tax_wedge 1 price_wedge 1 u1tot 1
1 benefits 1 reform99 1 const 2 gdp 1 empna 1 a21tfp)
(11)
tax_wedge 5 glt_corp_tr 1 glt_emp_tr 1 gpit_tr 1 glt_hc_tr,
price_wedge 5 cpi 2 pgdp, tot 5 p_ imp* 2 pgdp,
benefits 5 b2rp_benefit 1 b3rp_relief 1 b4(1 2 d97q1),
reform99 5 2 u2(1 2 d97q1),
const 5 b0 2 u0
6
NAWRU
The last term in the above equation can be approximated by the ratio of the employed in agricultural sector to the economically active population δ. Next, to remove employment term from the formula, I refer to other approximation unemp=lf – emp.
Ultimately I get the short run NAWRU as a function of the cointegrating vectors' parameters, variables present in the ”price curve” and the ”wage curve”, the stock of capital and the economically active population:
Two parameters play important role for variability of the NAWRU: the elasticity of GDP to labour input αand the semi-elasticity of the wage rate to the unemployment rate β2. The
higher the elasticity of product to labour input and the lower the semi-elasticity of wages to unemployment rate the stronger is the pass-through of changes in taxes or in social benefits replacement rates into the equilibrium unemployment. The intuition behind this result is straightforward. The more responsive are wages to changes in the unemployment, the stronger the wage adjustment to shifts in labour demand and labour supply and the lower adjustment is needed in the level of employment.
The equilibrium unemployment rate depends on the relation of the labour force to the capital stock. Increase in the labour supply as long as it is not met by raising capacity of the economy which would facilitate absorption of the excess labour force, leads to a surge in the NAWRU. Presence of δin (14) relates the natural unemployment rate positively to outflows of workers from agriculture. Similarly, an increase in the level of the TFP in the short run results in an increase of the equilibrium unemployment rate. Startling as it may seem, it is a consequence of the assumption of no long run trend in the equilibrium unemployment rate and workers' rational perceptions of the actual level of the labour productivity.
The historical track of NAWRU was calculated based on (14) and the high frequency fluctuations in the variable, which were mainly tied to the fiscal time series variability, were removed with the Hoderick and Prescott filter (Figure 9). Figure 10 shows that the equilibrium unemployment rate in 1995 remained at the level around 16% and the actual unemployment rate was at the level of around 14%. Until 1999, both the natural and the actual unemployment rate were decreasing and the negative unemployment gap was gradually narrowing. The drop in the equilibrium unemployment rate in this period can be greatly attributed to the reform of unemployed benefit system in 1997 and the improvement in the terms-of-trade following marked reduction of the import tariffs.
In the aftermath of the negative foreign demand shock originating in the financial crises in Russia in 1998 the unemployment rate started to swell. The NAWRU bounced back from all time low of 12% in 1999 to come back to around 16% in 2003. The unemployment gap was widening until 2002 when the unemployment rate peaked at 20%. The increase in the NAWRU at the end of '90s was an unintentional outcome of the far-reaching reform of the social insurance system. As already mentioned, the reform could have had a twin effect on the labour market. On the one hand, an allotment of the social contribution to employees and employers and reinforcing of the link between payment of contributions and being eligible for benefits could have exerted the negative pressure on
gdp 2 empna 2 tfp 5 (1 2 a)(k 2 emp) 2 (empna 2 emp) (13)
nawru 5 (12 a 1 b1)–1
(
tax_wedge 1 price_wedge 1 u1tot 1 benefits 11 reform99 1 const 1 (1 2 a)(lf 2 k ) 1 (a–1 2 1) tfp 2d
)
(14)6
NAWRUthe labour costs via greater internalization of the fiscal burden by workers. On the other hand, the reform also introduced changes in the healthcare insurance system which upgraded the attractiveness of the unemployed status as compared with the non-participation. The net effect of the reform for the natural unemployment rate, approximated by the difference of the relevant parameters estimated in (7) and (10), appeared to be positive. At the turn of the century the restrictiveness of the unemployment benefit system started to loosen which was reflected in the gradual rise of the unemployment benefit replacement rate. The last factor which contributed to an increase in the equilibrium unemployment rate was unfavorable development of the relative prices. The price wedge increase fostered by the raise of the effective indirect tax rates and worsening of the terms-of-trade in line with the strong depreciation of the zloty between 2002 and 2003.
The economic revival, at the end of the period under consideration, facilitated a moderate fall in the unemployment rate and a steady narrowing of the unemployment gap. The NAWRU indicated limited downward correction from the beginning of 2004. The reduction of the NAWRU was linked to the acceleration of investments coupled with a slowdown of the total factor productivity dynamics. Moreover, some restrain of the unemployment benefits system generosity and a strengthening of the zloty acted in the same direction.
6.2 Long run NAWRU
In the long run the NAWRU is expected to converge to a level which is dependent solely on institutional factors. In other words, in the long run the equilibrium unemployment rate is not path dependent. The long run concept of NAWRU is close to the equilibrium unemployment rate discussed by Gordon (1997) and Gordon and Stock (1999). As such it can be interpreted as the reference unemployment rate which prevails on the labour market when the inflation rate is on its steady-state level.
The level of the steady-state NAWRU can be calculated with reference to some other equations of the model. The long run relation between the real user cost of capital rucc(in logarithm) and the marginal product of capital in the investments equation has a form:
Merging (15) with the production function I get:
Getting back to (11) the gdp – empnain the equilibrium unemployment formula may be replaced with:
which, in turn, leads to:
ln(12 a) 1 gdp 2 k 2 rucc 5 0 2 (15) a(emp 2 k) 1 tfp 5 rucc 2 ln(12 a) (16)
( )
———a 2 1 a (rucc 2 ln(12 a) 1 d (17)6
NAWRU
The steady-state NAWRU nawru*depends on the user cost of capital and is autonomous
to changes in both labour supply and capital stock. In the long run, the capital stock is pinned down by the marginal cost of capital which in turn depends heavily on institutional factors (fiscal charges imposed on profits, mark-ups in the banking sector).
To move further I refer to the price equations to replace the price wedge and the terms-of-trade with their postulated steady-state levels. In the long run the price wedge shall converge to the level fixed upon by the effective indirect taxes rates and mark-ups in the economy:
where gvat_tr is the effective VAT rate, gext_trthe effective rate of the excise duty tax,
ggam_trthe effective gaming tax rate and gtr_goods_tr the effective rate of the goods
subsidies.
The relation above corresponds with CPI and producer prices (”price curve”) cointegrating vectors. The former has a form:
Elasticity of the consumer prices to changes in the non-farm unit labour cost and the imports prices is equal to the elasticity of producer prices to these factors. The constant from (19) fulfills the relation ν0=α0−ν03.
The steady-state terms-of-trade may be established on the base of the import prices and the effective exchange rate cointegrating relations. In the long run the import deflator excluding oil prices p_imp_noil fulfills the relation:
In the relation above pgdp_extis the foreign price level (measured by weighted average of GDP deflator of main trade partners of Poland), s_neeris the effective exchange rate of the zloty, gdp_potis the potential GDP and finally gdp_pot_extis the weighted potential GDPs abroad. All variables are expressed in logarithms.
The equation (21) says that the relative prices of imports depend on the deviation of the real effective exchange rate from its long run path. Long run path of the real exchange rate hangs on the relative potential GDP in Poland as compared with the potential GDP of its trading partners. That term approximates the Balassa-Samuelson effect which is plausibly of relevance in the catching-up economy.
a 2 1 a
———
nawru* 5 b1–1
(
tax_wedge 1 price_wedge 1 u1tot 11 benefits 1 reform99 1 const 1
( )
(rucc 2 ln(12 a)) 2 d)
(18)
cpi 2 a1ulcna 2 (12 a1)p_imp* 1 a2(12 d99q1) 2 gvat_tr 2 gext_tr 2 ggam_tr 1 gtr_goods_tr 1 t0 5 0 2
(20)
p_imp_novil 2 pgdp 2 h1
(
s_neer 1 pgdp_ext 2 pgdp 22 c(gdp_pot 2 gdp_pot_ext)
)
1 eta0 502(21)
price_wedge* 5 gvat_tr 1 gext_tr 1 ggam_tr 2 gtr_goods_tr 2 n0 (19)
3 Some empirical inconvenience appears because the GDP deflator is used as an approximation of the producer price level. In reality, GDP deflator should depend on indirect taxes as well as on the subsidies to goods. However, I prefer to ignore it to preserve the unit elasticity of the price wedge to indirect tax rates.
6
NAWRUThe factors which nail down the equilibrium exchange rate may be extracted from the exchange rate cointegrating relation:
The dummy d04q2 in (22) stands for the positive shift in the Polish trade competitiveness after joining the European Union. After merging (21) and (22) I get the terms-of-trade as a function of the net foreign assets position of the country (measured as the net foreign assets to GDP ratio nfa_gdp), the interest rates disparity (where i_w3mis the short-term interest rate in Poland and i_w3m_extis the weighted short-term interest rate abroad), the effective rate of tariffs gtar_trand other structural factors implicitly present in constants and dummies.
The result above requires some comment. The net foreign assets position of Poland measured by net foreign assets to GDP present in (23) is clearly a state dependent variable. The fact can raise doubts whether it should enter the steady-state formula for the terms-of-trade. The argument which supports the presence of the net foreign position in the expression is that the net foreign assets in ECMOD implicitly depends both on fiscal (the general government debt) and monetary (interest rates) policies. It makes the variable strongly institution dependent and, as such, a good measure for the economic policy changes. Apart from that, the steady-state value of net_gdp, is not fully traceable on the basis of economic assumptions in the model only.
The dependency of the relative import to production prices from the net foreign asset position assures that in the long run the country net asset position is balanced. The interest rates disparity in (23) can be thought as an approximate measure of changes in the consumer time preferences. The presence of the interest rate disparity reinforces the impact of changes in the consumption smoothing behaviour of consumers on the NAWRU which would otherwise operate only via the net foreign asset position. The moment the saving propensity of consumers drops the real interest rates adjusts upward exerting negative influence on the terms-of-trade. That partly counteracts the worsening of the current account balance and in consequence improves the net foreign assets position of the country after the shift in the preferences.
For simplicity I assume that the long run level of the imported oil prices is the same as the level of the non-oil import prices and incorporate (23) into (18) to get final expression for the steady-state NAWRU:
where:
s_neer 1 pgdp_ext 2 pgdp 2 c(gdp_pot 2 gdp_pot_ext) 1 γ1nfa_gdp 1
1 γ2(i_w3m 1 i_w3m_ext) 1 γ3d04q2 2 γ0 5 0 2
(22)
p_imp_noil* 2 pgdp 5 gtar_tr 2 h1
(
γ1nfa_gdp 1 γ2(i_w3m 2 i3m_ext) 11 γ3d04q2 2 γ0
)
1 h0(23)
1
( )
———a 2 1 a (rucc 2 ln(12 a)) 1 d]
nawru* 5 b1–1
[
tax_wedge* 2 u1h1γ1nfa_gdp 2 u1h1γ2(i_w3m 2 i3m_ext) 26
NAWRU
The steady-state natural unemployment rate depends mainly on the fiscal and monetary policy variables. Imposing higher fiscal charges on labour and capital (via the user cost of capital) shifts the steady-state NAWRU upward. Similar effect may be achieved via increasing of the social transfers. The trade policy matters as well. Cutting tariffs introduces a drop in the long run equilibrium unemployment rate.
In contrast to the short term NAWRU reaction of the long term equilibrium unemployment rate to institutional changes does not hinge on the elasticity of GDP to labour input parameter. The absence of the parameter in the steady-state unemployment rate formula is tied to the assumption that the capital stock adjust fully to changes in policy. The magnitude of the long run NAWRU response to structural shifts is affected only by the semi-elasticity of the wage rate to the unemployment rate.
On the basis of formula (24) I was able to calculate the long-term equilibrium unemployment rate for Poland and stake out its evolution over the last decade. On account of the fact that the long term NAWRU calculation could be heavily undermined by manipulation of the model parameters and quality of the variables, I concentrated only on trends discernible in the long term natural unemployment rate not on its level or the magnitude of changes.
First, there is a strong correlation between the steady-state unemployment rate and the user cost of capital. Strong swings in the real interest rates in the period under consideration found their reflection in the high variation of the steady-state NAWRU. To proceed with description of an evolution of the steady-state unemployment rate I constrained the period for which I mapped out the long term NAWRU to 1997-2005 (Figure 11). It allowed me to drop out the jump in the NAWRU originating in an ostensible fall in the real interest rate in 1996 tied to the one-off acceleration of GDP deflator growth. Next, I recalculated the NAWRU with the natural interest rate (4% for the whole period considered) in lieu of the actual real interest rate to separate fiscal and monetary policy impacts on the labour market4(Figure 12). The analysis I conducted should be treated as leading only to a very rough separation of monetary and fiscal policy impact on the labour market in the long run.
The key driver of the long term NAWRU changes was the user cost of capital. The high user cost of capital tied to the excessive level of the real interest rates in a period between 1998 and 2000 contributed to a rise in the long run unemployment rate. Starting from 2001 the monetary policy induced the reduction of the steady-state NAWRU. Both capital taxation and depreciation rates amplified the impact of the interest rates on the labour market having been raised before 2000 and reduced later on. In the effect NAWRU remained at considerably high level until the mid 2001 to set forth for gradual decline after that date.
Among labour market policies the one which had the most pronounced impact on the path of the long run NAWRU were the unemployment benefits. Higher restrictiveness of the system depressed the long run unemployment between 1998 and 1999. In the next three years higher generosity of the system modestly lifted the steady-state NAWRU. In the last years within the sample period the unemployment benefit system had neutral or moderately negative influence on the long run natural unemployment rate. Not less important change in the social policy was the social insurance system reform in 1999 which
4 Still, the actual real interest rate was present in the interest rates disparity. The capital and the net foreign asset position channels tend in the steady-state NAWRU to cancel out and the former outweighs the latter.
tax_wedge* 5 tax_wedge 1 price_wedge* 1 u1ggat_tr,
6
NAWRUshifted the long run NAWRU upward. High level of the long run equilibrium unemployment before 1999 was reinforced by a marked outflow of labour force from agriculture. Interestingly when the longer term trends in the monetary and the fiscal policy (Figure 12) are compared that is the latter which seems to have contributed more to the increase of the steady-state unemployment rate in the last years.
Impulses
7
7
Impulses
There were some other model changes introduced together with the endogenous NAWRU. The non-farm as well as economy unit labour cost formulas were changed to take account of fiscal component of labour costs (mainly social security contributions). Core CPI long run equation was explicitly augmented with the effective indirect taxes rate. Other changes of weaker influence on simulations' results embrace the real capital cost definition, more detailed treatment of different tax revenues, subsidies and social transfers. Those changes were compelled, first of all, by a pursuit to ensure possibly high cohesion between the new wage equation as well as the equilibrium unemployment and the rest of the model. Secondly, they were implemented to amend the model with new linkages between fiscal and real sector which had been so far lacking.
Six different impulses are presented. Short-term interest rate impulse has been defined as in Fic et al (2005) to offer straightforward comparison between the model before and after introduction of changes. Next I traced responses of the system to different fiscal shocks and verified how well they correspond with economic intuition. I compared the influence of different fiscal policies on inflation, growth and labour market. Namely, I described the effects of changes in effective tax or social contribution rates, changes of generosity of unemployment benefits system and expansion of current government expenditures.
7.1 Monetary impulse
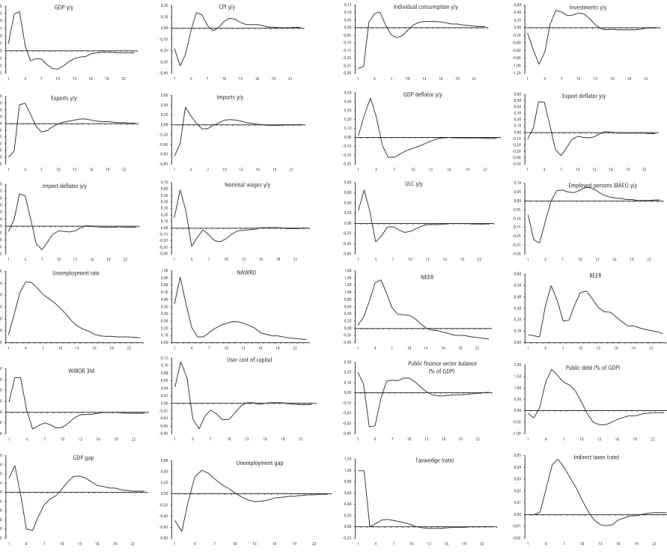
The monetary impulse displays the reaction of the modelled economy to a rise of the short-term interest rate by one percentage point over eight quarters. Impulse reaction functions are given in Figure 13.
The short-term interest rate hike triggers appreciation of the zloty through an increase of the interest rates disparity and actuates a rise of the long-term interest rates. The initial impact on the real economy is a drop in investments due to the upsurge of both short- and long-term interest rates and a decline of individual consumption dynamic. The GDP decceleration which follows, presses imports dynamics down and at the same time the strengthening of the zloty leads to a decrease of exports. In the result there is an improvement in the trade balance.
Decline of the aggregate demand encourage firms to cut both wages and employment. The unemployment rate picks up reinforcing negative pressure on wages. Inflation falls in line with reduction of the unit labour cost and import prices.
When the actual unemployment rate moves up after the demand for labour decreases NAWRU actually goes down so that the unemployment gap widens. Lowering of the equilibrium unemployment rate is bound to the import prices moderation the effect which allows firms to save on production cost by given home price level.
After eight quarters short-term interest rates are allowed to follow the Taylor rule. Low level of both inflation and economic activity induces easing of the monetary policy. Downward correction of short-term interest rates facilitates the economic revival and raises growth rate of prices so that the modelled economy eventually converges to the baseline path.
Impulses
7.2 Social contribution effective rate impulse
Social contributions' burden in Poland is shared by employers and employees. The social contribution levied on employers directly affects the unit labour cost. The social contribution paid on the gross wage influence the unit labour cost only indirectly. Changes in the effective social contribution rate levied on employees impinge upon the net wage and through this channel drive on increase of the wage pressure. Consequently, it can be expected that the effective social contribution rate's shift leads to different outcomes, at least in the short run, depending on whether it concerns employer's or employee's social contribution tax rate.
I compared the reaction of the economy to the effective social contributions rate increase in two disparate cases: the raise of the employer's social contribution burden by one percentage point and similar-scale upsurge of the social charges of employees for a period of two years. After contractionary fiscal impulse fades out the fiscal rule stabilizing the public finance sector balance sets about. To take account of the design of Polish pension system I imposed an additional assumption on both simulations that social contribution rate hikes concern only the pay-as-you-go share of the retirement insurance contribution. In other words, I assured that the social contribution public sector revenues increase proportionately to the social contribution rate changes and the open pension funds revenues remain intact. Juxtaposition of impulse reaction functions is given in Figure 14 and Figure 15.
After the social tax rate's increase the unit labour cost goes up. An acceleration of the unit labour cost is initially more pronounced when higher social contribution is levied on employers. In the other scenario, when higher social contribution aggravates the after tax income of employees, a fall in the net wage rate and a concurrent increment of the shadow wage (higher effective contribution rate has a bearing on relative attractiveness of social relief benefits as compared with the market wage rate) empower the wage demands of workers. The resulting wage pressure, amplifies the unit labour cost and prices growth. Firms save on labour reducing employment which leads to a surge in the unemployment rate.
Due to the social relief replacement rate upping, the NAWRU increases more sharply and employment drops more deeply when social contributions rate paid by employees goes up. The swell of quasi-tax burden exerts negative influence on the equilibrium unemployment rate in both scenarios. Unemployment adjustment to the new equilibrium rate is slack which induces opening of the unemployment and the GDP gaps.
In reaction to higher inflation than in the baseline scenario, monetary policy tightens, reinforcing the negative impact of fiscal policy on the real economy. Because economic slowdown has a negative impact on the public finance sector, the fiscal policy aimed at balancing the deficit depresses government expenditures and shifts up effective tax rates. That contributes to the restrictive economic policy. Deterioration of the public finance sector balance is more substantial in the response to the employee's social contribution uplift, resulting in restrictive fiscal policy prevailing for longer in that scenario.
Eventually, the shock abates and the inflation is brought back to the benchmark level. However, the convergence is relatively sluggish. First of all, the speed of capital accumulation matters for the labour market even in the medium term. Slackening of investment dynamics tied to high interest rates levels at the beginning of the simulation period reduces the capital stock in successive years maintaining the high equilibrium unemployment rate level. Fiscal policy introduces the other ”hysteretic” effect to the model. Previous decisions of fiscal policy carry some weight for current ones and through this effect can alter transformation path after an economic shock.
Impulses
7.3 Personal income effective tax rate impulse
Personal income tax rate impulse has been defined as a shift in the effective rate of PIT by one percentage point up lasting for two years. In the simulation, after the impulse fades out the fiscal rule sets in. Corresponding impulse reactions functions are pictured in Figure 16.
Following personal income tax rate upsurge two kinds of adjustments set about. On the demand side, a higher tax burden abates the disposable income of households. Due to the effect individual consumption growth falls impairing the aggregate demand. This in turn induces fall of GDP and investments growth in consecutive periods. On the supply side, NAWRU goes up. At the labour market the demand for labour falls because of a general slowdown in the economic activity. At the same time wage pressure originating in reduction of the net average wage swells. What follows is a decrease of employment and a concurrent rise of wages. Finally, the higher unit labour cost pushes up inflation.
Monetary policy reacts to higher inflation with short-term interest rate hikes which further dampens the economic growth. The natural and actual unemployment rate converge to the baseline paths only gradually. The equilibrium rate of unemployment remains high mainly because of the creeping-slow adjustment of the relative prices in the economy. Immediate response of prices to the new tax policy is a deterioration of the level of consumer prices and import prices as compared to GDP deflator. Shrinking price wedge and terms-of-trade originally restrict the growth of the NAWRU. However, after the income tax rate level is reduced back to the original value after two years the same mechanism delay the downward correction of the equilibrium unemployment rate. Ensuing home production price increases, exchange rate and consumer prices slowly adapt.
Transformation path after introduction of the higher PIT rate resembles adjustments which take place after temporary raise in the employee's social contribution effective rate which is tied to the fact that both rates enter the wage equation in a similar way.
7.4 Value added effective tax rate impulse
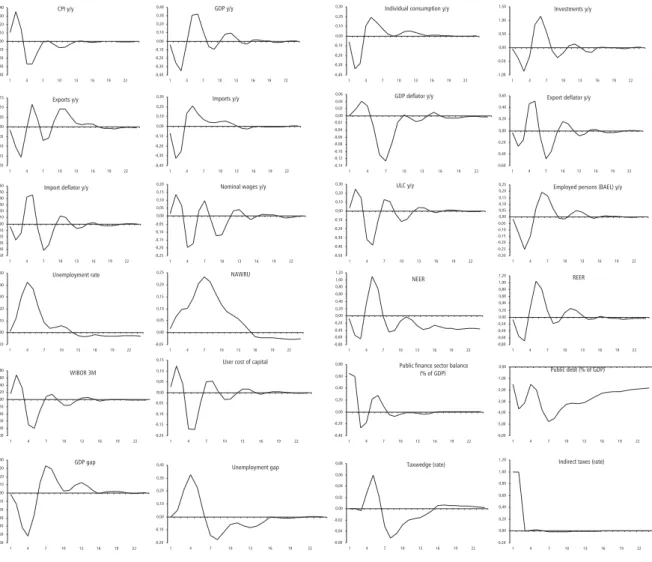
Hikes of effective rates of the indirect taxes have similar effect on the economy as increases of the direct personal effective tax rate or the social contribution effective rates but the channels through which they affect the activity differ foremost in the short run. The indirect tax rate impulse has been defined as an upward shift of the VAT effective tax rate by one percentage point which is sustained for two years. Fiscal rule has been set in after the effective tax rate was reduced back to the previous level. Impulse reaction functions are graphed in Figure 17.
An increase of one percentage point in the indirect effective tax rate inflate consumer prices and, at least in the short run, leaves producer prices (GDP deflator) intact. As a result the price wedge gradually widens and the NAWRU slowly drifts up.
On the demand side, higher VAT charges impair the net operating surplus of companies and soaring consumer prices reduce the real disposable income of households. It leads to a decline in both investment and individual consumption. Lower GDP growth rate suppress the demand for labour which eventually leads to a drop in employment and the growth rate of wages. The zloty appreciation tied to improvement in the public finance sector balance and a successive fall in the exchange rate risk, which is additionally supported by the contractionary monetary policy, further hinder the GDP growth. In the response to the GDP slowdown and in line with the VAT tax rate reduction the inflation gradually converges towards the baseline solution.