Eco-efficiency
for the
Prepared by:
The UNEP Working Group for Cleaner Production in the Food Industry Environmental Management Centre, The University of Queensland, St Lucia Penny Prasad, Robert Pagan, Michael Kauter and Nicole Price
Telephone: + 61 7 3365 1432 E-mail: [email protected]
Sustainable Business
Level 9, 121 Walker Street, North Sydney Patrick Crittenden
Telephone: + 61 2 4268 0839
E-mail: [email protected]
This manual was produced as part of the Dairy Processing Eco-efficiency Project (DAV447) and was funded by Dairy Australia.
DAIRY AUSTRALIA Level 5, IBM Tower 60 City Road
Southbank Victoria 3006 Australia
Telephone: + 61 3 9694 3777 Fax: + 61 3 9694 3733
Acknowledgements
Dairy Australia and the UNEP Working Group for Cleaner Production are grateful to the following individuals for their participation in this project and the development of the manual.
Steering Committee
Ross Nicol Dairy Australia
Susan Blacklow National Foods Limited
Janis Cecins Dairy Farmers
Patrick Crittendon Sustainable Business
Richard Tomsett Bonlac Foods Limited
Neil Van Buuren Murray Goulburn Co-operative Company Limited
Mike Weeks Dairy Processing Engineering Centre
Karin Harding Tatura Milk Industries Limited
Peter Gross Bonlac Foods Limited
Adrian Poon Bonlac Foods Limited
Anthony Best Warrnambool Cheese and Butter Factory Company Limited
Margaret Berbers Parmalat Australia Limited
Mike Jones Queensland Department of Primary Industries and Fisheries
Bob Pagan UNEP Working Group for Cleaner Production in the Food Industry
Penny Prasad UNEP Working Group for Cleaner Production in the Food Industry
Disclaimer:While every attempt has been made to ensure that the information in this publication is correct at the time of printing, errors can occur. The information is provided as general
information only. Specific issues relevant to your workplace should be considered in light of this and on an individual basis. The information provided in this publication should not be construed as legal advice. You should consult with professional advisers familiar with your particular factual situation for advice concerning specific environmental requirements.
Cover images:Dairy Australia, Dairy Processing Engineering Centre and UNEP Working Group for Cleaner Production.
Contents
1 Introduction
1.1
Profile of the Australian dairy processing industry
11.2 Environmental
challenges
31.2.1 Compliance and legislation 3
1.2.2 Water supply and pricing 3
1.2.3 Wastewater discharge costs 3
1.2.4 Energy and energy supply costs 4
1.2.5 Solid waste management 5
1.2.6 Packaging 6
1.3
What is eco-efficiency?
61.3.1 Reasons for adopting eco-efficiency 7
1.3.2 How to carry out an eco-efficiency assessment 7
1.4
Eco-efficiency and environmental management
81.5
Food safety and HACCP
91.6
Key performance indicators
91.7
Achieving best practice in dairy processing
101.7.1 Characteristics of a company that is aiming for best practice 10
1.8 Summary
122 Making eco-efficiency happen in your organisation
2.1
Barriers to eco-efficiency
132.2
Avenues for supporting the implementation of eco-efficiency
142.3
The Murray Goulburn experience
152.3.1 Building skills, knowledge and support through site-based teams 15 2.3.2 Raising management awareness of the benefits of eco-efficiency 17
2.4 Summary
183 Water
3.1
Overview of water use
193.1.1 Water use in dairy factories 19
3.1.2 The true cost of water 20
3.1.3 Measuring water consumption 22
3.1.4 Increasing staff awareness and involvement 23
3.2.2 Efficient process control 24
3.2.3 Leaks 25
3.3
Reducing demand for water: cleaning
263.3.1 Design and selection of processing equipment and process layout 26
3.3.2 Dry cleaning 26
3.3.3 Trigger-operated controls for hoses 26
3.3.4 High-pressure cleaning systems 27
3.3.5 Clean-in-place systems 27
3.3.6 Scheduling or modifying product changeovers 30
3.3.7 Crate washers 30
3.4
Reducing demand for water: utilities
313.4.1 Blowdown in cooling towers and boilers 31
3.4.2 Cooling tower operation 31
3.4.3 Equipment sealing water 32
3.5
Ancillary water use
323.6
Stormwater
333.7
Water recycling and reuse
343.7.1 Condensate recovery 34
3.7.2 Use of membranes for water recovery 38
3.8 Wastewater
393.8.1 Treatment of wastewater 39
3.8.2 Selection of a wastewater treatment system 40
3.8.3 Reuse of treated wastewater for irrigation 41
4
Energy
4.1
Overview of energy use
434.1.1 The cost of energy 45
4.2 Energy
management
464.3
Reducing the demand for steam and hot water
474.3.1 Evaporation 47 4.3.2 Membrane concentration 49 4.3.3 Spray drying 49 4.3.4 Boiler operation 51 4.3.5 Steam delivery 54 4.3.6 High-efficiency boilers 56
4.4
Reducing the demand for electricity
574.4.1 Refrigeration systems 57
4.4.2 Compressed air systems 61
4.4.4 Motors 65
4.4.5 Lighting 67
4.4.6 Air-conditioning and air-handling systems 69
4.5
Heat recovery
714.5.1 Pinch technology 71
4.5.2 Stratified storage tanks 71
4.5.3 Improving the efficiency of pasteurisers and sterilisers 71
4.6
Alternative sources of energy
734.6.1 Biofuels 73
4.6.2 Solar energy 75
4.6.3 Wind energy 75
4.7
Cogeneration
764.7.1 Types of cogeneration 76
4.7.2 Applicability of cogeneration to the dairy processing industry 77
5
Yield optimisation and product recovery
5.1 Overview
785.1.1 Sources of product loss 78
5.1.2 The cost of lost product 79
5.1.3 Further reading 83
5.2 Waste
minimisation
835.3
Improving plant layout and design
845.4
Efficient processing and process control
855.5
Milk receival, initial processing and storage
865.6
Minimising product waste during processing
875.6.1 Optimising start-up and shutdown procedures and changeovers 87
5.6.2 Optimising product formulation 87
5.6.3 Production scheduling 88
5.6.4 Separator de-sludge optimisation 88
5.6.5 Minimising loss of cheese fines 89
5.6.6 Spray dryers and evaporation 90
5.6.7 Product recovery during filling 92
5.7
Maximising product recovery during cleaning
925.7.1 Clean-in-place (CIP) systems 92
5.7.2 Pigging 93
6 Solid waste reduction and value adding
6.1 Overview
966.1.1 Sources of solid waste 96
6.1.2 The true cost of solid waste 97
6.1.3 Solid waste management 98
6.1.4 Supply chain management 99
6.2 Value
adding
1006.3
Recycling and reuse
1026.3.1 Onsite reuse of solid waste 102
6.3.2 Establishing a solid waste recycling system 102
6.4
Reducing the impacts of packaging
1056.5
Disposal of solid organic waste
1076.5.1 Animal feed 107
6.5.2 Composting 108
6.5.3 Soil injection and direct landspreading 109
7
Chemical use
7.1
Overview of chemical use
1107.1.1 Cleaning 110
7.1.2 Detergents, acids and sanitisers 112
7.1.3 Water quality 114
7.1.4 True cost of chemicals 114
7.1.5 Environmental impacts of chemicals 115
7.2
Optimising chemical use
1157.2.1 Chemical types and blends 116
7.2.2 Chemical concentrations 117
7.2.3 Cleaning cycle times 118
7.2.4 Control instrumentation 118
7.2.5 Effect of temperature 118
7.2.6 Chemical recovery 119
7.2.7 Operator competency and safety 120
7.2.8 Equipment operation and maintenance 120
7.3 Chemical
alternatives
1217.3.1 Biodegradable chemicals 121
7.3.2 Enzyme-based detergents 122
7.3.3 Reduced phosphate, nitric and sodium blends 123
7.4
Chemical treatment of boilers, cooling water and condensate water
1247.4.2 Cooling water treatment 124
7.4.3 Condensate water treatment 124
7.5
Alternatives to chemical use
1257.5.1 Ozone 125
7.5.2 Ultraviolet light 125
7.6
Supply and handling of chemicals
1267.6.1 Supply agreements and performance-based contracts 126
7.6.2 Bulk supply of chemicals 126
Tables
1
Introduction
Table 1.1 Major Australian dairy manufacturing sites 2
Table 1.2 Typical key performance indicators for a dairy processor 9
3
Water and wastewater
Table 3.1 Water to milk intake ratios (L/L) 20
Table 3.2 Water supply costs in dairy processing regions 21
Table 3.3 Example of the true cost of ambient and hot water ($/kL) 22
Table 3.4 Cost of water loss from leaking equipment 25
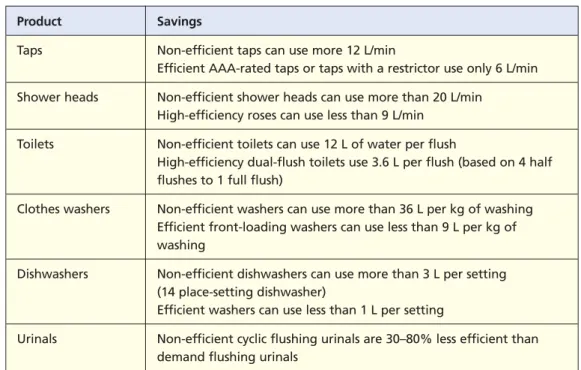
Table 3.5 Water appliance ratings 33
Table 3.6 Comparison of water efficient products with non-rated products 33
Table 3.7 Suitability of saline wastewater for irrigation 42
4
Energy
Table 4.1 Proportions of electricity and thermal energy use 43
Table 4.2 Total energy use — electrical and thermal 44
Table 4.3 Typical costs for primary energy sources 45
Table 4.4 Typical fuel costs for steam production 45
Table 4.5 Typical fuel costs for direct heating of water with electricity or gas from 20°C
to 84°C 46
Table 4.6 Energy consumption of multi-effect evaporators and vapour recompression 48
Table 4.7 Optimum flue gas composition 51
Table 4.8 Fuel savings from installing online oxygen trim control 52
Table 4.9 Heat loss from steam lines 56
Table 4.10 Cost of compressed-air leaks 62
Table 4.11 Cost and energy savings that can be made by reducing air pressure 63 Table 4.12 Energy and costs savings from reducing the temperature of
compressor inlet air 64
Table 4.13 Payback periods for purchasing high-efficiency motors 65
Table 4.14 Cost comparisons for oversized motors 65
Table 4.15 Savings due to installation of variable speed drives 66
Table 4.16 Comparison of different types of lighting 68
Table 4.17 Sample methane and energy yields from biogas digestion for an ice-cream
5
Yield optimisation and product recovery
Table 5.1 Sources of product loss in dairy processing plants 79
Table 5.2 Indicative wastewater characteristics from dairy processing plants 80
Table 5.3 Effluent to milk ratio (L/L) 81
Table 5.4 Trade waste charges in various regions 82
Table 5.5 Comparison of trade waste charges for Plant A 82
Table 5.6 Membranes used in the dairy industry 94
6
Solid waste reduction and value adding
Table 6.1 Sources of solid waste in dairy processing plants 97
7 Chemical
use
Table 7.1 Characteristics of typical soiling found in the dairy industry 111
Table 7.2 Types of chemicals used in the dairy industry 113
Figures
Figure 1.1 Milk production by state 2002–03 2
Figure 1.2 Utilisation of manufacturing milk 2002–03 2
Figure 1.3 Waste minimisation hierarchy 5
Figure 1.4 Method of undertaking an eco-efficiency assessment 8
Figure 3.1 Breakdown of water use of a market milk processor 20
Figure 4.1 Energy cost breakdown by area — milk plant 44
Figure 4.2 Energy cost breakdown by area — powder, cheese and whey plant 44
Figure 4.3 Single effect falling film evaporator schematic 48
1
Introduction
This manual has been developed to help the Australian dairy processing industry increase its competitiveness through increased awareness and uptake of eco-efficiency. The manual seeks to consolidate and build on existing knowledge, accumulated through projects and initiatives that the industry has previously undertaken to improve its use of raw materials and resources and reduce the generation of wastes. Where there is an existing comprehensive report or publication, the manual refers to this for further information.
Eco-efficiency is about improving environmental performance to become more efficient and profitable. It is about producing more with less. It involves applying strategies that will not only ensure efficient use of resources and reduction in waste, but will also reduce costs.
This chapter outlines the environmental challenges faced by Australian dairy processors. The manual explores opportunities for reducing environmental impacts in relation to water, energy, product yield, solid and liquid waste reduction and chemical use.
1.1
Profile of the Australian dairy processing industry
The Australian dairy processing industry makes a significant contribution to the national economy. In terms of value, processed dairy products are the third-largest exported good in Australia after grains and meat, contributing 12% or $3.27 billion to Australia’s exports (DAFF 2003). In 2002–03 the industry had a farmgate value of $2.8 billion with an ex-factory turnover estimated at more than $8.5 billion and a value-added component of $1.6 billion. The entire dairy industry employs almost 200 000 people with 19 000 of these employed in dairy manufacturing (DAFF 2003 and Dairy Australia 2003).
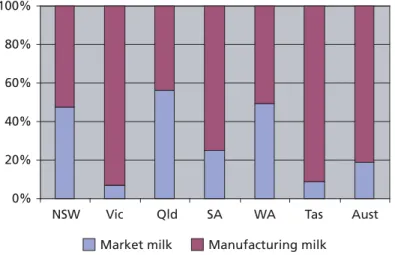
Milk production is concentrated in the south-east corner of Australia, with Victoria, Tasmania and South Australia accounting for 77% of total output, producing
approximately 10 300 million litres in 2002–03. The dairy industry can be divided into two distinct sectors: the market milk sector, producing milk for drinking and products with a short shelf-life; and the manufacturing sector, yielding products with a long shelf-life suitable for export. The volume of drinking milk produced has remained relatively static over recent years, accounting for nearly 19% of total milk production. The proportion of market milk to manufacturing milk in the total product mix differs significantly between states, as shown in Figure 1.1.
Figure 1.1 Milk production by state 2002–03
Source: Dairy Australia 2003
In Australia milk is processed by farmer-owned cooperatives and by public and private companies. The largest cooperatives — Murray Goulburn Co-operative Ltd, Bonlac Supply Company and the Dairy Farmers Group — account for more than 60% of all milk production and more than 70% of all milk used for manufacturing. Multinational dairy companies operating in Australia include Fonterra, Parmalat, Nestlé, Kraft and Snow Brand. In addition there are public companies such as National Foods Ltd and private companies such as Warnambool Cheese and Butter, and Tatura Milk Industries.
As Table 1.1 shows, there are 70 major dairy manufacturing sites across Australia, 51 of which are in rural areas. The largest cooperative accounts for 30% of Australia’s milk production, while there are smaller cooperatives that produce volumes between 100 and 600 million litres (Dairy Australia 2003). Figure 1.2 shows the utilisation of manufacturing milk by major process lines.
Table 1.1 Major Australian dairy manufacturing sites
Source: Dairy Australia 2003
0% 20% 40% 60% 80% 100%
NSW Vic Qld SA WA Tas Aust
Market milk Manufacturing milk
State No. of sites
Capital city Rural region
NSW 3 9 Vic. 7 24 Qld 3 6 SA 2 4 WA 2 3 Tas. 1 5 NT 1 – Australia 19 51 Cheese 42% Whole milk powder 15% Casein/butter 5% Butter/skim milk powder 23% Other 15%
Figure 1.2 Utilisation of manufacturing milk 2002–03
1.2
Environmental challenges
1.2.1
Compliance and legislation
Environmental legislation that regulates Australian dairy processing plants is
implemented by authorities such as state environmental protection agencies (EPAs) and local councils. Dairy processors are generally required to have licences for emissions to air and surface waters and the disposal to land of some solid and liquid wastes such as sludge and treated wastewater. Disposal of wastewater to the sewerage system is regulated by local councils or local water authorities.
1.2.2
Water supply and pricing
Over the entire life cycle of dairy manufacture, including milk production on farm, transportation and dairy processing, 99% of the total water consumption can be attributed to the farm (Lunde et al. 2003). For the industry as a whole, therefore, efforts to make major gains in reducing the environmental impacts of water
consumption should be focused on the farm. Nevertheless, there are gains to be made by dairy processors in minimising water consumption within factories. Depending on the product mix, dairy processing plants can use substantial volumes of water for equipment cleaning, cooling towers, boilers and other processes. Water supply to dairy processing plants varies according to location, but may be from town water, bores, rivers, dams or irrigation channels. Some factories are required to install large storage reserves to cater for periods of non-supply; for example Bonlac’s Stanhope factory must store its entire winter supply to allow maintenance of water channels by the local water board. As increasing pressure is placed on limited water reserves, government bodies and water authorities are actively seeking to promote greater water efficiency and are encouraging water conservation strategies and incentives. For example,
Brisbane Water recently introduced a scheme for providing water rebates to large users of water that have developed and implemented water management plans (Cameron Jackson 2004, pers. comm.) and Sydney Water is encouraging large users of water to reduce water consumption through involvement in the ‘Every Drop Counts’ business partnership program (Sydney Water 2004).
Water supply costs for Australian processors are vary according to the region, ranging between 20c/kL for a North Queensland processor and $1.28/kL for a processor in South-East Queensland. Water supply costs are discussed further in Chapter 3. Many water authorities are now progressively introducing a user-pays charging system to recover the full cost of supplying water to the consumer, in order to encourage water conservation and to cut costs.
1.2.3
Wastewater discharge costs
Wastewater discharge costs vary according to the region, and according to whether the waste is being discharged to land, surface waters or the sewerage system. Plants discharging treated wastewater to municipal sewerage systems face the highest costs. Most water authorities charge on the basis of the organic loads (BOD/COD) and include
discharging to Sydney Water’s direct ocean outfalls, where the charging structure is based only on the mass load (in kg) of waste components. Some utility operators have introduced additional charges for nitrogen, phosphorus and sodium loads and these charges are increasing. For example, Ipswich Water in Queensland currently charges 80c/kg for nitrogen and $3/kg for phosphorus. These charges are expected to increase to more than $2/kg and $9/kg over the next few years (Mark Sherson 2004, pers. comm.). Many utility operators also charge for oil and grease content and suspended solids. The charge structure is affected by the processes used by the treatment plants, and by the costs incurred in handling different components of the wastewater. Charging structures can also be used to ‘send a message’ to customers and encourage measures such as waste minimisation to reduce loads.
Factories that dispose of effluent directly to land generally do not pay disposal charges, but must meet licence conditions for the quality of effluent with respect to
components such as mineral content, salt level, BOD or COD, phosphorus, nitrogen, and oil and grease.
Full cost recovery charging has not so far been applied to sewer discharges, but this situation is changing. Many local authorities and water boards, especially those in metropolitan areas, are in the process of formulating charging systems that will progressively increase wastewater discharge fees on a user-pays basis until something approaching full cost recovery is achieved.
1.2.4
Energy and energy supply costs
As with most Australian industries, dairy companies rely on fossil fuels — particularly coal-generated electricity, coal and natural gas — for their energy supply. National greenhouse abatement initiatives such as the Greenhouse Challenge and the Australian Renewable Energy Certificate scheme have been launched in recent years to increase awareness of environmental issues and encourage the more efficient and sustainable use of energy. As yet, only a small number of dairy companies have joined these schemes. Nevertheless, Australian dairy processors appear to be relatively energy-efficient compared with dairy processing companies internationally. A recent survey of Australian dairy processors has shown that energy consumption per unit of production is comparable to, if not better than, energy consumption in European dairies (see Chapter 4, ‘Energy’). The dairy manufacturing industry has radically improved its energy efficiency over the last 20 years (in some cases by as much as 50%) through industry-wide upgrading of equipment and the closing of smaller, less efficient factories (Lunde et al. 2003). The industry could further explore the use of renewable energy, and an obvious means is through the use of biogas (from anaerobic digesters) to supplement energy supplies. Cogeneration systems have been investigated but to date have been found not to be financially viable.
The national energy supply market (electricity and gas) has been progressively deregulated over the last decade. Deregulation in the electricity industry began in Victoria in 1994 and has spread to most states, giving dairy companies a choice of retail companies for their supply of electricity. The low cost of energy and the lack of
inhibiting the adoption of more energy-efficiency practices (UNEP 2002). Energy is typically the greatest of all utility costs, despite the low unit cost, so significant savings are possible; it therefore makes economic sense for dairy processors to minimise energy consumption. A medium to large dairy processing site could typically spend $2–3 million on energy costs per year, so a possible 10% reduction in energy costs can be a significant incentive to reduce energy use.
1.2.5
Solid waste management
Solid wastes generated by dairy processors include:
• packaging waste such as cardboard, cartons, paper and plastic
• organic waste such as sludge and reject product
• building and maintenance wastes
• office waste.
Dairy processing plants in city areas are generally well serviced by waste disposal and recycling companies, so it is usually more profitable for a company to segregate and recycle wastes than to dispose of waste to landfill. Processing plants in regional areas may experience some difficulties until waste services are developed and expanded. Organic waste is generally disposed of as animal feed, applied to farm land as fertiliser, composted, or digested to produce biogas.
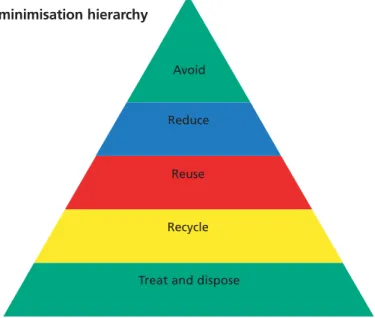
For dairy processors, solid waste disposal costs can be a relatively minor component of total operating costs. It is, however, an area where employees at all levels can contribute and immediately see results, and this can be a good start in encouraging employees to be more environmentally aware and participate in company-wide initiatives. The waste minimisation hierarchy shown below in Figure 1.3 represents a sequential approach to reducing solid waste — with steps to avoid, reduce, reuse, recycle and lastly treat and dispose waste. This is discussed further in Chapter 6, ‘Solid waste reduction and value adding’.
Figure 1.3 The waste minimisation hierarchy
Avoid
Reuse
Recycle
Treat and dispose Reduce
1.2.6
Packaging
Dairy processors face increasing pressure to develop and use packaging that reduces the consumption of resources, enables reuse or recycling, and minimises landfill disposal. The importance placed on packaging may reflect the strong increase in awareness resulting from the National Packaging Covenant (NPC), launched in 1999. The NPC encourages voluntary actions by signatory companies to reduce packaging waste, and is underpinned by regulation in all states to include non-signatories. In some cases packaging initiatives are driven by the requirements of export customers. Most dairy processing companies are signatories to the NPC.
Eco-efficiency opportunities for reducing packaging waste are included in Chapter 6.
1.3
What is eco-efficiency?
Eco-efficiency is a ‘win–win’ business strategy that helps companies save money and reduce their environmental impact. Eco-efficiency means increasing process efficiencies and reducing environmental impact, for example by reducing the use of goods and services, enhancing recyclability, and maximising the use of renewable resources. The World Business Council for Sustainable Development has identified a range of ways companies can improve their eco-efficiency (WBCSD 2000). Companies can:
• reduce material intensity of goods and services
• reduce energy intensity of goods and services
• reduce toxic emissions
• enhance material recyclability
• maximise use of renewable resources
• extend product durability
• increase efficiency in the use of goods and services.
Eco-efficiency is often pursued through approaches and ‘tools’ such as cleaner production, environmental management systems, life-cycle assessment and design for the environment. These tools help companies identify opportunities to improve resource efficiency and reduce environmental impacts.
Eco-efficiency involves systematically evaluating existing practices to identify
opportunities for improvement. The ultimate goal is to avoid the use of a resource or eliminate the production of a waste altogether. Failing this, smarter solutions to existing practices are investigated, which aim to reduce, reuse, recover or recycle
resources and waste. Eco-efficiency opportunities can usually be categorised into five main groups: housekeeping improvements, product modification, input substitution, process improvements, and onsite recycling.
1.3.1
Reasons for adopting eco-efficiency
There are many reasons for dairy processors to adopt eco-efficiency, including:
• to reduce operating costs and improve profitability
• to reduce energy, water supply and solid waste costs
• to overcome water allocation restrictions
• to reduce wastewater treatment and/or disposal costs
• to reduce the effect of rising wastewater discharge fees in the future
• to comply with tightening air emission standards
• to help in developing waste minimisation plans (e.g. water and waste management plans, National Packaging Covenant or Greenhouse Challenge plans)
• to create an ‘environmentally friendly’ image and gain competitive edge
• to improve relations with environmental regulators and ensure compliance with regulations
• to add value in the adoption of an environmental management system.
The best starting point for any company that wants to improve its eco-efficiency is to conduct an eco-efficiency assessment. This process is described in the next section.
1.3.2
How to carry out an eco-efficiency assessment
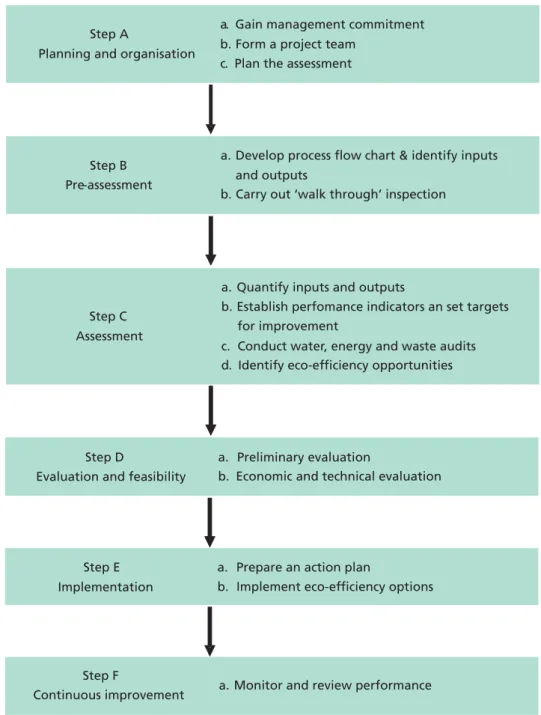
A method for carrying out an eco-efficiency assessment is shown schematically in Figure 1.4. This method has been adapted from the UNEP Environmental management tools — cleaner production (UNEPTIE 2003) and outlines six main steps: planning and organisation, pre-assessment, assessment, evaluation and feasibilty, implementation and continuous improvement.
An eco-efficiency self-assessment guide can be found as part of the Eco-efficiency toolkit for the Queensland food processing industry (UNEP 2004). There are also dairy-specific publications that describe waste minimisation programs — in particular, Environmental management tools for the dairy processing industry, Parts 1 and 2 (Jones et al, 2002).
Figure 1.4 Method of undertaking an eco-efficiency assessment
Source: Adapted from UNEP, Environmental Management Tools — Cleaner Production Assessment, 2003
1.4
Eco-efficiency and environmental management
An environmental management system (EMS) is a documented set of procedures that identifies the impacts of a company on the environment and defines how they are managed on a daily basis. It is an ongoing process that demonstrates the company’s commitment to ensuring a good standard of environmental management. A company may choose to obtain third-party certification of its EMS to the ISO14001 standard. To date, few Australian dairy processors have an ISO14001-certified EMS; but there are some larger processors, particularly those that compete with export markets, that have gained certification. Some processors have an effective corporate EMS that is not certified.
Step A
Planning and organisation
a. Gain management commitment b. Form a project team
c. Plan the assessment
Step B Pre-assessment
a.
and outputs
b. Carry out ‘walk through’ inspection
Develop process flow chart & identify inputs
Step C Assessment
a. Quantify inputs and outputs
b. Establish perfomance indicators an set targets for improvement
c. Conduct water, energy and waste audits d. Identify eco-efficiency opportunities
Step D
Evaluation and feasibility
a. Preliminary evaluation
b. Economic and technical evaluation
Step E Implementation
a. Prepare an action plan
b. Implement eco-efficiency options
Step F
Like eco-efficiency, environmental management is a process of continual improvement with documented management and action plans. An eco-efficiency assessment
identifies those areas of greatest impact and seeks to suggest financially attractive options to control or reduce these impacts. An eco-efficiency assessment should not be undertaken separately from an EMS; instead it should complement it, with the outcomes of the assessment being incorporated into EMS action or audit plans.
1.5
Food safety and HACCP
‘Hazard analysis critical control point’ (HACCP) is commonly used throughout the dairy processing industry to identify and manage those steps in a processing operation that may pose a risk to food safety and quality. Proactive preventive procedures and controls are established to prevent or manage these risks.
It is essential that any eco-efficiency opportunities that are identified for a dairy company do not adversely affect food safety and quality. Water recycling is an example of an eco-efficiency opportunity where increased risk (or perceived risk) can be a barrier to its adoption. New procedures set in place as a result of an eco-efficiency assessment may need to be included and managed by the HACCP system. Conversely, a HACCP program may identify issues and link in with an eco-efficiency assessment.
1.6 Key
performance
indicators
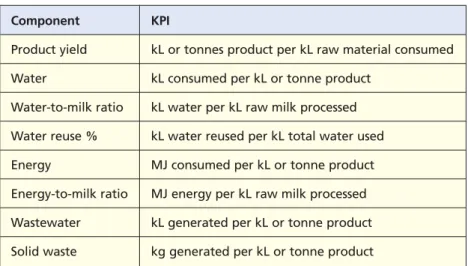
Typical eco-efficiency key performance indicators (KPIs) for dairy processors are shown in Table 1.2. The development of benchmarks is an effective way to encourage continuous improvement within or between companies. By comparing one plant’s KPIs with those of similar processing plants, it will be possible to identify areas where there is scope for improvement. KPIs for water and energy consumption are outlined in later chapters.
KPIs can be linked to staff incentive schemes and to other management programs. They are a useful, easily understood, spin-off from an eco-efficiency program and can help in prioritising overall efficiency.
Table 1.2 Typical key performance indicators for a dairy processor
Component KPI
Product yield kL or tonnes product per kL raw material consumed Water kL consumed per kL or tonne product
Water-to-milk ratio kL water per kL raw milk processed Water reuse % kL water reused per kL total water used Energy MJ consumed per kL or tonne product Energy-to-milk ratio MJ energy per kL raw milk processed Wastewater kL generated per kL or tonne product Solid waste kg generated per kL or tonne product
1.7
Achieving best practice in dairy processing
Subsequent chapters describe numerous eco-efficiency opportunities that are available to the dairy processing industry. Many of the opportunities described are not new, and could be considered as good operating or engineering practice; and they have been undertaken to some degree by most leading dairy processing companies. Where possible, benchmark figures have been provided for aspects such as water and energy consumption and wastewater volumes and quality. While the question of ‘best practice in dairy processing’ cannot be directly quantified within the scope of this document, the following points attempt to describe the characteristics of a dairy processing company and operation that is headed towards best practice. Ideally, the adoption of best-practice technologies, procedures and initiatives should be considered during the design and planning stages of a plant. A holistic approach should also be taken in deciding what is the most appropriate technology or plant design. For example, if a factory in a regional area has the option to irrigate, it may not be sensible for it to treat wastewater to potable water standards.
1.7.1
Characteristics of a company that is aiming for best practice
General:
• a multi-use clean-in-place (CIP) system with the use of membranes to recover product, chemicals and water
• integrated process control software that enables trending of key variables and generates customised reports for different purposes; able to be accessed by management from office workstations; and uses programs that interface with accounting, inventory, maintenance and quality systems
• membrane plants for the recovery of condensate, cleaning chemicals and, in some circumstances, whey proteins.
Product yield:
• inline monitoring of key contaminant levels — COD, EC, pH, turbidity, protein, fat
• effectively designed pigging systems for key product lines
• CIP-able bag houses for spray dryers.
Water usage:
• a detailed water balance or model that identifies the volume of water used in each area
• water meters installed at strategic locations through the plant, and a system for regularly monitoring and reporting water consumption
• segregation of wastewater streams, with appropriate-quality streams reused rather than all streams being sent to the waste treatment process or to effluent; diversion of wastewater streams to different stages of the treatment process as required, using online monitoring of chemical oxygen demand (COD) or other parameter
• in powder plants, a condensate recovery system for ‘cow water’ that reuses 90–100% of available condensate
• a knowledge of the typical quantity and quality of wastewater streams at all times during processing using online and traditional monitoring techniques
• recirculation or reuse of pump sealing water
• zero discharge of wastewater to sewer for dairy processors in regional areas that have the opportunity to use water for irrigation.
Energy usage:
• a detailed energy balance or model that identifies what quantity of energy is used in each area
• a system for the regular monitoring and reporting of energy consumption
• in powder plants, mechanical vapour recompression evaporators and multi-stage dryers
• high-efficiency boilers with recuperators and economisers for recovery of heat to pre-heat flue gas and boiler feed water
• biogas recovery, with biogas used to supplement energy consumption
• cogeneration plants that export excess electricity to the grid
• efficient demand-management systems, including load shedding, to reduce peak demand
• efficient refrigeration systems that utilise state-of-the-art control systems, variable speed drive (VSD) compressors, heat recovery and ice bank storage where applicable
• high-efficiency motors of at least 90% efficiency
• efficient lighting systems that take advantage of natural light and automatically switch off or dim according to lighting needs
• pinch analysis of dairy factories to identify possible areas for improvement in heating and cooling duties.
Chemicals:
• the use of enzyme-based and chemicals with reduced rates of phosphate and nitrogen
• the holistic use of chemicals with consideration of the impact of wastewater disposal, particularly in regard to irrigation and salinity issues
Future technologies:
• the use of alternative renewable fuels such as solar and wind energy
• the possible use of ozone for the treatment of wastewater streams
• active noise control of spray dryers to control noise pollution.
1.8 Summary
In past years, the dairy processing industry has undertaken various resource management and waste minimisation programs to increase operating efficiencies. These programs have been undertaken on a corporate basis or for individual sites driven by a few motivated managers. Many of the 70 dairy processing plants across Australia are well over 50 years old, with processing operations that have grown in size, with a combination of old and new equipment and technologies, and with workforces of various levels of experience. For these plants, there are numerous eco-efficiency opportunities that can be taken up. These range from simply improving housekeeping through to investing capital to upgrade or replace existing equipment. The chapters that follow describe some of the challenges and opportunities that are available to the industry.
2
Making eco-efficiency happen
in your organisation
‘Doing more with less’ (i.e. eco-efficiency) makes good business sense. No employee or manager would ever successfully argue that they should be doing ‘less with more’ (i.e. less output from more resources), or that they should be actively working to create more waste! Waste costs money, is detrimental to the environment and is generally bad for business.
The dairy industry has achieved substantial improvements in efficiency over recent years. Yet careful examination still reveals elements of waste — wasted money, wasted resources (such as energy and water) and wasted product.
Although eco-efficiency makes good business sense, there are some barriers that limit its uptake. This chapter discusses those barriers and shows how they can be overcome, through a case study that draws on the experience of Murray Goulburn and its involvement in the Commonwealth Government’s Energy Efficiency Best Practice Program — a program that was designed to address internal organisational barriers to change. Although Murray Goulburn’s experience was focused specifically on energy, the approaches that were developed can be used to implement each of the
eco-efficiency areas highlighted in this manual.
2.1
Barriers to eco-efficiency
‘The main barrier to the implementation of most projects identified by others is that of ownership of the problem. Support from senior management is also imperative to ensure success of the project.’ — Ted Isaacs, Murray Goulburn Cooperative, Leongatha
In researching this manual we asked staff what they saw as the key barriers to the implementation of eco-efficiency. Their responses included:
• lack of capital
• lack of time and human resources
• operator awareness and training — particularly when there are many casual staff
• lack of communication
• unsystematic approaches to eco-efficiency initiatives that prevent projects from being implemented, being completed or being reversed at a later time if necessary
• getting senior management and board approval for projects.
There are no simple answers for these and the many other potential barriers that exist within organisations; however, each of them must be overcome if the eco-efficiency
Here are some of the key points to consider:
• Develop management awareness, commitment and support for projects.This is important from the beginning, and throughout projects, to ensure there is time for holding team meetings, performing process trials and implementing solutions.
• Establish a cross-functional working group.This should include a range of staff, including cleaners, operators, engineers and managers.
• Hold regular team meetings, to keep focus and to ensure continued progress.
• Determine baseline information on resource consumption and waste generation. When you achieve savings it is important that you can clearly communicate exactly what those savings are. There must be a clear picture of the situation before the savings were made.
• Ensure that you develop good business casesfor the eco-efficiency projects that you are trying finance. This should include clearly communicating additional benefits such as positive publicity, improved involvement with the local community, safety, and operational benefits. In some instances you might also explore whether there are alternative approaches that have not been considered.
More detailed information on carrying out an eco-efficiency assessment is available in the UNEP Eco-efficiency toolkit for the Queensland food processing industry, which includes a self-assessment guide (UNEP 2004).
2.2
Avenues for supporting the implementation of
eco-efficiency
One of the most effective means of implementing eco-efficiency is through site-based cross-functional teams. This is discussed further in the next section, in the context of the Murray Goulburn experience.
Here are some other ways in which dairy processing companies have supported and implemented eco-efficiency projects:
• The appointment of designated managers and supervisors.Many dairy processors have appointed managers to work specifically on projects within the company that improve product yield and reduce waste (e.g. Murray Goulburn’s Process Improvement Manager or Energy Manager).
• Partnerships with suppliers and customers to improve production efficiencies and reduce the use of resources.Some dairy processing companies have formed partnerships with chemical suppliers to optimise clean-in-place systems and reduce chemical use. Partnerships with packaging suppliers have reduced the environmental impacts of packaging, often driven by the National Packaging Covenant. Similarly, partnerships with customers have improved efficiency and reduced waste by solving supply chain management problems.
• Including eco-efficiency aspects in tender and proposal documents.If it is specified in tender documents that resource consumption must be considered during the design stages of projects, it can go a long way towards improving process yields and reducing environmental impacts. Examples might include the installation of metering devices during commissioning stages, the selection of less resource-intensive equipment, or improved process layout design.
• Environmental management systems.If the company has established an environmental management system (EMS), this can also provide an opportunity to integrate
eco-efficiency into the way things are done in the organisation. An EMS provides a management structure that allows for setting targets, clarifying responsibilities, training, and raising awareness to achieve environmental improvement. A focus within the EMS on continuous improvement will allow it to be used to go beyond mere compliance and achieve many of the environmental improvement opportunities discussed in this manual. An EMS can also provide legitimacy within an organisation for a focus on eco-efficiency — particularly where the organisation also has an environmental policy that commits it to a high level of environmental performance.
• Grants and partnerships with government bodies.There are opportunities to obtain national and state government grants, which can provide encouragement and financial support for improving efficiency through the use of more efficient technology and research.
• Support from industry associations.Organisations such as Dairy Australia, the International Dairy Federation (IDF) and the Dairy Processing Engineering Centre (DPEC) provide valuable resources in the form of publications, training and advice that can be used to support an eco-efficiency program.
Making eco-efficiency happen within your organisation requires support from a range of areas; it is not the sole responsibility of one particular manager or group. It depends on support and encouragement from all levels of your organisation, as well as external stakeholders such as suppliers, customers, industry associations and government.
A good way of getting started is through a site-based team, as described in the next section.
2.3
The Murray Goulburn experience
2.3.1
Building skills, knowledge and support through site-based teams
Site-based teams provide an excellent mechanism for breaking down the manybarriers to cross-functional communication that limit the uptake of eco-efficiency improvements. They also build a sense of ownership and awareness of environmental issues at the site level. This is demonstrated by the work of Murray Goulburn’s energy team at the company’s Rochester site. The Rochester energy team demonstrated that better energy management saves money, reduces waste and helps build links with the local community.
To get a team together, a flyer was put on the Rochester noticeboard, inviting staff involvement. The only requirement was that the team should include a range of staff from different functional areas — operators, maintenance staff, boiler technicians, supervisors and an engineer. The cross-functional make-up of the group was the key to its success. This was demonstrated at the team’s first meeting; when it was exploring potential energy-efficiency projects, the members came up with over 50 different opportunities.
In order to determine which projects they should focus on, the team carried out a number of activities.
• It reviewed existing onsite energy data and monitoring equipment. The members knew they first had to understand how energy was used and wasted, in order to understand the potential for savings.
• It identified the people who could help or hinder them in implementing their projects (key stakeholders). The members invited their branch manager, a senior engineer and the environmental manager to a meeting, in which they asked questions about the kind of support they could expect for their projects. This group of people also provided valuable input to the technical and organisational aspects of the projects.
• It developed a business plan that mapped out the resources required, the likely financial savings and other benefits that would be achieved, and the people and tasks that would ‘make the projects happen’. The business plan was presented to the managing director to get his input, and ultimately his support, for the team’s activities.
The first project the team implemented was achieved through improved
communication between the boiler house and process operators. It did not require any capital outlay but led to annual savings of $180 000 and 1536 tonnes of CO2 (which contributes to global warming). The following different perspectives and the team approach contributed in various ways to identifying and implementing this project:
Key learning
When you can tap into a cross-section of skills and knowledge from different functional areas the possibilities for improvement are much greater. Why? Because everyone gets the opportunity to share their own perspective. This opens up the possibility of identifying and implementing projects that might otherwise be left alone because of the difficulty of working across functional areas. When people identify problems themselves and are given the opportunity to do something about them, they are also more committed to making them happen.
Key learning
In developing the business plan, the team had learnt a lot about their site, its production process, and the opportunities and challenges of implementing change. Their discussions with key managers across the organisation helped develop support from outside the team, and helped them to be very clear about what they needed to do to successfully implement eco-efficiency.
Process operator perspective
Steam is a critical production input. Any time delay in the provision of steam has a direct impact on production. Steam must be available and ready to go at all times.
Boiler operator perspective
Process operators require steam. To ensure that steam is readily available at all times two boilers need to be warmed up and ready to go. Even though it is inefficient to have them idling at 30%, steam must available quickly.
Eco-efficiency perspective
Operating boilers at 30% load is inefficient and expensive, and generates greenhouse gas emissions unnecessarily.
Benefits of a team approach
Because process operators and boiler operators were both part of a team that had a shared goal and commitment to saving energy, it was obvious to both groups that improved communication would allow the boilers to be run more efficiently, while at the same time ensuring that the process operators were not left without steam when they started up a production process. Because they came up with the idea of the project themselves, there was a lot more commitment to implementation and ensuring that the improved communication processes actually worked.
2.3.2
Raising management awareness of the benefits of eco-efficiency
It is critical that both company and site management understand and supporteco-efficiency.
Following the work of the Rochester team, Murray Goulburn held a special meeting for all senior and site managers to explore the risks and opportunities that energy management held for the business overall. The workshop included:
• an update on the scientific and political developments of global warming and climate change, and its likely impact on business
• a presentation from representatives of the Rochester energy team, discussing how they achieved $180 000 of energy savings and were on track to achieve more
• an interactive session to identify strategies and actions that would support a more focused approach to energy management across all Murray Goulburn sites.
After the workshop it was agreed that representatives from each of Murray Goulburn’s seven sites would attend a two-day workshop to discuss and develop action plans for establishing energy management teams on each site.
Soon after, a new position of Energy Manager was created, and filled by a senior engineer, to ensure that there was a strong link between corporate and site-based
2.4
Summary
There are some barriers to the implementation of eco-efficiency. The best approach to overcoming these barriers will depend on the nature and priority of each organisation, its culture, and working approaches adopted at each site. The keys to successful implementation of eco-efficiency include:
• developing management awareness, commitment and support
• establishing a site-based cross-functional working group
• involving and obtaining the support of external stakeholders such as suppliers, customers, industry associations and perhaps government
• reporting back to, and discussing eco-efficiency initiatives at, regular team meetings
• establishing baseline information on resource consumption and waste generation
• ensuring that good business cases are developed for eco-efficiency projects.
Environmental management systems can provide an important framework for eco-efficiency, as they supply a structure for setting targets, clarifying
responsibilities, training, and raising awareness to achieve environmental improvement.
The work done at Murray Goulburn demonstrates one successful approach to implementing energy efficiency. Consider your own unique circumstances. You can use the ideas presented in this chapter to develop your own implementation plan for eco-efficiency.
3 Water
3.1
Overview of water use
This chapter discusses water use in dairy processing plants. Eco-efficiency opportunities are discussed under the broad categories of reducing demand in processing, cleaning, utilities and amenities, followed by opportunities for recycling and reuse, and finally a brief discussion on wastewater treatment.
3.1.1
Water use in dairy factories
The total amount of water used by the dairy industry is approximately 3000 GL/yr, which is equivalent to 13% of Australia’s total freshwater resources (Lunde et al. 2003). Of this, 99% is attributed to on-farm use, indicating that the main opportunities for reducing water consumption in the dairy industry are to be found in improving the efficiency of milk production at the farm. Nevertheless, there are still gains to be made by dairy processors in minimising water consumption within factories. The source and quality of water is an issue for some processors, depending on their location. Generally they use town water, but other sources include river water, irrigation channel water, bore water and reclaimed condensate. Water shortages in both regional and urban areas are leading processors to review the effectiveness of their onsite water use, both of their own accord and in response to pressure from local authorities.
Dairy factories also produce high volumes of moderate to high-strength liquid wastes (i.e. with high BOD and COD levels). Water and wastewater management can incur costs for dairy processors, and these vary according to the location of the processing plant, the source of water and the requirements for effluent treatment. The location and type of processing plant and the options for effluent discharge play major roles in determining the level of water reuse and recycling, as well as the degree and method of effluent treatment. Factories in regional areas often have the option of using effluent water for irrigation and may therefore not realise the major financial or environmental benefit to be gained from treating and reusing effluent within the factory. Generally, dairy processors who can reduce water use over the broader system (including upstream and downstream of processing plants), without compromising quality or hygiene standards, will benefit from reduced water supply and effluent charges as well as improving the sustainability of the dairy processing industry. HACCP plans play an important role in ensuring that hygiene standards, which are critical to producing a quality product, are met.
Water is used in dairy factories for processing and cleaning, for the operation of utilities such as cooling water and steam production, and for ancillary purposes such as amenities and gardens. Figure 3.1 shows an example of water use in a dairy processing factory that produces market milk.
Figure 3.1 Breakdown of water use of a market milk processor
Many dairy processors track the overall consumption of water by monitoring the ratio of water to raw milk intake. Water consumption in Europe has been reported to range from 0.2 to 11 L/L milk (Daufin et al. 2001) with effluent volumes per raw milk intake in the same range. Ratios for Australian processors producing any combination of white milk, cheese, powders or yoghurts range from 0.07 to 2.90 L/L milk, with the average being around 1.5 L/L milk (UNEP 2004).
Table 3.1 shows the range of ratios for factories producing white or flavoured milks, cheese and whey products, and powdered products. For factories that produce powdered products, there is the potential for the majority of water (>95%) to be supplied from treated condensate, also known as ‘cow water’. However, the potential for recovering condensate depends on the scale of a particular powder plant and the ratio of supply to demand on a given day. For example, if the production rate is reduced during the off-peak season there will consequently be less condensate available for recovery. The range in water to milk intake ratios indicates there is potential for some dairy processing plants to decrease water consumption significantly.
Table 3.1 Water to milk intake ratios (L/L)
aExcludes UHT milk.
3.1.2
The true cost of water
Water is often viewed as a cheap resource — which is not surprising, considering that Australians pay more for 1 L of milk than for 1000 L of water. Increasingly, however, there is a shift away from this attitude, with an increase in community awareness of the value of water and a trend for local councils and water authorities to move
Min. Max. Average No. of plants providing data
White and flavoured onlya 1.05 2.21 1.44 7
Cheese and whey products 0.64 2.90 1.64 3
Powdered products 0.07 2.70 1.52 10 CIP 28% Pasteurisation 25% Crate wash 16% Operational processes 12% Trade waste 4% Manual washing 6% Cooling towers 6% Other 3%
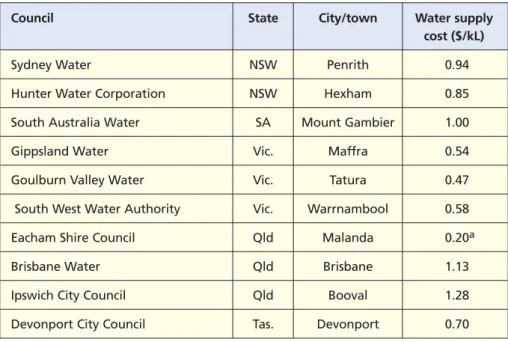
towards full cost recovery for the supply of fresh water and treatment of wastewater. Table 3.2 shows the cost of town water supply for a number of regions where there are dairy processing plants. These costs range from 50c/kL for water supplied from the Goulburn Murray Water Board to $1.28/kL for Ipswich City Council. The relatively low cost of water supply in some regions can be a barrier to implementing water
conservation projects when payback periods are considered.
Table 3.2 Water supply costs in dairy processing regions
aWater supply from river, not town water
The components making up the total true cost of water for dairy processors are:
• purchase price
• treatment of incoming water
• heating or cooling costs
• treatment of wastewater
• treatment of evaporator condensate for reuse
• disposal of wastewater
• pumping costs
• maintenance costs (e.g. pumps and replacement of corroded pipework and equipment)
• capital depreciation costs.
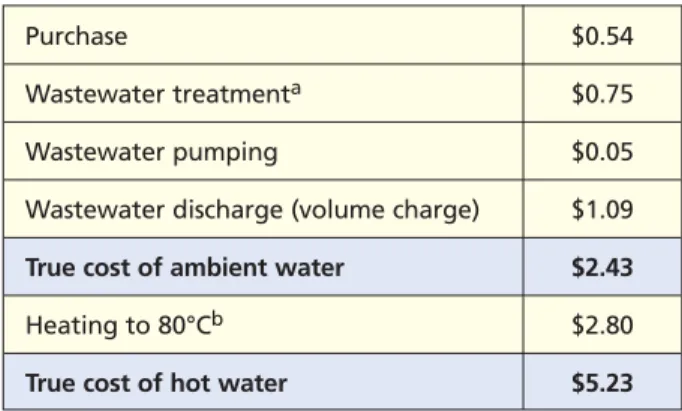
Table 3.3 provides an example of the full cost of ambient and hot water. It indicates that, while the purchase cost of the water was $0.54/kL, the true cost was actually $2.33/kL for water at ambient temperature and $5.13/kL for hot water. The cost of wastewater discharge in different regions is discussed more fully in Chapter 5, ‘Yield optimisation and product recovery’.
Council State City/town Water supply
cost ($/kL)
Sydney Water NSW Penrith 0.94
Hunter Water Corporation NSW Hexham 0.85 South Australia Water SA Mount Gambier 1.00
Gippsland Water Vic. Maffra 0.54
Goulburn Valley Water Vic. Tatura 0.47 South West Water Authority Vic. Warrnambool 0.58 Eacham Shire Council Qld Malanda 0.20a
Brisbane Water Qld Brisbane 1.13
Ipswich City Council Qld Booval 1.28 Devonport City Council Tas. Devonport 0.70
Table 3.3 Example of the true cost of ambient and hot water ($/kL)
aBased on assumption of treatment costs for an anaerobic digester bCost for heating to 80°C using steam produced by a gas boiler
3.1.3
Measuring water consumption
To understand how to manage water effectively it is essential to understand how much water enters and leaves the factory and where it is being used. Understanding water flows will help to highlight where the greatest opportunities for cost savings are. This can be achieved by developing a detailed water model for the site using dedicated software or a simple spreadsheet. The water model should balance the total water entering the factory over a period with the volume of water used in processing and finally disposed as effluent.
There are a number of methods that can help to quantify water use and develop a water model:
• Install flow meters in strategic areas to directly measure water use.
• Use a bucket and stopwatch to estimate flow from pipes or hoses.
• Use manufacturers’ data to estimate water use for some equipment and compare with actual water use.
• Use known operational data to estimate water use (e.g. a 10 kL tank fills every wash cycle).
When identifying areas of water use, manual operations as well as equipment should be monitored carefully (e.g. the volume of water used for washing down floors and equipment must be taken into account). It is also a good opportunity to observe staff behaviour (e.g. taps left running or hoses left unattended).
Flow meters
Flow meters on equipment with high water consumption, incoming water inlets and wastewater discharge outlets will allow regular recording and monitoring of water use. Flow meters are also useful for measuring ‘standing still’ water consumption during periods when equipment is not operating, to detect any leaks. When installing a meter ensure that the meter is tailored to meet the application (e.g. measurement of product wastewater or clean-in-place volumes).The cost of installing or hiring flow meters will vary according to the meter size and functionality. Factors to consider include pipe size,
Purchase $0.54 Wastewater treatmenta $0.75
Wastewater pumping $0.05 Wastewater discharge (volume charge) $1.09 True cost of ambient water $2.43
Heating to 80°Cb $2.80
flow rate (L/min), fluid quality (e.g. incoming potable water, wastewater, process water), type of power supply (mains, battery or solar), accuracy required and piping installation costs. It is also particularly important to consider ongoing maintenance and recalibration costs. Often a higher capital cost with lower maintenance costs can result in lower life-cycle costs.
3.1.4
Increasing staff awareness and involvement
The involvement and support of staff is essential in reducing water use. Ideas for involving staff and encouraging water conservation include:
• forming a water management team
• using posters and stickers to promote awareness of water efficiency
• implementing staff suggestion schemes to encourage ideas for reducing water use
• promoting progress by displaying graphs and performance measures
• regularly discussing water efficiency at staff meetings
• considering a staff incentive scheme and including targets in staff job goals.
Involvement of staff, the establishment of clear goals and targets, and prompt implementation of initiatives can help develop a strong water conservation culture.
‘It is important to set targets and allow operators active involvement in developing improvements.’ — Adam Carty, Murray Goulburn Cooperative, Kiewa, Victoria, commenting on minimising site water use.
‘One of the main issues is operator awareness and training. With such a large number of casual and seasonal staff, training and awareness has to be maintained so that eco-efficient projects are continually generated from the
‘Every Drop Counts’
Improved water management: Dairy Farmers, Lidcombe
Dairy Farmers in Lidcombe joined the Sydney Water ‘Every Drop Counts’ water minimisation business partnership. The company installed 27 water meters across the site and worked on developing an accurate understanding of water flow to each area. A water assessment was undertaken over a number of months, identifying savings by preventing cooling tower overflow; recirculating homogeniser water, crate wash water and DAF water; reducing water for cleaning; repairing leaks; and reviewing truck washing practices. The assessment identified total savings in water costs of $300 000/yr with an initial cost of $150 000 and ongoing costs of $26 000/yr. Improved water management: National Foods, Penrith
National Foods Ltd in Penrith also joined the Every Drop Counts partnership. Additional water meters were installed and these were fitted with pulse unit and data loggers, allowing the daily water usage to be recorded and downloaded to a central system. Water usage for the site was mapped and potential improvements identified, including redesign of the crate wash system, improved maintenance and monitoring, more efficient pasteuriser and bottle washing, collection of rainwater, and reductions in water use for pump seals. Water use for the site was reduced by 22% as a result of the program, reducing water use by 110 kL/day and saving $104 000/yr, with implementation costs of $86 000.
3.2
Reducing demand for water: processing
3.2.1
Optimising rate of water flow
Sometimes equipment operates at water pressures or flow rates that are variable and set higher than necessary (e.g. pump sealing water, homogeniser cooling water, belt filter sprays or carton machine cooling water). By conducting trials to determine the optimum flow for the equipment or comparing the flow rate with manufacturers’ specifications, consumption could be reduced. To maintain a constant and optimum flow rate, consider installing a flow regulator.
3.2.2
Efficient process control
Installing automatic monitoring and control devices in key sites can lower production costs. A wide variety of devices are used in dairy factories to detect operating
parameters such as level, flow, temperature, pH, conductivity and turbidity. These are particularly important for detecting the quality of processing and waste streams to enable the maximum recovery of product, chemical and water. Refer to the DRDC publication Milk processing effluent stream characterisation and utilisation(DRDC 1999) for information on instrumentation and methods for monitoring and controlling waste streams.
Water sprays are often used in dairy factories for washing, or to lubricate equipment. Water is wasted if sprays are left operating unnecessarily during breaks in production; this can be prevented by linking sprays to conveyor or equipment motors, using automatic cut-off valves. Timers may also be useful for shutting off sprays or taps when not in use.
Increasing staff awareness: Murray Goulburn
Murray Goulburn Cooperative sites introduced environmental awareness training into their staff inductions. The inductions have a ‘two-tiered’ approach where staff have a training session which is followed up a few months later to reinforce the earlier message. This has ensured that all staff are aware of the initiatives to minimise water use and are encouraged to generate projects.
Measurement of resources: Peters and Brownes, Balcatta
Peters and Brownes in Balcatta have built a site database of utility usage/production data, which provides ‘year to date’ usage of electricity, gas and water consumption. Water, electricity and gas usage is metered within strategic locations of the factory allowing resource use to be analysed by area, and the information is available to managers online.
Optimising homogeniser cooling water: Dairy Farmers, Mount Gambier
Dairy Farmers in Mount Gambier reduced water costs by $10 800/yr, by reducing the flow of cooling water to the homogeniser to the optimum rate. The cost was only $250 for the installation of a flow regulation valve.
3.2.3
Leaks
Leaking equipment such as pumps, valves and hoses should be promptly repaired, not only to save water, but also to set a good example to staff on the importance of water conservation and good housekeeping. Equipment that is left leaking over lengthy periods can waste significant amounts of water or product. Table 3.4 gives some examples of the cost of water loss from leaking equipment. For equipment items that use large volumes of water, the cost of installing and regularly monitoring meters to detect leaks can be well justified. If possible, it is a good idea to take supply water meter readings during non-production hours to highlight any unusual water consumption or even leaking pipes. A system for reporting and promptly repairing leaks should also be established.
Table 3.4 Cost of water loss from leaking equipment
Assumptions: purchase cost of water = $0.54/kL; total cost of water = $2.43/kL (see section 3.1.2) Table derived from hourly and annual water loss figures in Envirowise 2003.
Taking supply water meter readings during non-production hours can highlight any unusual water consumption or leaking pipes.
Equipment Hourly loss Annual loss Water cost
(L) (kL) ($/yr)
Union/flange 0.5 5 12
(1 drop/s)
Valve 6 53 128
(0.1 L/min)
Pump shaft seal 0-240 0–2100 0-5103
(0–4 L/min)
Ball valve 420–840 3680–7360 8 942–17 885
(7–14 L/min)
1-inch hose 1800–4000 15 770–34 690 38 321–84 297 (30–66 L/min)