V
I S U A L I Z A T I O NC
O R N E REditors: Cláudio T. Silva, [email protected] Joel E. Tohline, [email protected]
A
N
E
XPERIMENTAL
D
ISTRIBUTED
V
ISUALIZATION
S
YSTEM
FOR
P
ETASCALE
C
OMPUTING
By Jinghua Ge, Andrei Hutanu, Cornelius Toole, Robert Kooima, Imtiaz Hossain, and Gabrielle Allen
I
nteractive, photorealistic visu-alization is an important tool in scientific research because it lets scientists make visual discoveries in real-time. Modern computational sci-ence is increasingly producing large-scale data sets using high-performance computing (HPC) resources that are remote from the user, making interac-tive visualization and analysis of such data a challenging task.One option to visualize this data is to replicate it on local resources for lo-cal interactive analysis. However, lolo-cal data replication is cumbersome and in many cases the processing power of desktop visualization systems is inadequate. Existing parallel visual-ization systems—such as ParaView1
and VisIt2—were designed to support
large dataset visualization. However, existing systems typically impose long wait times during data loading and preprocessing, and require lengthy noninteractive processes for high-quality visualization. When the data is located remotely and is tens of giga-bytes and larger, there’s a pressing need for satisfactory interactivity and performance.
In contrast to existing sys-tems, our approach uses powerful remote resources connected by high-speed networks to directly visual-ize remote data without replication.
We also combine distributed re-sources in a single visualization appli-cation. Our distributed visualization system, eaviv, adopts cutting-edge technologies such as parallel ren-dering on graphics processing unit (GPU) clusters, progressive visual-ization, high-speed network I/O, and scalable video streaming.
Our driving goal in designing the eaviv system is to keep pace with the increasing scale of simulations and data growth. The system supports distributed collaboration, letting mul-tiple users in physically distributed locations interact with the same visu-alization to communicate their ideas and explore the datasets cooperatively. We’ve demonstrated and tested eaviv across the Louisiana Optical Network Initiative (LONI) and TeraGrid. Here, we describe eaviv’s design prin-ciples as well as its hardware and soft-ware components.
Design Principles
Developed by a small group of re-searchers at the Louisiana State University (LSU) Center for Com-putation & Technology (CCT), the eaviv distributed visualization system is a prototype petascale data analy-sis tool that addresses the root prob-lems of next-generation visualization systems.
We designed eaviv to support ex-perimentation, and it’s constantly undergoing optimization. Our work is guided by several key design prin-ciples; in brief, eaviv must be
• lightweight, so system optimization research can be continuously ap-plied to implementation refinement; • user-oriented and developed in col-laboration with specific users within computational science communities; • modular, so it’s easy to configure for
different use scenarios;
• progressive in adopting emerging infrastructure and technology in HPC, networking, GPU comput-ing, and mobile devices;
• scalable, such that its overall scal-ability results from attentiveness to each individual component’s scal-ability; and
• asynchronous, emphasizing interac-tivity by providing a progressive visualization pipeline so that soft-ware components couple asynchro-nously without blocking the pipe-lined data flow.
These design principles represent the key factors that distinguish the eaviv system architecture from other visu-alization software. They are used as guidelines throughout our software development.
The coming era of petascale computing and heterogeneous platforms calls for fundamental changes in perspective on how we design distributed visualization software.
demonstrated eaviv at the 2008 Inter-national Conference for HPC, Net-working, Storage and Analysis (SC08) and won first prize at the IEEE Inter-national Scalable Computing Chal-lenge (SCALE2009). We presented eaviv at SC09 and at the Spring 2010 Internet2 Member Meeting.
For these demonstrations, we used data from scientific user communi-ties including chemical tomography,3
numerical relativity (Cactus; http:// cactuscode.org) and astrophysics (Enzo; http://lca.ucsd.edu/projects/enzo).
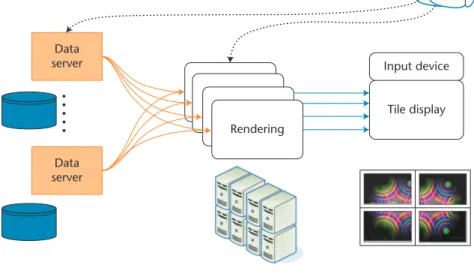
Figure 1 shows the visualization pipeline’s data flow from
• the supercomputer that runs simu-lation and stores the data to
• the data servers that transfer the data to the renderer cluster, which streams images to the displays.
Hardware components
The system’s hardware components— including HPC clusters, high- resolution displays, and interaction devices—are distributed, specialized resources connected by high-speed networks.
Network testbed. Our work addresses fundamental issues in distributed visualization design and implementa-tion, where network services represent a first-class resource. To support this, we built a testbed connecting resources at CCT, LSU, the National Center for Supercomputing Applications (NCSA) at the University of Illinois at Urbana-Champaign (UIUC), and the
Laboratory of Advanced Networking Technologies (SITOLA) at Masaryk University in the Czech Republic. The Internet2 Interoperable On- demand Network (ION) provides wide-area connectivity to support dynamic network circuit services. Ap-plications request and reserve point-to-point circuits between sites as needed using automated control software.
Computation and display. The primary
resources connected by our network testbed include contributions from CCT, LONI, NCSA, TeraGrid, and SITOLA.
• GPU and rendering. Spider, LSU’s distributed computing testbed, con-sists of eight rendering nodes and four I/O nodes. Rendering nodes are connected pair-wise to four Nvidia Tesla S1070 graphics units. The NCSA’s accelerator cluster (http:// iacat.uiuc.edu/resources/cluster) is a 40-node cluster that combines both GPU and field-programmable gate array technology. NCSA’s Lincoln TeraGrid cluster (www.ncsa. illinois.edu/UserInfo/Resources/ Hardware/Intel64TeslaCluster)
has 192 nodes with 96 Nvidia Tesla S1070 graphics units.
• Storage. SITOLA provides a Sun X4540 server with eight AMD Op-teron 2356 cores, 64 GBytes memory, and 48 Tbytes storage. Running Linux with disks configured in RAID-0, it allows up to 1.7 GBytes per second of sustained reading and 1 Gbps of sustained writing in real time. NCSA’s mass storage system (MSS; www.ncsa.illinois.edu/UserInfo/ Data/MSS) is a production system for permanent data storage and con-sists of a high-performance system running NCSA’s UberFS. MSS is a parallel, automatically backed-up storage system accessible via SSH, FTP, and GridFTP.
• Display. LSU has a Sony SXRD 4K projector (4,096 × 2,160 pixels), and SITOLA has two tiled displays, one 6 × 4 with total resolution of 55 Megapixels and six display nodes, and the other 2 × 2 with 9 Megapixels.
Software Components
Our system’s main software compo-nents are the distributed data server and parallel renderer. The eaviv system also supports specialized tangible remote
Figure 1. The eaviv visualization pipeline connects data servers, GPU clusters, and displays. The data servers and rendering GPU clusters are physically distributed resources remote to the local user. They’re connected to the local displays by high-speed networks. Large-scale datasets are thus processed by remote resources and the resulting image streamed to local users.
VI S U A L I Z A T I O N CO R N E R
interaction and uses Scalable Adaptive Graphics Environment (SAGE)5
high-performance parallel image streaming software.
Data server. Data servers can be ei-ther local or remote. We use the local data server for simple scenarios when data is readily accessible and local disk speed is sufficient or when transport performance isn’t critical. We use re-mote data servers in two scenarios: when the data isn’t available locally, or when local I/O performance is insuffi -cient. In this second scenario, network throughput can exceed that of the lo-cal disk system, and we can increase data transfer speed by distributing the data on the network and loading it in the remote machines’ main memory.
High-performance data transmis-sion over wide-area networks is diffi -cult to achieve. One of the main factors affecting data transport performance is the network transport protocol; an unsuitable protocol on a wide-area network can have a poor performance. In some situations, the standard Inter-net TCP protocol might sustain only a few Mbps throughput on a 10 Gbps dedicated network connection. We’ve designed our system to support high-speed transport protocols, including Uniform Data Transfer,4 allowing us
to achieve high network throughput
on long-distance and high-capacity network links.
In addition, eaviv supports paral-lelism: each renderer node can access data from multiple data servers. This increases data throughput, as well as increasing the amount of data that the system can access.
Parallel volume renderer. Our
ex-perimental data sets are large-scale, time-varying 3D volumes. This is a common data model in the compu-tational science community and— because 3D data size grows more quickly than 2D data as a problem’s scale increases—the format provides an interesting challenge for our system.
We implemented the ray-casting par-allel volume renderer called Pcaster as the rendering component to demonstrate the distributed pipeline’s workflow. Compared to parallel volume render-ers in existing software—such as Avizo (www.vsg3d.com), EnSight (www. ensight.com),VisIt or ParaView—Pcaster is a purely GPU-based volume renderer and image compositor supporting high-resolution rendering. Pcaster asynchronously couples with parallel data servers for network-streamed data input. We’ve tested Pcaster with data sets up to 64 Gbytes per timestep and achieved interactive frame rates (5 to 10 frames per second) using 32 Nvidia
Tesla S1070 GPUs on NCSA’s Lincoln cluster to produce render images of 1,024 × 1,024 resolution.
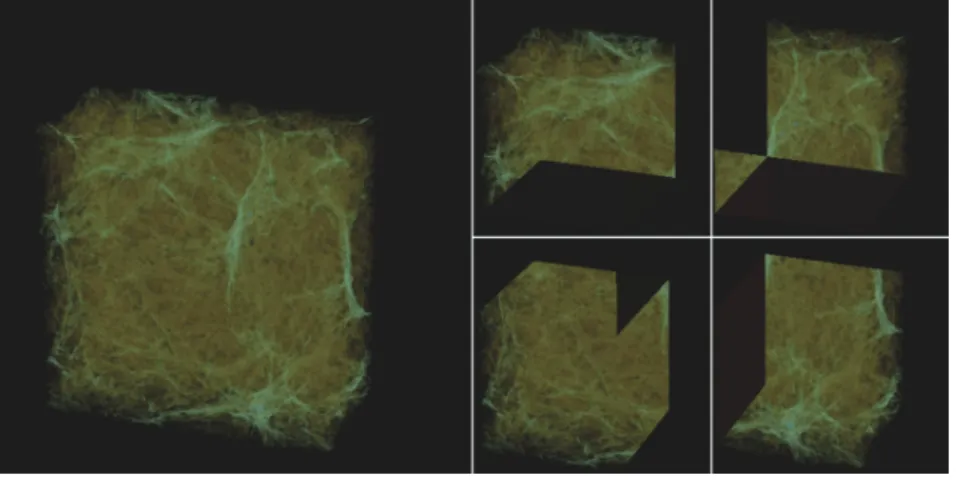
Figure 2 shows an image with con-tributions from four renderers. Each node renders one quarter of the vol-ume data set and contributes a 256 ×
256 local composited image. The global assembled view has a resolution of 512 × 512. Using this method, Pcaster can produce high-resolution image scalable with the parallel rendering. For example, when we split a 40,963-voxel
volume into 10,243 voxel subvolumes
and render it using 64 rendering nodes, each renderer produces a 1,024 × 1,024 image, and the final composition has a resolution of 4,096 × 4,096.
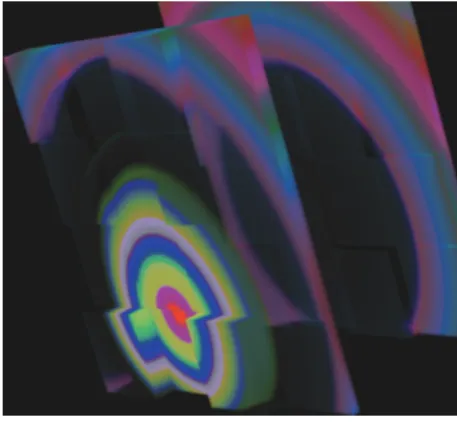
For multi-Gbyte datasets, data load-ing can take a long time. Rather than blocking on I/O, with the renderer waiting for data to load, Pcaster uses a pool-and-show mechanism. That is, rendering proceeds at interactive rates while data is continuously streamed into the renderer’s data pool. This produces a progressive visualization output for the user. Figure 3 shows an example of an intermediate render-ing that demonstrates the progressive data pooling: 32 nodes are rendering the partial data in the pool.
Pcaster’s progressive rendering mechanism not only gives users more prompt interaction with the data, but also provides visual performance met-rics, including data preparation time and network transfer speed. Users can easily see any system bottlenecks and adapt their strategy as needed. Image streaming and remote tangible
interaction. To support
ultra-high-resolution distributed visualization, eaviv integrates the SAGE image stream-ing software for high-performance parallel image delivery. Developed at the University of Illinois Chicago’s
Figure 2. Four rendering nodes are used to process the data in parallel. Each node renders one quarter of the data into a 256 × 256 local image and contributes partially to the final composited image following an overlap-based compositing schedule. The global assembled view has a resolution of 512 × 512. Using this method, Pcaster can produce high-resolution images scalably. Data Courtesy of Britton Smith, University of Colorado.
collaborative scientific visualization environments. SAGE also supports the standard Internet UDP protocol; although UDP doesn’t provide data transmission reliability, it’s more suit-able than TCP for high-performance video streaming.
To encourage users to embrace the collaboration environment, eaviv pro-vides a tangible interaction mechanism for more natural engagement with the visualization. In the tangible interac-tion approach, physical objects control and represent computational media.6
Figure 4 shows the tagged physical to-kens (in this case, RFID-tagged cards) that we used in eaviv experiments. These tangible user interfaces (TUIs) are bound directly to visualization pa-rameters within Pcaster, thus steering the interaction with the remote ren-dering. These devices provide imme-diate tactile feedback, which is useful for fine-grained control of remote ob-jects during network latency.
Using SAGE and tangible interaction devices enables collaborative visualiza-tion, letting multiple users at different locations simultaneously interact and collaborate via the visualization system.
Use Cases
When run with a local data server and a single renderer, eavivcan be used as a desktop tool for small-scale local data. When run with remote data serv-ers, dedicated networks, and parallel rendering, it can handle large-scale distributed data. The eaviv system’s configurable architecture thus permits
application will be a human anatomy class that will visualize data from the Visible Human Project (www.nlm. nih.gov/research/visible/visible_human. html). The Visible Human Project was established in 1989 to build a digi-tal image library of volumetric data representing complete normal adult male and female anatomy (completed in 1994 and 1995, respectively, and rescanned in 2000 at a higher resolu-tion). The project has generated two datasets of 65 and 40 Gbytes, respec-tively. For certain body sections, com-puted axial tomography scans, or CT scans, and magnetic resonance imag-ing (MRI) data are also available.
Although dataset sections have been in use on individual lab comput-ers, interactive full-scale visualization of complete datasets requires parallel rendering. The study of anatomy is highly visual. Learning where individ-ual regions lie with respect to others and where they fit in the overall struc-ture helps greatly in the learning pro-cess. In the classroom, both instructor and students will have control over separate instances of the visualization application. The instructor will use a large projection wall for teaching, and students will each have a desktop computer where they can zoom in to the dataset for in-depth exploration. LSU’s Spider will run eaviv and send the visualization image to each desk-top computer in the lab classroom.
This classroom use case is guiding our future development of eaviv’s user in-teraction modes. In addition, in the
collaboration mode, in which instruc-tors and students interact with the same visualization, we’ll develop an independent steering mode that will let each student interact with the data individually.
Distributed Execution on Production Resources
To demonstrate eaviv’s full distrib-uted capability, we consider a complex black-hole data visualization scenario
continuous update of intermediate rendering images clearly demonstrates the rate at which data are being transferred through the network and offers a peek inside the dataset. Data Courtesy of Erik Schnetter, Louisiana State University (LSU) Center for Computation & Technology.
Figure 4. Parameter interaction tray. These tangible user interfaces (TUIs) are bound directly to visualization parameters within Pcaster, thus steering the interaction with the remote rendering. Instead of a single user operating with a keyboard and mouse, collaborating users can use multiple tangible devices, providing better interaction and cooperation.
VI S U A L I Z A T I O N CO R N E R
in which people in their individual offices at LSU use the following re-sources to visualize the remote data: • a SITOLA data server, which has
datasets of hundreds of Gbytes or Tbytes; and
• NCSA’s Lincoln, the most power-ful rendering cluster available to our project.
The common practice of production HPC resource usage involves submit-ting a job into a scheduling queue and waiting for it to be executed. The eaviv system requires separate resource al-location of at least three components: the networks, the data servers, and the GPU rendering cluster. The three al-locations must coincide in time for the application to execute. The only solu-tion that can enable this execusolu-tion is advanced resource reservation to allo-cate all resources simultaneously.
In our testbed, the Lincoln GPU clus-ter supports advance reservation; the network circuit can be reserved through the LONI ION website (https:// ldcn1.sys.loni.org:8443/oscars). Ex-perimental resources at SITOLA and CCT aren’t managed by a scheduler.
As this scenario shows, running a sys-tem that enables scientific investigation of large datasets requires collaboration among multiple resource providers.
T
he eaviv system’shigh-performance pipeline architec-ture supports cutting-edge emerg-ing infrastructure and serves as a data analysis prototype for the next- generation of scientific investigation. It’s our hope that our work will benefit the visualization tools developer and the research community, both in us-ing our software components and fol-lowing our software design principles to improve existing tools.
Acknowledgments
The eaviv project is funded by the US
National Science Foundation awards Louisiana RIICyberTools #0701491, Eager network testbed #0947825, and Viz Tangibles #0521559. The initial eaviv research is funded by the Center for Computation & Technology at LSU.
References
1. A. Cedilnik et al., “Remote Large Data Visualization in the ParaView Frame-work,” Proc. Eurographics Parallel Graph-ics and Visualization, 2006, ACM Press, 2006, pp. 163–170.
2. H. Childs et al., “A Contract-Based Sys-tem For Large Data Visualization,” Proc. 16th IEEE Visualization, IEEE CS Press, 2005, pp. 25–33.
3. H. Kyungmin, H.A. Harriett, and L.C. Butler, “Burning Issues in Tomography Analysis,” Computing in Science & Eng., vol. 10, no. 2, 2008, pp. 78–81.
4. G. Yunhong and R.L. Grossman, “UDT: Udp-Based Data Transfer for High-Speed Wide Area Networks,” Computing Networks, vol. 51, no. 7, 2007, pp. 1777–1799.
5. L. Renambot et al., “Enabling High Resolution Collaborative Visualization in Display Rich Virtual Organizations,” Future Generation Computing Systems, vol. 25, no. 2, 2009, pp. 161–168.
6. H. Ishii and B. Ullmer, “Tangible Bits: Towards Seamless Interfaces Between People, Bits and Atoms,” Proc. SIGCHI Conf. Human Factors in Computing Systems, ACM Press, 1997, pp. 234–241.
Jinghua Ge is a visualization consultant at the Center for Computation & Technology, Louisiana State University. Her research in-terests include computer graphics, scientific visualization, parallel rendering with GPU clusters, and distributed visualization pipe-line. Ge has a PhD in computer science from the University of Illinois at Chicago. Contact her at [email protected].
Andrei Hutanu is an IT consultant at the Cen-ter for Computation & Technology, Louisiana State University. His research interests include software system design and engineering, dis-tributed computing, and high-speed network applications with an emphasis on distributed visualization, data management, and col-laborative applications. Hutanu has a PhD in computer science from Louisiana State Uni-versity. Contact him at [email protected].
Cornelius Toole is PhD candidate in the Department of Computer Science at Loui-siana State University. His research interests include human computer interaction, scien-tific visualization, and distributed comput-ing. Toole has an MS in computer science from Jackson State University. Contact him at [email protected].
Robert Kooima is a post-doctoral researcher at the Center for Computation & Technology and an adjunct professor in the Department of Computer Science at Louisiana State Uni-versity. His research interests include real-time 3D computer graphics and parallel rendering for scientific visualization. Kooima has a PhD in computer science from University of Illinois at Chicago. Contact him at [email protected].
Imtiaz Hossain is the manager of the Visualiza-tion Services Center of InformaVisualiza-tion Technology Services at Louisiana State University. His re-search interests include image processing, pat-tern recognition, and data visualization. Hossain has an MS in mathematics from Louisiana State University. He is a member of the ACM, IEEE, and SPIE. Contact him at [email protected].
Gabrielle Allen is an associate professor of computer science at Louisiana State University. Her research interests include computational frameworks, high-performance computing, high-speed networks, and computational astrophysics and coastal modeling. Allen has a PhD in computational astrophysics from Cardiff University. Contact her at gallen@cct. lsu.edu.