Swedish University of Agricultural Sciences Faculty of Veterinary Medicine and Animal Science Department of Animal Nutrition and Management
Degree project / Swedish University of Agricultural Sciences,
Department of Animal Nutrition and Management, 590 Uppsala 2016
Degree project, 30 HEC Master Thesis Animal Science
The effect of different cluster take-off levels at
udder quarter in combination with feeding
during milking on milk production in dairy cows
-
milk yield, milk composition and milking time
The effect of different cluster take-off levels at udder
quarter in combination with feeding during milking
on milk production in dairy cows
- milk yield, milk composition and milking time
Effekten av olika avtagningsnivåer på juverfjärdedelsnivå i
kombination med eller utan utfodring av kraftfoder under
mjölkningen på mjölkproduktionen hos mjölkkor
-
mjölkmängd, mjölksammansättning och mjölkningstid
Christine Hultén
Supervisor: Ass. Supervisor: Examiner: Credits: Course title: Course code: Programme: Level:Sigrid Agenäs, SLU, Department of Animal Nutrition and Management Peter Krawczel, University of Tennessee, Department of Animal Science
Kerstin Svennersten-Sjaunja, SLU, Department of Animal Nutrition and Management 30 HEC
Degree project in Animal Science EX0551
Agricultural Science Programme - Animal Science
Second cycle A2E
Place of publication: Uppsala
Year of publication: 2016
Series name, no: Degree project / Swedish University of Agricultural Sciences, Department of Animal Nutrition and Management, 590
On-line published: Nyckelord:
Keywords:
http://stud.epsilon.slu.se
Avtagningsnivå, Utfodring under mjölkning, Juverfjärdedel, Mjölkningstid, Mjölkmängd, Mjölksammansättning
Take-off level, Feeding during milking, Udder quarter level, Milking time, Milk yield, Milk composition
In this series Degree projects (corresponding 15, 30, 45 or 60 credits) at the Department of Animal Nutrition and Management, Swedish University of Agricultural Sciences, are published. The department's degree projects are published on the SLU website www.slu.se.
Sveriges lantbruksuniversitet
Fakulteten för veterinärmedicin och husdjursvetenskap Institutionen för husdjurens utfodring och vård
Box 7024 750 07 Uppsala Tel. 018/67 10 00
Hemsida:
www.slu.se/institutioner/husdjurens-utfodring-vard/
Swedish University of Agricultural Sciences Faculty of Veterinary Medicine and Animal Science Department of Animal Nutrition and Management PO Box 7024
SE-750 07 Uppsala Phone +46 (0) 18 67 10 00
Table of Contents
Abstract ... 2
Sammanfattning ... 2
Introduction ... 3
Literature review ... 4
Automatic milking systems ... 4
Cow traffic and milking interval ... 4
Feeding ... Fel! Bokmärket är inte definierat. Management ... 6
Udder quarters ... 7
Udder anatomy ... 7
Milk synthesis ... 7
Regulation of milk synthesis ... 8
Milk ejection ... 8
Milk yield and milk composition ... 9
Milking ... 10
Take-off level and milk flow ... 10
Udder health ... 11
Aim and hypothesis ... 12
Material and Methods ... 12
Animals and feeding ... 12
Study design ... 13 Milking ... 15 Milk sampling ... 15 Milk composition ... 15 Fat analysis ... 15 Residual milk... 16 Quarter sampling ... 16 Milk analysis ... 16 Data handling ... 17 Statistical analysis ... 17
Results ... 18 Milk yield ... 18 Milking time ... 18 Milk composition ... 19 Discussion ... 21 Milking efficiency ... 21 Milk yield ... 22 Milking interval ... 23 Milk composition ... 23
Disturbances in the study ... 24
Novel Surrounding ... 24
Conclusion ... 25
Reference ... 26
2
Abstract
It was early stated that high take-off level at whole udder level decreases the milking time. There are, however, few studies dealing with take-off level at udder quarter level. It has also been stated that feeding of concentrate during milking can be used as a teaser to motivate the cows to visit the milking unit (MU) and to improve the milk ejection. Furthermore, has it been observed that milk yield can be negatively affected by high take-off levels but positively reinforced by feeding during milking. The aim of the present study was to evaluate different take off levels at udder quarter level in combination with or without feeding of concentrate during milking. The study was conducted at The Swedish Livestock Research Centre, Lövsta, Uppsala, Sweden, during November and December 2015. Thirty cows of the Swedish Holstein (n=9) and Swedish Red breeds (n=21) were used. Three different cluster take-off levels (100, 300 or 500g/min) on udder quarter level in combination with (f) or without feeding (nf) of concentrate during milking were tested in a six week long study in a 6x6 Latin Square model. It was found that milk yield was not affected by neither treatment, take-off level nor feeding of concentrate during milking, while milk composition was affected by both take-off level and feeding of concentrate during milking. Lactose and protein content was higher when concentrate was provided, while there was a tendency for lower fat content. The milking time was shorter with higher take-off level and when no concentrate was provided. Protein and lactose content was highest for take-off level 300 g/min, but also lower when no concentrate was provided during milking. Percent of residual milk was highest in treatment 300f while lowest for 100f and 300nf. The present study therefore suggests that a take-off level at 500 g/min in combination with no concentrate during milking is appropriate to ensure a sufficient udder empting and possible improvement of milking efficiency, with a low effect on milk composition and no effect on milk yield.
Sammanfattning
Det har tidigare visats att hög avtagningsnivå på heljuvernivå kortar mjölkningstiden, det finns dock få studier som behandlar avtagningsnivåer på juverfjärdedelsnivå. Det har visats att utfodring av kraftfoder under mjölkning kan användas som en lockgiva för att motivera korna att besöka mjölkningsenheten samt för att förbättra mjölknedsläppet. Vidare har det även visats att mjölkavkastningen kan påverkas negativt av höga avtagningsnivåer men positivt förstärkas genom att ge kraftfoder under mjölkning. Syftet med denna studie var att utvärdera olika avtagningsnivåer på juverfjärdedelsnivå i kombination med eller utan kraftfoder under mjölkning. Studien genomfördes på Lövsta, nationellt forskningscentrum för lantbrukets djur, Uppsala, Sverige, under november och december 2015. Trettio kor av raserna Holstein (n=9) och Svensk Röd Boskap (n=21) användes. Tre olika avtagningnivåer (100, 300 eller 500 g/min) på juverfjärdedelsnivå i kombination med (f) eller utan kraftfoder (nf) under mjölkning testades i en sex veckor lång studie i en 6x6 Latin square modell. Det visade sig att mjölkavkastningen inte påverkades av vare sig avtagningsnivå eller utfodring av kraftfoder under mjölkning. Mjölksammansättningen påverkades av både avtagningsnivå och utfodring av kraftfoder under mjölkning. Laktos och proteinhalten var högre när kraftfoder gavs,
3
medan det fanns en tendens för lägre fetthalt. Mjölkningstiden var kortare med högre avtagningnivå och när ingen kraftfodergiva gavs under mjölkning. Även om den kortaste mjölkningstiden i denna studie observerades för avtagningnivå 500 g/min och när ingen kraftfodergiva gavs, var det ingen skillnad mellan behandlingarna. Protein och laktoshalt var högst för avtagningnivå 300 g/min, men också lägre när inget kraftfoder gavs under mjölkning. Procent av residualmjölk var högst för behandling 300f och lägst för 100f och 300nf. Den aktuella studien föreslår därför att en avtagningnivå på 500 g/min i kombination med inget kraftfoder under mjölkning är lämplig för att säkerställa en tillräcklig juvertömning och eventuell förbättring av mjölkningseffektiviteten, med en låg effekt på mjölksammansättningen och ingen effekt på mjölkmängden.
Introduction
Automatic milking system (AMS) is quite a complex system which depends on several things to function satisfyingly. Some general things are the cow traffic, feeding strategy, udder emptying and milking time. Breed and breeding is also of importance. AMS relays on voluntary entry to the milking unit (MU). Cows generally have a low motivation to be milked so a common way to motivate entry to the MU is to provide concentrate during milking. It has been showed in several studies that feeding concentrate during milking is a high motivation for the cows to enter the MU (Prescott et al., 1998; De Koning & Rodenburg, 2004; Forsberg, 2008; Markey, 2013). It can therefore be assumed that if no concentrate is given the milking interval will be longer. How much concentrate per milking and the total amount per day that should be given can be programed individually in a management software program.
In the MU is it a robotic arm that cleans the teat before milking, attaches the teat cups and applies disinfection spray after milking. For the robotic arm to work properly, several data has to be programed in a management software program that is connected to the MU. The data that is programmed are for instance teat position, take-off level and feeding distribution (De Koning & Rodenburg, 2004). One of the corner stones for a high milk yield is the udder emptying. To achieve an optimal emptied udder the take-off level has to be set so that the udder is sufficiently emptied when the teat cups are detached. In AMS cows are milked on udder quarter level and each teat cup is detached when the milk flow (g/min) for that udder quarter is lower than the pre-set take-off level. The effect of different take-off levels at whole udder level has been evaluated in several studies while fewer have tested take-off levels at udder quarter level. In the whole udder studies it has been shown that higher take-off level will, among other things, shorten the milking time.
To have a high milk yield with high milk quality and sufficient milk composition many things are important, the milking efficiency is one of these. Milking efficiency can be described in a number of ways, for example as the number of cows milked per hour, amount of milk obtained per cow and day or occupation rate. The milking efficiency is affected by several factors, such as milking time and take-off level (Stewart et al., 2002, Edwards, Jago & Lopez-Villalobos, 2013).
4
Milk composition is of great importance, not only for the payment of the milk but also for the nutritive value and the processability of the milk (Lindmark-Månsson et al., 2003). Since the payment for the milk is based on milk yield, fat- and protein content and milk quality; a high milk yield with high protein- and fat content, a low somatic cell count (SCC) and also a high milk quality (high processability, low bacterial contamination and high storage quality; De Koning & Rodenburg, 2004; Nielsen et al. 2005) is sought after. Milk fat content is the most important factor for a high payment (Lindmark-Månsson et al., 2003), since it decides how much fermented and processed milk can be achieved. The protein content is also of great importance, especially the casein content, since it determine how much cheese can be made from the milk (Lindmark-Månsson et al., 2003; Sjaastad et al., 2010).
The aim of this study was to evaluate how different take-off levels in combination with or without feeding during milking affect the milk yield and milk composition. The main interest for this paper is the milk yield, milk composition and factors affecting the milking efficiency, like milking time. The hypothesis is that with a higher take-off level the milking time should be reduced and the milk yield is thought be affected in only a small negative way. Feeding of concentrate during milking is considered a positive reward for the cow and it is thus thought to also have a positive effect on the milk yield.
Literature review
Automatic milking systems
The automatic milking systems (AMS) are today widely spread in the world and Northern Europe has the majority of the users (De Koning & Rodenburg, 2004). An AMS gives the farmer more flexible working hours and can devote time to other chores on the farm since the need of labour during milking is decreased (Rossing et al., 1997; Jacobs & Siegford, 2012).
AMS barns are usually divided into three areas; resting area, feeding area and the milking unit (MU) with or without a waiting area. The cows have a certain freedom to move between the areas as they choose. In the MU a robotic arm cleans the teats, puts the teat cups on and applies post-milking disinfectant (Rossning et al., 1997; De Koning & Rodenburg, 2004; Jacobs & Siegford, 2012).
Cow traffic and milking interval
Automatic milking systems relay on that cows are expected to voluntarily enter the MU (Rossing et al., 1997; Prescott et al., 1998; Hogeveen et al., 2001; De Koning & Rodenburg, 2004; Forsberg, 2008; Jacobs & Siegford, 2012). However, since the motivation to be milked generally is lower than motivation for eating and resting, it is common to offer a teaser feed ration of concentrate during milking to motivate the cows to go to the MU (Prescott et al., 1998; Forsberg, 2008; Markey, 2013). Prescott et al. (1997) found in a preference study in a Y-maze trial, that the cows were more interested in eating than milking. In the same study was the cows’ motivation to enter the MU, in an AMS with milk-first cow traffic, tested with or without feeding of concentrate directly after milking in an exit area. The results showed that cows had a higher motivation for entering the MU if
5
concentrate was provided. This is further supported by Melin et al. (2005) who suggested that a high motivation for feeding is prioritised over milking. Melin et al. (2005) in contrast to Prescott et al. (1997) fed concentrate in the MU during milking, while both studies had the same type of cow traffic system.
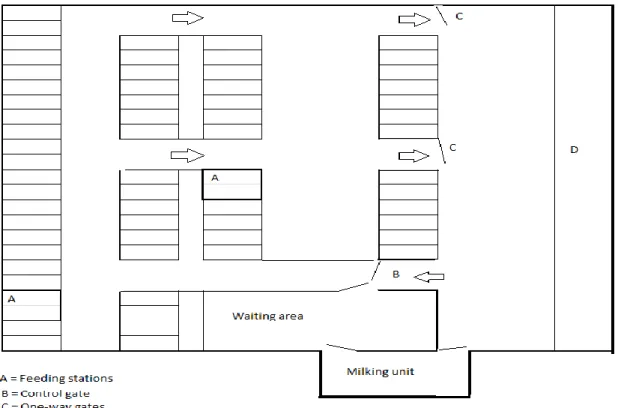
The term “cow traffic” describes how cows can move in the system. The first types of cow traffic systems were categorized as forced, semi-free and free (Forsberg, 2008). In forced cow traffic the cows are strictly guided between the areas in the AMS, in a certain pattern and have to go through the MU in order to get access to the feeding area. Free cow traffic gives the cows the freedom to decide how they want to move through the different areas and the MU. Semi-free cow traffic is an intermediate system where the cows are partly controlled in how they can move between the areas. Later on the terminology “feed-first” and “milk-first” cow traffic systems was added (Forsberg, 2008). Both these systems are a combination of semi-free and free cow traffic. The difference between them is from which area the cows enter the control gate to the MU. In feed-first system the cows are entering the control gate from the feeding area (Figure 1), while in the milk-first system they enter from the resting area. Addition to the control gate there are also one-way gates between the feeding- and resting area. Depending on cow traffic system, they lead to either of the areas (Markey, 2013; Figure 1).
Fig 1. An example on barn layout for a feed-first cow traffic system. The resting area, with cubicles and feeding stations (A), is on the left side in the figure. One-way gates (C) connect the resting area with the feeding area (D) (to the right in the figure). From the feeding area is a control gate (B) that guides the cow towards either the waiting area or the resting area. Source: Christine Hultén
6
Cows in an AMS have a time budget, which consist of eating, resting and milking. It has been reported that the more forced cow traffic the higher is the number of cows queuing to the MU, which is inactive times. It is however, considerably less common to fetch cows for milking in forced cow traffic compared to free cow traffic (Forsberg, 2008). Markey (2013) also reported that fewer cows are fetched in a feed-first cow traffic system compered to free cow traffic systems, when comparing data from 165 farms with free, with and without waiting area, and feed-first cow traffic. Several authors (Hogeveen et al., 2001; De Koning & Rodenburg, 2004; Melin et al., 2005) reported that the variety in milking interval is large on farms using automatic milking, as both short and long milking intervals has been observed. Milking interval in the studies included in this literature review was between eight and twelve hours, using different cow traffic systems with occupation rates between 46 and 66 cows per MU, and the studies have been performed in Sweden and the Netherlands (Hogeveen et al., 2001; Melin et al. 2005; De Koning & Rodenburg, 2004; Forsberg, 2008). One reason for long milking intervals is that cow traffic systems rely on voluntary entry to the MU. Irregular milking interval can be a problem for the milk production, and there exist divided opinion which milking interval is the most optimal. Hogeveen et al., (2001) found that high producing cows had a larger positive effect on the total milk yield per day at shorter milking intervals than low producing cows. Bruckmaier & Hilger (2001) found that with increasing milking interval there is an increasing milk yield.
Management
To help the farmer monitor the cow in a good way the AMS can be supplemented with a management software program. This program is designed to offer management decision support (De Koning & Rudenburg, 2004; DeLaval, 2007; Lely, 2016-03-24). The software program is linked to the MU, and for the MU to milk the cows in a good way certain information has to be programmed, for example teat position, take-off level, feed distribution and milking permission. Other information is collected, for example milk yield, milking interval, milking time, activity and visits and consumption in the feeding stations. The system can send information to a mobile receiver such as a mobile phone and alert the farmer of irregularities (Rossing et al., 1997; De Koning & Rudenburg, 2004; Jacobs & Sigford, 2012), for example lower milk yield than expected or irregularities in the milk, as blood or high somatic cell count (SCC).
The milking efficiency is a measure of how well the MU is functioning, which affects how well the AMS is functioning. It can be expressed in many ways; number of milkings per day (De Koning & Rodenburg, 2004; Castro et al., 2012), amount of milk obtained per minute, number of cows milked per hour or even with occupation rate (percentage of hour the MU is milking per day) Castro et al., 2012). Take-off level and the milking time per cow play a big role for the efficiency (Stewart et al., 2002; Edwards et al., 2013), also the milk flow, occupation rate and the herd size are important factors (Castro et al. 2012). De Koning & Rodenburg (2004) stated that one AMS can serve 55-60 cows which are supported with Markey (2013) results of 56 cows per AMS, with a small variation depending on cow traffic system. Castro et al. (2012) on the other hand suggests that a herd size of 59-68 cows is a maximum number of cows per AMS if the milk yield per AMS per year is maximized.
7
Lactation biology
Udder anatomy
The udder quarters consists of mainly two compartments, the alveolar and cistern compartment (Ipema & Hogewerf, 2008; Sjaastad et al., 2010). The main part of the alveolar compartment is located close to the abdomen, and can store most of the milk, around 80%. In this compartment there are clusters of alveoli, and these structures are called lobules. The milk is synthesized in the alveoli, which are then drained through small milk ducts that are connected to larger milk ducts. The milk ducts continues to merge until they reach the udder cistern. The udder cistern is the last compartment before the teat and mainly functions as storage and can hold around 20% of the milk (Sjaastad et al., 2010; Husvéth, 2011).
The teat consists of several structures, were the teat cistern is the first part of the teat and can store some milk between milkings. Between the teat cistern and teat canal is a structure called Furstenberg’s rosette which are seven to eight longitudinal folds and is thought to act as a defense against bacteria entry to the udder. The teat sphincter is longitudinal and circular smooth muscles located around the teat canal and serves to keep the teat canal closed between milkings (Sjaastad et al., 2010; Husvéth, 2011). The teat canal is the last structure of the teat. The teat is referred to as the first-line defence against intramammary infections and therefore does the recovery time of the teats structure after milking influence the defence and health of the teat (Neijenhuis et al., 2001).
Udder quarters
The udder is divided into four udder quarters, each quarter consist of mammary gland tissue and one teat. Each udder quarter is a separate unit and milk does not pass between the udder quarters (Ipema & Hogewerf, 2008; Sjaastad et al., 2010). This means that an udder can have one or more unhealthy quarters while the rest is healthy (Forsbäck et al., 2009).
Since the udder quarters are separate units it can be assumed that also the milk yield, milk flow and consequently also the milking time can be different for each quarter. This is supported by Hogeveen et al., (2001) who found that there were differences in milking time between udder quarters. It is also commonly known that in healthy udder rear teats have a larger milk yield than the front teats which is confirmed by Berglund et al., (2007), who also found that lactose content is higher in rear teats while fat content in higher in front teats. One of the benefits with automatic milking is the udder quarter level milking, which means that milking can be adjusted to one quarter and this minimizes the risks of over-milking (Hogeveen et al., 2001).
Milk synthesis
To synthesise milk, the udder requires several precursors, for example glucose for lactose synthesis, fatty acids and glycerol for milk fat synthesis, amino acids for protein synthesis, vitamins, minerals and anti-bodies, which are all transported to the udder by the blood (Sjaastad et al., 2010; Husvéth, 2011). Concentration of precursors in the blood, mammary blood flow and the mammary epithelial cells’ affinity for the precursors, which is under endocrine control, largely determine milk yield. Milk syntheses thus requires a lot of blood, approximately 500 litres of blood need to pass through the
8
mammary tissue in order to produce one litre of milk (Graham et al., 1934; Hamann & Krömker, 1997; Delamaire & Guinard-Flament, 2006). According to Sjaastad et al. (2010) is the mammary blood flow therefore relatively high during lactation and reaches up to 20% of the cardiac output in a high yielding cow.
Regulation of milk synthesis
Milk synthesis is regulated by both hormonal factors (for example progesterone, cortisol, prolactin and oxytocin) and local factors (for example milk removal and feedback inhibitors). Without the necessary hormone concentration in the blood or if the milk is not regularly removed from the secretory tissue through suckling or milking, milk production will cease (Sjaastad et al., 2010). Different hormones are of importance during different times in the lactation.
Presence of milk in the secretory tissue down regulates milk synthesis. Several mechanisms for this have been discussed in literature, for example intramammary pressure (IMP) and feedback inhibitor of lactation (FIL) (Peaker & Wide, 1996; Stelwagen et al., 1997; Bruckmaier & Hilger, 2001). IMP is elevated as more milk is accumulated in the alveoli (Bruckmaier & Hilger, 2001; Sjaastad et al., 2010). Bruckmaier & Hilger (2001) found that the IMP was higher for cows in early lactation after a 12 hour milking interval, while lowest in late lactation after a four hour milking interval. The authors stated that within the same lactation stage the IMP increases with increasing milking interval. The milk stored in the alveolar compartment is kept in alveolar lumen by tight junctions between the epithelial cells. If the tight junction is defected the blood-milk barrier is broken and the components in both blood and milk are fusing between the blood vessels and the alveoli lumen (Stelwagen et al., 1997; Sjaastad et al., 2010). The tight junctions can be defected for a number of reasons, of which two are high IMP and mastitis. This is partly supported by Stelwagen et al. (1997) who found that after introduction of once daily milking after twice daily milking the lactose and α-lactalbumin content in plasma is elevated for about 24 hour after which it decreases to almost normal levels. This indicates that the tight junctions are defected as a result of longer milking interval and thus higher IMP. Stelwagen et al., (1997) argued that reduced milk yield at once daily milk should not be a consequence of lactose losses through defected tight junction, since the lactose and sodium levels are back to normal level shortly after introduction of once daily milking.
FIL is one of the suggested local down regulators of milk synthesis. Peaker & Wide (1996) stated that FIL exists naturally in the milk and acts as an inhibitor of milk synthesis in the alveoli. If the milk is not removed from the udder the concentration of FIL will rise and the milk synthesis will be reduced. This can lead to lower milk yield, however by removing the milk from the udder and the alveolus, FIL is also removed and the milk synthesis is maintained (Sjaastad et al., 2010).
Milk ejection
The milk is stored in the alveoli and the milk ducts between milking. To gain access to this milk an active transport of the milk is needed, which is called milk ejection or milk let-down (Bruckmaier & Blum, 1998; Bruckmaier, 2001; Bruckmaier & Hilger, 2001; Sjaastad et al., 2010). Without this active
9
transport of the milk from the alveolar compartment only the milk in the milk ducts and udder cistern can be obtained during milking.
Milk ejection is an innate reflex that cannot be controlled by the animal. It occurs as a response to tactile stimulation of the udder as a neuroendocrine reflex and releases oxytocin from the pituitary (Bruckmaier & Blum, 1998; Bruckmaier, 2001; Svennersten-Sjaunja, 2004). The oxytocin is trans-ported by the blood to the udder and binds to the myoepithelial cells around the alveolus and causes them to contract. This contraction drains the milk out into the milk ducts, which leads to the udder cistern. Oxytocin also binds to the teat sphincter around the teat canal and causes them to relax, which makes it possible for the milk to leave the udder (Bruckmaier & Hilger, 2001; Sjaastad et al., 2010). Milk ejection and thus oxytocin release can be disturbed or be delayed by a number of reasons, for example stressful events, novel surroundings, milking interval and no pre-stimulation (Bruckmaier & Hilger, 2001; Rushen, et al. 2001).
Pre-stimulation is important for milk ejection, and thereby milk flow and indirect the take-off level. There are different ways to pre-stimulate the milk ejection, tactile stimulation is a common method used on farms with no automatic milking. Pre-stimulation in an AMS is any kind of teat cleaning procedure and can be done in a few different ways (Rossing et al., 1997). Also to provide feed, usually concentrate, during milking can be a pre-stimulation for the cow. No pre-stimulation and/or fast attachment of teat cup can result in a drop in milk flow as a result of emptying the udder cistern before the milk ejection has initiated the active transport of alveolar milk to the udder cistern. During the transient time between cistern empting and transport of alveolar milk to the milk cistern the teat is being milked empty (Bruckmaier, 2001). This is much like over-milking, which is negative for the teat and udder quarter health. Depending on how long and low this drop in milk flow is it can also result in an early detachment of the teat cups and thereby cause incomplete milking.
Milk yield and milk composition
The milk yield depends on many things, for instance; milking frequency and degree of udder empting, stage of lactation (Bruckmaier & Hilger, 2001; Bach & Busto, 2004; Sjaastad et al., 2010), time since last milking (Stelwagen et al., 1997; Bruckmaier & Hilger, 2001; Friggens & Rasmussen, 2001), breed and nutrition. If there is an incomplete emptying of the udder, through suboptimal milking technique, failure to attach the teat cups or lack of milk ejection the milk yield is affected in a negative way (Bach & Busto, 2004; Sjaastad et al., 2010). It is also commonly known that with higher days in milk (DIM) the milk yield will decrease (Bruckmaier & Hilger, 2001). At the start of lactation the milk yield rapidly increases until peak lactation, after which it will start to decreases.
Milk composition (fat, protein and lactose) and Somatic Cell Count (SCC) are of great importance to both the farmer and the dairy industry, since it influences both the processability and payment of the milk (Lindmark-Månsson et al., 2003). In many countries milk composition and SCC is measured regularly in bulk tank milk (Hamann & Krömker, 1997). According to several authors (Hamann & Krömker, 1997; Lindmark-Månsson et al., 2003; Nielsen et al., 2005) milk composition and milk quality reflect many things, for example feed composition and udder health.
10
There is a slight change in milk composition during milking (Friggens & Rasmussen, 2001; Ontsouka et al., 2003; Nielsen et al., 2005). Milk fat shows the most pronounced change in concentration during milking (Friggens & Rasmussen, 2001; Ontsouka et al., 2003; Nielsen et al., 2005), with a higher concentration at the end of the milking. This was demonstrated among others by Nielsen et al. (2005), who took milk samples from each udder quarter every 45 second during milking and Ontsouka et al., (2003), who took milk samples after every 0.5 kg of milk obtained from the right rear udder quart as well as a residual milk sample with help of an oxytocin injection. Both authors found that the fat content was lowest at the start of the milking and highest at the end of milking. Ontsouka et al., (2003) also found that the residual milk had the highest milk fat content, which could also be assumed from Friggens & Rasmussen, (2001) and Nielsen et al., (2005) studies. Nielsen et al., (2005) also reported that a healthy udder had lower fat content in the foremilk compared to the rest of the milking and could therefore not be used as an indication of the true fat content in the milk. Protein- and lactose content has an opposite change in concentration than milk fat. In the beginning of milking they are quite stable but towards the end both protein- and lactose content decreases (Nielsen et al., 2005). Nielsen et al. (2005) reported that the protein content in the foremilk is higher than in the rest of the milking. Lactose is involved in the regulation of milk yield and stands for about 50% of the osmolality in the udder (Stelwagen et al., 1997; Sjaastad et al., 2010). If low levels of lactose are produced then less water will fuse into the alveolus with a lower milk yield as consequence. The lactose content is also influenced by SCC, where higher SCC is associated with lower lactose content (Hamann & Krömker, 1997; Nielsen et al., 2005).
Milking
Milk yield can be measured as both daily milk yield and milk yield per milking. With a half udder milking technique Wiking et al., (2006) found that four times milking per day resulted in a higher milk yield, in average 9%, than twice daily milking, similar results for milking frequency has been found by Pearson et al. (1979), Stelwagen et al. (1997), Hogeveen et al. (2001) and Bach & Busto (2004). Other authors (Bruckmaier & Hilger, 2001; Friggens & Rasmussen, 2001) have found that milk yield per milking increases with increasing milking interval. In the AMS the milking permission can be determined by the farmer and is usually set to six hours.
In automatic milking the stimulation and cleaning of the udder is done by the MU (Rossing et al., 1997). From the start of stimulation to milk ejection there is a time delay, between one and two minutes, which increases with lower udder fill, higher DIM and shorter milking interval (Brukmaier & Hilger, 2001). If the time between pre-stimulation and teat cup attachment is to short there is a higher risk of a drop in milk flow before the alveolar milk reach the udder cistern.
Take-off level, milk flow and milking time
When the udder is sufficiently emptied the teat cups have to be detached. The take-off level, expressed as g/min or kg/min in literature, is adjusted to milk flow rate. When the milk flow is under the take-off level there is a time delay of a few seconds before the teat cups are detached. Both the take-off level and the time delay are programmed in the AMS management software program (Rossing et al., 1997; Jacobs & Siegford, 2012).
11
To achieve a high milk yield the take-off level has to be set at a level where the udder is optimally emptied. There is a wide variation in which take-off level that is recommended all from 300 g/min to 700 g/min (Nyman, 2010; Växa Sverige, 2015). The take-off level should not be too low since overmilking has several negative effects on both the udder and the teats (Rasmussen, 2004). However, if the take-off level is set too high the udder quarter might not be emptied sufficiently before the teat cup is detached, the quarter is than considered incompletely milked. Incomplete milking can result in negative consequences, like leakage of milk and reduced milk yield (Persson-Waller et al., 2003). Leakage of milk is also a high risk factor for mastitis (Hogeveen et al., 2001). To measure the degree of udder emptying, the residual milk can be extracted with help of oxytocin injection and then weighted.
The milk flow-rate is an essential factor for how high the take-off level can be. The milk flow-rate is affected by, among other things, the milking interval and tactile stimulation (Bruckmaier & Hilger, 2001; Hogeveen et al., 2001; Edwards et al., 2013). Hogeveen et al., (2001) found that a long milking interval resulted in higher milk rates while shorter interval was associated with lower milk flow-rates. This consists with Bach & Busto et al., (2004) study where the average and peak milk flow increased with increasing milking interval. With or without tactile stimulation also affects the milk flow-rate, a higher milk flow-rate was observed in cows with tactile teat stimulation compared with cows without this stimulation (Bruckmaier & Hilger, 2001; Edwards et al., 2013). Stewart et al., (2002) also found that the milk flow is affected by the take-off level, where a higher take-off level gave a higher average milk flow.
Several studies have shown that a higher take-off level and/or higher milk flow will shorten the milking time, which is from when the first teat cup is attached to the last teat cup is detached (Stewart et al., 2002; Hogeveen et al, 2001; Edwards et al., 2013). Stewart et al. (2002) found that in a parlour system an increase in take-of level on whole udder level, from 0.5 kg/min to 0.64 kg/min or 0.73 kg/min to 0.82 kg/min, was associated with a significantly shorter milking time for four of the five herds in the study. The milking time was 10.2 to 15.6 seconds shorter per cow with a higher take-off level. Edwards et al., (2013) also found that in a rotary milking system with 2x milking the milking time was reduced with a higher take-off level on whole udder level. If a high take-off level is used, then the cows also have to have a milk flow over that level. If the take-off level is not exceeded then the cow will not be milked. In Edward et al., (2013) study the time to average milk flow was shorter with a higher take-off level but only on the morning milking. The authors also found that there were significant differences in average milk flow between the take-off levels, a higher average milk flow at a higher take-off level. The effect of different take-off levels on whole udder level has been investigated in several studies, however are there non or very few done on udder quarter level.
Udder health
A healthy udder is the corner stone to high milk production. If the udder is unhealthy in any way, the milk yield and milk composition are greatly affected. According to a review by Heringstad et al. (2000), is mastitis one of the most common health problems on dairy farms. Mastitis is an inflammation which can be caused by different types of bacteria and can be either clinical or
sub-12
clinical. Clinical mastitis visually changes the milk, flakes and discolouration is typical signs of mastitis, even bad smelling milk is a clear sign. Redness, swelling and a warm udder quarters are also clear signs of mastitis. Sub-clinical mastitis on the other hand is not visual and is therefore harder to detect. A common way to determine if a cow has mastitis is to measure the SCC (Heringstad et al., 2000). According to Nielsen et al. (2005), SCC in foremilk gives a good indication if the udder quarter is unhealthy.
Teat-end condition is also a problem in dairy production since it affects the teat health and thereby also the milkability of the cow. Neijenhuis et al., (2001) studied the recovery of the teat after milking and found that it could take up to 8h for a teat to recover. So a short milking interval can thus be bad for the teat condition. Berglund et al., (2002) studied the difference in SCC and teat–end condition between conventional and automatic milking. SCC showed no difference between the different milking systems, there was however a difference in teat-end condition. The automatically milked cow’s had lower frequency of redness on teat skin while higher frequency of dry teat skins. Milking time is another factor that can affect the teat condition. Over-milking put strain on the teats and results in higher frequency of discolouration (Hillerton et al., 2002).
Aim and hypothesis
The main aim of this study was to evaluate how different take-off levels in combination with or without feeding of concentrate in the milking unit affect the milk yield and milking time in an automatic milking system. The possibility of improving the milking efficiency was of high interest. The hypothesis was that a high take-off level would shorten the milking time without a large negative affect on milk yield and milk composition. Feeding of concentrate during milking should be a positive reward for the cows and thus have a positive affect milk yield.
Material and Methods
Animals, housing and feeding
A total of 30 dairy cows of the Swedish Red breed (SRB; n = 21) and Swedish Holstein (SH; n = 9) from the experimental herd at The Swedish Livestock Research Centre, Lövsta, Uppsala, Sweden were used in the study. The main selection criteria for the cows were a lactation stage between 70 and 210 days in milk (DIM) and a SCC below 100 000 cells/ml on whole udder level at the start of the study. Values for SCC and lactose content were compared from two milkings close to the starting day of the study. Some cows did not meet the criteria but was included in the study since no other cows were available. In those cases there was one cow with a DIM of 215 and five cows had a SCC above 100 000 cells/ml milk. SCC did however not go above 130 000 cells/ml milk for any cow. The selected cows were in lactation one to five, with an average DIM at 153 ± 27.4 and an average SCC at 105 780 cells/ml milk.
13
The cows were housed in a loose-housing system with 62 cubicles, with saw dust bedding. The flooring was concrete and the manure was removed with a manure scrape. The cow traffic system was a feed-first system, with a control gate and two one-way gates between the resting and feeding area. The control gate is located between the feeding and resting area and connected to the waiting area before the MU. The control gate reads the identification chip that all cows carry on the necklace. If the cow has milking permission she is guided to the waiting area before the MU, otherwise she is let through to the resting area.
The cows had roughage and water ad libitum and the feed troughs (BioControl A/S, Norway) were refilled five to six times per day and consumption was recorded individually. Concentrate was fed individually in feeding stations located in the resting area, according to production level. If a cow got concentrate in the MU she got less concentrate in the feeding station. The overall concentrate ration per day was the same regardless if the cow got concentrate in the MU or not. The dry matter (DM) content of the roughage was analysed 5 times during the study, which was on routine in the barn. The DM content varied between 38% and 50.1 %, which can explain the slight average raise in feed intake during the study.
Study design
The study evaluated three take-off levels with or without a concentrate ration at milking (Table 1). The take-off levels were a milk flow of 500 g/min, 300 g/min and 100 g/min at udder quarter level. A maximum of two kg concentrate per day and cow was distributed in the MU (henceforth called feeding during milking). The treatments can be seen in Table 1. The treatment order was a 6x6 randomized Latin square design (Table 2), according to Kim & Stein (2009) model. The six treatments were randomly assigned a letter by lottery after which they were put into the 6x6 Latin square model (table 2).
Table 1. The six different treatments in the study including three take-off levels at udder quarter level in combination with or without feeding.
Treatment name
Take-off level
Feeding
Treatment group
500f
500 g/min
Feeding concentrate
A
300f
300 g/min
Feeding concentrate
C
100f
100 g/min
Feeding concentrate
B
500nf
500 g/min
No feeding of concentrate
D
300nf
300 g/min
No feeding of concentrate
E
100nf
100 g/min
No feeding of concentrate
F
14
Table 2. Treatment order of the experiment (6x6 Latin square model). Each letter represents one treatment. The rows are the treatment weeks and the columns the cow groups.
Group
Week
1
2
3
4
5
6
1
A B C D E F2
B C D E F A3
F A B C D E4
C D E F A B5
E F A B C D6
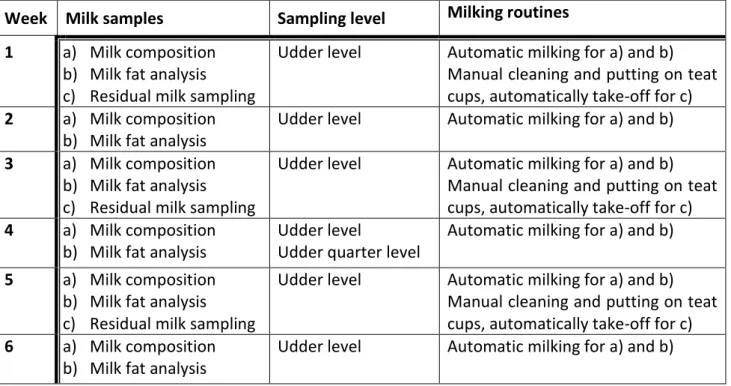
D E F A B CThe cows were blocked in six groups with a uniform distribution of breed, lactation number, DIM, lactose content and SCC in all groups. Each treatment was seven days long, hence fort referred to as treatment week.During the last two days of each treatment week milk samples was collected from all cows (Table 3). Treatment change was done the night of the seventh day upon completion of milk sample collection.
Table 3. Milk sampling scheme for the six week long milking experiment.
Week Milk samples
Sampling level
Milking routines
1
a)
Milk composition
b)
Milk fat analysis
c)
Residual milk sampling
Udder level
Automatic milking for a) and b)
Manual cleaning and putting on teat
cups, automatically take-off for c)
2
a)
Milk composition
b)
Milk fat analysis
Udder level
Automatic milking for a) and b)
3
a)
Milk composition
b)
Milk fat analysis
c)
Residual milk sampling
Udder level
Automatic milking for a) and b)
Manual cleaning and putting on teat
cups, automatically take-off for c)
4
a)
Milk composition
b)
Milk fat analysis
Udder level
Udder quarter level
Automatic milking for a) and b)
5
a)
Milk composition
b)
Milk fat analysis
c)
Residual milk sampling
Udder level
Automatic milking for a) and b)
Manual cleaning and putting on teat
cups, automatically take-off for c)
6
a)
Milk composition
b)
Milk fat analysis
15
Milking
The cows were milked in an automatic milking system (Voluntary Milking System™, DeLaval, Tumba, Sweden). Milking permission was granted six hours after previous milking and the milking intervals were planned to eight hours. The vacuum level was 45-46 kPa with a pulsation rate a 60 cycles per minute and the pulsation ratio was 65:35. About 2 hours per day, divided in three periods, were used for cleaning and washing the MU.
To achieve the planned milking interval, cows were fetched frequently during the day by the study personal. The mornings of day 2 and 3 the barn personal fetched the cows and had been instructed to do so at least every third hour, between 5AM and 12AM. The last fetching of cows was done sometime between 10:30PM and 0:30AM, depending on how many cows were above seven and close to eight hours in milking interval. Otherwise there was no personal in the barn during the night.
Milk sampling
Milk composition
Milk samples for the assessment of composition were collected from five consecutive milkings, starting on the morning of day 6 and ending on the evening of day 7. One drop of Bronopol (C3H6BrNO4) was added to the sampling tubes before sampling, as a preservative for the milk. These samples were collected using an automatic milk sampling equipment in the MU. A representative milk sample was automatically distributed into tubes (12 ml), one per cow and milking, after the end of the milking.
The milk samples were moved to the fridge (4° C) at the end of each day or when the milk sample racks were filled. After the last milk sample was collected on day 7, the milk samples were moved to a fridge in a laboratory at the Department of Animal Nutrition and Management in the Centre for Veterinary Medicine and Animal Science at Swedish University of Agricultural Sciences (SLU).
Fat analysis
Milk samples for fat analysis were collected every morning on the sixth day in each treatment week. Three different milk samples were taken to determine: milk fat globule size and stability (12 ml), free fatty acids (FFA; 5 ml) and beta-hydroxybutyrate and cholesterol (10 ml). These milk samples were manually allocated from a larger representative milk sample collected by the automatic milk sampling machine. The milk samples were after collecting stored in a Styrofoam box with a cool pack and then moved to the fridge (4° C) every second hour, or when the box was full. At approximately 14:00 hour, the milk samples for milk fat globule size and stability and cholesterol and beta-hydroxybutyrate were shipped overnight to Aarhus University (Folum research station, Tjele, Denmark) for analysis. This arrangement was required as the analyses required fresh milk.
The milk samples for FFA analysis were stored at Lövsta until after the study was finished. Twenty-four hours after collection, the samples were heat treated in a water bath of 68° C. The milk samples were in the water bath for five minutes, then carefully inverted. After inverting the samples they were returned to the water bath for another five minutes. After heating was complete, samples were
16
inverted again and then frozen (- 20° C). The samples for FFA analysis were sent to Aarhus University in the middle of January 2016.
Residual milk
Residual milk sampling was done during the afternoon of day 7 every 2nd week starting on week 1 (Table 3). The milking was done by first cleaning the teats manually with a wet cloth for about five seconds each or until visually clean. The cleaning order of the teats was the same for all cows. Each teat was stripped four to five times into a collection vessel, if the milk flow was low a few more strokes of milk were taken. The teat cups were attached manually, but removed automatically by the MU according to treatment assignment. Directly after milking, each cow was injected with 5-6 ml oxytocin (Partoxin
®
vet. 17µg (10 IU)/ml), depending on body size, in the left thigh muscle. Exactly three minutes after injection the cow were milked again on whole udder level using a bucket milking machine connected to the MU vacuum line. The milking cluster was manually detached when no visible milked flow was observed. The residual milk was weighted in a smaller bucket on a kitchen scale and a sample for milk composition analysis was collected. The milk samples were stored in a Styrofoam box with a cool pack and then moved to the fridge (4° C) every second hour, or when the box were full, to be stored until after the last cow was sampled.Quarter sampling
In treatment week 4, udder quarter sampling was conducted. Milk samples from three consecutive milkings were done on both udder quarter level and whole udder level, morning and afternoon day 6 and morning day 7 (Table 3). Only the milk samples for fat analyses were taken on udder quarter level on the morning of day 6.
The cleaning procedure of the teats was the same as for the residual sampling. The cleaning order was; right front teat, right rear teat, left front teat and left rear teat. The milk samples were taken before the milking in the same order as the teats were cleaned. After all samples were collected the teat cups were attached manually and removed automatically. The milk sample for the whole udder was taken by the automatic milk sampling machine.
Milk analysis
The analysis of milk composition was done at the laboratory at the Department of Animal Nutrition and Management in the Centre for Veterinary Medicine and Animal Science (Uppsala, Sweden). Two different machines were used for the analysis. The analysis of milk composition from treatment week 1 and 2 was done with a MilkoScan FT 120 (FOSS Electric A/S) and the analysis for week 3 to 6 was done with a LactoScope FTIR (Delta instruments). Both instruments used the same technic, namely
Fourier Transform Infrared Spectroscopy (FTIR). Also for the analysis of SCC two different machines was used. Fossomatic 5000 (FOSS Electric A/S) was used in treatment week 1 and 2 and Somascope (Delta instruments) was used in treatment week 3 to 6.
Three different analytical methods were used for the fat analysis, since different things were of interest. Milk fat globule size was analysed by integrated light scattering described by Wiking et al.,
17
(2004), who also described the analytical method for milk fat globule stability. Content of FFA was analysed with the ethyl chloroformate (ECF)-FFA method described by Amer et al., (2013). Cholesterol was analysed with the method described by Larsen (2012) and Beta-hydroxidase was analysed based on an enzymatic analyse method described by Larsen & Nielsen (2005).
Data handling
All numerical data (milk yield, milking time, milking interval, date, DIM, time of day etc.) were collected from the management software program, Delpro (DeLaval, Tumba, Sweden.
The planed milking interval at eight hour was difficult to keep at all times and since there was an additional 25 cows using the same MU as the cows in the study the overall milking interval and milking times could have been affected. Not all cows were affected by this, and went to the MU as they should and some had a milking interval at six to seven hours. Other cows had to be fetched more often and therefore also in most cases had longer milking intervals. This was however not recorded but a noted remark when the data was put into the data sheet.
At the start of the study all cows were healthy but in treatment week 1 one cow got mastitis and was moved to the sick stable for about three days, she was however back in the AMS when the milk samples were taken. In treatment week 3 another cow had to be moved to the sick stable because of lameness and did not return to the study until week 5, she therefore missed the quarter sampling. In treatment week 5 was one of the cows in standing heat and did not let down her milk. In this week the residual milk samples were taken and this particular cow had her whole milk yield emptied as residual milk, and thus had to be removed in the statistical evaluation for residual milk yield. In treatment week 4 there was a problem with changing treatment for seven of the cows, leading to two to three days delay in the change of treatment and a shorter treatment period before sampling. During the whole study there was one cow that had an unstable SCC which was throughout the study almost always higher SCC than 100 000 cells/ml on whole udder level.
Statistical analysis
For all analyses, the individual cow served as the experimental and observational unit. Harvested milk samples and residuals milk samples were analysed separately. The data were analysed by ANOVA for a6 × 6 Latin square with a 2 × 3 factorial arrangement of treatments in a linear mixed-effects model using repeated measures in the statistical software SAS (SAS Institute Inc., Cary, NC, USA). The model included the fixed effects of period, lactation number, DIM, take-off level, feeding and their interaction and the random effect of cow within group. Cow within group was included as a repeated measure. Data on SCC were natural log (ln)-transformed prior to analysis due to non-normal distribution. Differences in milk composition between harvested milk samples and residual milk samples were evaluated with a Student’s T-Test.
Values presented are LsMean ± SE unless otherwise stated. Treatment effects were declared significant at p≤0.05, while a trend was assumed for probabilities p<0.1 andp<0.05. Posthoc means separation for significant main effects was done using a Tukey’s.
18
Results
Fat analysis and milk composition results are more thoroughly reported in the master thesis by Tegevall, M (2016) Effects of take off level at udder quarter level and feeding during milking on milk fat quality and somatic cell count in Voluntary Milking System. Department of Animal Nutrition and Management. Uppsala, Swedish University of Agricultural Sciences.
Milk yield
Average daily milk yield for the six treatments and average milk yield per milking can be seen in Table 4. Neither take-off level nor feeding during milking affected milk yield. The yield was higher in the SH breed than the SRB breed, 29.12 ± 1.72 kg and 25.73 ± 1.44 kg respectively (P<0.01). Milk yield was higher in multiparous than primiparous cows (29.47 ± 1.42 kg and 25.37 ± 1.78 kg, P<0.005).
Table 4. Milk yield, residual milk yield, percentage of residual milk yield per milking, top- and average milk flows for different take-off levels at udder quarter level in combination with (f) or without feeding (nf) during milking, Ls means ± SE, 30 dairy cows.
100f 300f 500f 100nf 300nf 500nf Significant
Daily milk yield, kg 26,97 ±1,54 28,69 ±1,54 27,37 ±1,52 27,49 ±1,54 27,04 ±1,54 26,98 ±1,53 Ns Milk yield/milking, kg 12,71 ±0,71 13,27 ±0,71 12,83 ±0,71 12,87 ±0,71 12,64 ±0,71 12,69 ±0,71 Ns Residual milk yield,
kg 0,61 ±0,34 1,38 ±0,38 1,20 ±0,36 1,00 ±0,34 0,71 ±0,36 1,14 ±0,35 Ns Residual milk yield,
% 4,62 9,71 8,69 7,51 4,79 7,42 -
Average milk flow,
kg/min 0,89 0,96 0,96 0,94 0,95 0,96 -
Top milk flow,
kg/min 1,31 1,37 1,37 1,37 1,36 1,37 -
Residual milk yield varied between 0.067 and 5.773 kg of milk between the treatments. There were, however, no effects on residual milk yield (Table 4). Although no effect on residual milk yield, there is a variation in percentage of residual milk yield per milking for the different treatments (Table 4).
Milking time
Milking time was affected by take-off level (P<0.001) and feeding during milking (P<0.001). The variation between take-off levels were; 7.78 ± 0.48, 7.24 ± 0.48 and 6.73 ± 0.48 for 100g/min, 300g/min and 500g/min, respectively (Table 5). Milking time was higher when cows were fed than not fed during milking (7.51 ± 0.48 and 6.99 ± 0.48 respectively; Table 5).
19
Table 5. Milking time and milk flows from 30 dairy cows milked with or without feeding of concentrate during milking and at different take-off levels at udder quarter level, Ls means ±SE.
Feed No feed 100 g/min 300 g/min 500 g/min Significant
Milking time, min 7,51
±0,48 6,99 ±0,48 7,78 ±0,48 7,24 ±0,48 6,73 ±0,48 P<0.001
Average milk flow, kg/min 0,93 0,95 0,91 0,95 0,96 -
Top milk flow, kg/min 1,35 1,37 1,34 1,37 1,37 -
Differences in milking time were also found between treatment week 4 and the other weeks (P<0.001).
Milk composition
Differences were found for take-off level and feeding during milking in both protein- and lactose content. Protein content was highest for take-off level 100 g/min and lactose content were highest for take-off level 300 g/min, while fat content was not affected by the take-off level.
Table 6. Average milk composition and SCC in whole milk for 30 cows milked with different take-off levels at udder quarter level in an AMS, Ls Means ±SE.
Take-off level Milk
composition
100 g/min 300 g/min 500 g/min Significant Fat content 4,28 ± 0,14 4,33 ± 0,14 4,29 ± 0,14 ns
Protein content 3,51 ± 0,06 3,50 ± 0,06 3,45 ± 0,06 P<0.001 Lactose content 4,70 ± 0,05 4,72 ± 0,05 4,65 ± 0,05 P<0.001
SCC 27 214 27 587 29 505 ns
Both protein- and lactose content were higher when the cows were fed concentrate during milking while fat content had a tendency to be lower (P=0.0524; Table 6).
Table 7. Average milk composition for 30 cows milked with or without feeding of concentrate during milking on quarter level in an AMS, Ls Means ± SE.
Feed No feed Significant
Fat content 4,25 ± 0,13 4,35 ± 0,13 ns Protein content 3,51 ± 0,06 3,47 ± 0,06 P<0.01 Lactose content 4,72 ± 0,05 4,67 ± 0,05 P<0.001
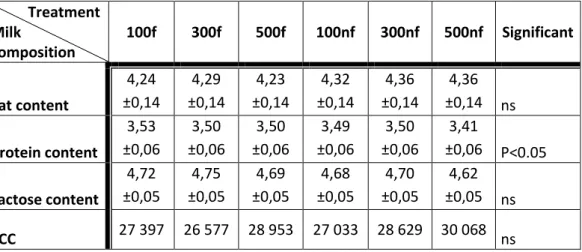
The protein content was affected by treatment (P<0.05), take-off level (P<0.001), feeding during milking (P<0.01) and udder quarter (P<0.01). There was also effects of treatment week (P<0.05) and breed (P<0.01) in residual milk. Lowest protein content was found for treatment 500nf (P<0.01). Take-off level 500g/min had lower protein content than other take-off levels (P<0.009). Feeding during milking resulted in higher protein content than no feeding during milking (P=0.01). The effect
20
of udder quarters was between left rear quarters and right front quarters, where left front quarters had higher protein content (P<0.01), and also the highest content among all quarters (3.60 ± 0.076). During the quarter sampling the right front teat was sampled first and left rear was sampled last for all cows, this was also the order of teat cup attachment. In residual milk had the SRB breed higher protein content than the SH breed (P<0.001). Treatment week 3 had the lowest content (P<0.05) among the treatment weeks.
Table 8. Milk composition and SCC in whole milk from 30 cows with different take-off levels at udder quarter level in combination with or without feeding of concentrate during milking, Ls means ± SE.
Treatment Milk composition 100f 300f 500f 100nf 300nf 500nf Significant Fat content 4,24 ±0,14 4,29 ±0,14 4,23 ±0,14 4,32 ±0,14 4,36 ±0,14 4,36 ±0,14 ns Protein content 3,53 ±0,06 3,50 ±0,06 3,50 ±0,06 3,49 ±0,06 3,50 ±0,06 3,41 ±0,06 P<0.05 Lactose content 4,72 ±0,05 4,75 ±0,05 4,69 ±0,05 4,68 ±0,05 4,70 ±0,05 4,62 ±0,05 ns SCC 27 397 26 577 28 953 27 033 28 629 30 068 ns
Lactose content was affected by take-off level (P<0.001), feeding during milking (P<0.001), udder quarter (P<0.001), treatment week (P<0.001) and breed (P<0.001). Lowest lactose content was found for take-off level 500 g/min (P<0.05). The lactose content was higher with feeding during milking compared to no feeding during milking (P<0.001). The right front quarters had higher lactose content than the left front and rear quarters (P<0.001). Treatment week 1 had highest lactose content in both whole milk and residual milk (P<0.01). Lactose content in the residual milk was also affected by breed (P<0.01), were a higher content was found in SH than SRB breed.
Fat content was affected by udder quarter (P<0.001), where the right front quarters had higher fat content than the other quarters (P<0.01) and left front quarter had higher fat content than left rear quarter (P<0.05). There were also a tendency for lower fat content with feeding during milking, in both daily fat content (P=0.0524) and fat content per milking (P<0.1) and for treatment week (P=0.051).
SCC
There was no difference in SCC between the treatments (Table 6 and Table 8), neither in daily milk, milk per milking nor in residual milk. There was however a difference between the right front quarter and the other quarters (P<0.001), where the right front quarter had higher SCC. There was also a difference between breeds, where the Swedish red had higher SCC (34 842 cells/ml) compared to Holstein (22 636 cells/ml; P<0.001).
21
Discussion
Milking efficiency
To improve the milking efficiency, the farmer first has to know what part in the chain that is to be improved. The milking time is in many cases the most important factor for an improved milking efficiency. In the present study the average milking time was approximately seven min, which is higher than observed by Hogeveen et al., (2001), Stewart et al., (2002) and Edwards et al., (2013), who reported average milking time of approximately five min. Nielsen et al., (2005) on the other hand had an average milking time of 5 min 34 sec and 6 min 45 sec for a milking interval of six and 12 hours, respectively. The findings by Nielsen et al., (2005) suggest that milking interval influences the milking time. In the present study was the milking interval set to 8 hour, this was however not always achieved, since both shorter and longer milking interval occurred, and the milking time can thus have been affected by this. A wide variation in milking time (min of 2.25 min and max of 27 min) was seen in the present study. Although outliner was corrected for the average milking time could still have been affected by the variation in milking interval. Long milking time might also be considered an error caused by, for example a calculation error or failure to attach the teat cups on the first try and therefore prolonging the attachment. Additionally to this variation Hogeveen et al., (2001) also stated that udder quarters have a variation in milking time.
In the present study, the milking time decreased with a higher take-off level, which is supported both by Stewart et al., (2002) and Edwards et al., (2013) findings that with an increased take-off level, the milking time is reduced. Stewart et al., (2001) compared take-off levels of 500 g/min with 640 g/min on one large farm and 730 g/min with 820 g/min on four large farms in the Midwest of USA, in a crossover design for a treatment period of one or two weeks. The overall result showed a decrease in milking time with a higher take-off level and with a slight increase in milk flow rate. Edwards et al., (2013), compered take-off levels of 200g/min, 400g/min, 600g/min and 800 g/min with different pre-stimulations (no stimulation, delay of 60 sec and 2 squirt strips of milk and a delay of 60 sec before attaching the teat cups) in a milking rotary with twice daily milking. Both higher take-off level and more pre-stimulation decreased the milking time in that study. In the present study was the difference between the longest and shortest milking time for the different take-off levels approximately 1.1 min, which is close to the finding of Edwards et al., (2013), who found a decreases in milking time of approximately 1.5 min between take-off levels 800 g/min and 200 g/min. In Stewart et al., (2002) study the decrease in milking time was approximately 0.2 min, however the small difference in the take-off level could explain the lower decrease in milking time. Both Stewart et al. (2002) and Edwards et al. (2013) studies were done on udder level while the present study was done on udder quarter level. Milking time for udder quarter milking is measured from the attachment of the first teat cup to the detachment of the last teat cup, while for whole udder milking the milking time is the same for all four teats. This means that in the present study each teat had its own milking time and the whole milking had one milking time. The milking time for each individual teat was however not measured and analysed. Udder quarter milking has several benefits for
22
example lower risk of over milking, isolating unhealthy udder and thereby also separate that milk from the healthy udders milk.
In the present study had feeding of concentrate during milking a negative effect on the milking time, where the difference was 0.5 min between feeding concentrate or not during milking. This is in contrast to other studies where it was found that feeding during milking had a positive effect on the milking time. The reason for this result in the present study can be that the cows got frustrated or stressed in connection to being provided concentrate during milking. The source for the frustration can be the time between entering the MU, getting concentrate and milking starting. Most cows also finished the concentrate ration before finishing milking, which might also be a source for frustration. In the present study there were no effect of treatment on milking time, the numerical variation between the treatments where however 1.5 min. The shortest milking time found was for treatment 500nf, which would indicate that a take-off level at 500 g/min in combination with no concentrate during milking is the optimal to improve the milking efficiency. However, in order to use a high take-off level the cows also had to have a sufficient milk flow. If the milk flow is near the take-take-off level, the cow will risk to be incompletely milked, since the milk flow can vary during the milking and decreases rapidly toward the end of the milking. In the present study were there a few cows that had milk flows near the level for the highest take-off level, at 500g/min, which resulted in an incomplete milking. Studies have however shown that the milk flow rate is positively affected by both longer milking interval and tactile stimulation (Bruckmaier & Hilger, 2001; Hogeveen et al., 2001; Edwards et al., 2013). Decreasing the milking time has several benefits for the efficiency, for example can more cows be milked during an hour and depending on how much the milking time is decreased it can lead to an improvement of the AMS capacity.
Milk yield
Milk yield is influenced by many factors, for instant; milking frequency, degree of udder empting, stage of lactation (Bruckmaier & Hilger, 2001; Bach & Busto, 2004; Sjaastad et al., 2010) and time since last milking (Stelwagen et al., 1997; Bruckmaier & Hilger, 2001; Friggens & Rasmussen, 2001). In the present study was the milk yield unaffected by both the treatments, take-off level and feeding. There was, however, a numerical variation in milk yield per milking and daily milk yield, which partly can be explained by natural causes and in some way by the milking routine. Constant milking interval will ensure maintenance of milk production, which was demonstrated by Stelwagen et al., (1997) where cows, after switching from being milked twice daily to once daily and back to twice daily, did not fully recover the expected milk yield. In the present study was the milking interval not constant, which could be an explanation of the numerical variation in milk yield. The effects of breed and parity on milk yield found in the present study were expected.
The milk yield will naturally decrease after peak lactation. In the present study the average decrease in milk yield was approximately 2.1 kg over the whole six weeks, which is an average decline of 0.35 kg per week. Normally the expected decline is approximately 0.5 kg per week after peak lactation (Personal communication; Spörndly, 2016), which is 3 kg in six week. The slightly lesser decrease of