Educational Study
Educational environment measurement, how is it affected
by educational strategy in a Saudi medical school? A multivariate analysis
Mona Hmoud Al Sheikh, PhD
Physiology Department, King Fahd University Hospital AlKhobar, AlKhobar, Kingdom of Saudi Arabia
Received 19 January 2013; revised 12 November 2013; accepted 25 November 2013
ﺍﻟ ﻤﻠ ﺨ ﺺ ﺃ ﻫ ﺪﺍ ﻑ ﺍﻟ ﺒ ﺤ ﺚ : ﺗﻬ ﺪ ﻑ ﻫ ﺬﻩ ﺍﻟ ﺪ ﺭ ﺍ ﺳ ﺔ ﺇﻟ ﻰ ﺩ ﺭ ﺍ ﺳ ﺔ ﻭ ﻣﻘ ﺎ ﺭ ﻧﺔ ﺍﻟﺒ ﻴﺌ ﺔ ﺍﻟﺘ ﻌﻠ ﻴﻤ ﻴﺔ ﻟﻤ ﺴ ﺎ ﺭ ﻣﻨ ﻬ ﺠ ﻴ ﻦ ﻣﺘ ﻮﺍ ﺯ ﻳﻴ ﻦ ﻓ ﻲ ﻛﻠ ﻴﺔ ﺍﻟ ﻄ ﺐ ﺑ ﺠ ﺎﻣ ﻌ ﺔ ﺍﻟ ﺪ ﻣﺎ ﻡ . ﻭ ﻛ ﺬﻟ ﻚ ﺩ ﺭ ﺍ ﺳ ﺔ ﺗﺄ ﺛﻴ ﺮ ﺍﻟ ﻤﻨ ﻬ ﺞ ﻭﺍ ﻟﻤ ﺴ ﺘ ﻮ ﻯ ﺍﻟ ﺪ ﺭ ﺍ ﺳ ﻲ ﻭ ﺟ ﻨ ﺲ ﺍﻟ ﺪﺍ ﺭ ﺱ ﻋ ﻠ ﻰ ﺗﻘ ﻴﻴ ﻤ ﻪ ﻟﺒ ﻴﺌ ﺘﻪ ﺍﻟﺘ ﻌﻠ ﻴﻤ ﻴﺔ . ﻃ ﺮ ﻕ ﺍﻟ ﺒ ﺤ ﺚ : ﺗﻢ ﺍ ﺳ ﺘ ﺨ ﺪﺍ ﻡ ﻣﻘ ﻴﺎ ﺱ ﺩﻧ ﺪ ﻱ ﺍﻟ ﺠ ﺎ ﻫ ﺰ ﻟﻠﺒ ﻴﺌ ﺔ ﺍﻟﺘ ﻌﻠ ﻴﻤ ﻴﺔ ﺍﻟ ﻤ ﻌ ﺮ ﻭ ﻑ ﺑ ـ " ﺩ ﺭ ﻳﻢ " ﻟﻬ ﺬﺍ ﺍﻟ ﻐ ﺮ ﺽ . ﻭ ﻭ ﺯ ﻋ ﺖ ﺍ ﺳ ﺘﺒ ﺎﻧ ﺔ ﺍﻟﺒ ﺤ ﺚ ﻟﻌ ﺪ ﺩ 573 ﻃ ﺎﻟ ﺒﺎ ﻭ ﻃ ﺎﻟ ﺒﺔ ﺑ ﻮﺍ ﺳ ﻄ ﺔ ﺍﻟﺒ ﺎ ﺣ ﺚ ﻟ ﻺ ﺟ ﺎﺑ ﺔ ﻋ ﻠﻴ ﻬﺎ ﻭ ﺟ ﻤ ﻌ ﻬﺎ ﻣﺒ ﺎ ﺷ ﺮ ﺓ ﻓ ﻮ ﺭ ﺍ ﻻ ﻧﺘ ﻬﺎ ﺀ ﻣﻨ ﻪ . ﻭ ﻗﺪ ﺷ ﻤ ﻞ ﺍﻟﺘ ﺤ ﻠﻴ ﻞ ﺍ ﻹ ﺣ ﺼ ﺎﺋ ﻲ ﻋ ﻠ ﻰ : 1 ( ﺍ ﻹ ﺣ ﺼ ﺎﺀ ﺍﻟ ﻮ ﺻ ﻔ ﻲ ، 2 ( ﺗﺄ ﺛﻴ ﺮ ﻛ ﻞ ﻣﺘ ﻐﻴ ﺮ ﻋ ﻠ ﻰ ﺣ ﺪﺓ ، 3 ( ﺗﺄ ﺛﻴ ﺮ ﻋ ﺪﺓ ﻣﺘ ﻐﻴ ﺮ ﺍ ﺕ ﻣ ﺠ ﺘﻤ ﻌ ﺔ ﻋ ﻦ ﻃ ﺮ ﻳ ﻖ ﺗ ﺤ ﻠﻴ ﻞ ﻣ ﻌﺎ ﻣ ﻞ ﺍ ﻻ ﺭ ﺗﺒ ﺎ ﻁ ﻭﺍ ﻹ ﻧ ﺤ ﻨﺎ ﺀﺍ ﺕ ﺍﻟﺘ ﺤ ﻠﻴﻠ ﻴﺔ ﻟ ﺠ ﻤﻴ ﻊ ﺍﻟ ﻤﺘ ﻐﻴ ﺮ ﺍ ﺕ . ﺍﻟ ﻨﺘ ﺎﺋ ﺞ : ﺣ ﺼ ﻞ ﺍ ﺳ ﺘﺒ ﻴﺎ ﻥ ﺩ ﺭ ﻳﻢ ﻓ ﻲ ﻫ ﺬﻩ ﺍﻟ ﺪ ﺭ ﺍ ﺳ ﺔ ﻋ ﻠ ﻰ ﻣ ﺠ ﻤ ﻮ ﻉ ﻛﻠ ﻲ ﻣﻘ ﺪﺍ ﺭ ﻩ 106 / 200 ﻡ . ﻭ ﻛﺎ ﻥ ﻣﻨ ﻬ ﺞ ﺍﻟ ﺪ ﺭ ﺍ ﺳ ﺔ ﺍﻟ ﻤﺘ ﻐﻴ ﺮ ﺫ ﻭ ﺍﻟﺘ ﺄﺛ ﻴ ﺮ ﺍ ﻷ ﻛﺒ ﺮ ﻋ ﻠ ﻰ ﻣ ﺴ ﺘ ﻮ ﻳﺎ ﺕ ﺗﻘ ﻴﻴ ﻢ ﺍﻟ ﻄ ﻼ ﺏ ﻟﻠﺒ ﻴﺌ ﺔ ﺍﻟﺘ ﻌﻠ ﻴﻤ ﻴﺔ ﻣﻘ ﺎ ﺭ ﻧﺔ ﺑﺎ ﻟﻤ ﺴ ﺘ ﻮ ﻯ ﺍﻟ ﺪ ﺭ ﺍ ﺳ ﻲ ﻭ ﺟ ﻨ ﺲ ﺍﻟ ﺪﺍ ﺭ ﺱ . ﻭ ﻛﺎ ﻥ ﻣ ﺴ ﺘ ﻮ ﻯ ﺍﻟ ﺮ ﺿ ﺎ ﺃ ﻋ ﻠ ﻰ ﻟﺪ ﻯ ﻃ ﻼ ﺏ ﻭ ﻃ ﺎﻟ ﺒﺎ ﺕ ﺍﻟ ﻤﻨ ﻬ ﺞ ﺍﻟ ﻘﺎ ﺋﻢ ﻋ ﻠ ﻰ ﺣ ﻞ ﺍﻟ ﻤ ﺸ ﻜ ﻼ ﺕ ﺧ ﺎ ﺻ ﺔ ﺑﺎ ﻷ ﻣﺎ ﻛ ﻦ ﺍﻟﺒ ﻴﺌ ﻴﺔ ﺍ ﻵ ﻣﻨ ﺔ ، ﻭ ﺑ ﻮ ﺟ ﻮ ﺩ ﺍﻟﺜ ﻘﺔ ﺑﺎ ﻟﻨ ﺠ ﺎ ﺡ ، ﻭ ﻏ ﻴﺎ ﺏ ﺍﻟ ﻤﻠ ﻞ ﻣ ﻊ ﺍﻣ ﺘ ﻼ ﻙ ﻣ ﻬﺎ ﺭ ﺍ ﺕ ﺣ ﻞ ﺍﻟ ﻤ ﺸ ﻜ ﻼ ﺕ ، ﻭ ﻣ ﻬﺎ ﺭ ﺍ ﺕ ﺍﻟﺘ ﻌﺎ ﻣ ﻞ . ﻛ ﻤﺎ ﻛﺎ ﻥ ﻭﺍ ﺿ ﺤ ﺎ ﺃ ﻥ ﺍﻟ ﻄ ﺎﻟ ﺒﺎ ﺕ ﺃﻛ ﺜ ﺮ ﺭ ﺿ ﺎ ﻓ ﻲ ﻣ ﺴ ﺎ ﺭ ﻣﻨ ﻬ ﺞ ﺣ ﻞ ﺍﻟ ﻤ ﺸ ﻜ ﻼ ﺕ ﻭﺃ ﻗ ﻞ ﺭ ﺿ ﺎ ﻓ ﻲ ﻣ ﺴ ﺎ ﺭ ﺍﻟ ﻤﻨ ﻬ ﺞ ﺍﻟﺘ ﻘﻠ ﻴﺪ ﻱ . ﻭ ﻛﺎ ﻥ ﻏ ﻴﺎ ﺏ ﺍﻟﺘ ﻮ ﺟ ﻴﻪ ﻭﺍ ﻹ ﺭ ﺷ ﺎﺩ ﺍ ﻷ ﻛﺎ ﺩﻳ ﻤ ﻲ ﺑﺎ ﺭ ﺯ ﺍ . ﺍ ﻻ ﺳ ﺘﻨ ﺘﺎ ﺟ ﺎ ﺕ : ﻓ ﻲ ﺍﻟ ﻤ ﺠ ﻤ ﻞ ﻛﺎ ﻧ ﺖ ﺍﻟﺒ ﻴﺌ ﺔ ﺍﻟﺘ ﻌﻠ ﻴﻤ ﻴﺔ ﻓ ﻲ ﺍﻟ ﺠ ﺎﻧ ﺐ ﺍ ﻹ ﻳ ﺠ ﺎﺑ ﻲ ﻭ ﻫ ﻨﺎ ﻙ ﻣ ﺠ ﺎ ﻝ ﻟﻠﺘ ﺤ ﺴ ﻴ ﻦ . ﻭ ﻛﺎ ﻥ ﻭﺍ ﺿ ﺤ ﺎ ﺃ ﻥ ﻃ ﻼ ﺏ ﻣ ﺴ ﺎ ﺭ ﻣﻨ ﻬ ﺞ ﺣ ﻞ ﺍﻟ ﻤ ﺸ ﻜ ﻼ ﺕ ، ﻭﺍ ﻟ ﻄ ﺎﻟ ﺒﺎ ﺕ ، ﻭ ﺟ ﻤﻴ ﻊ ﺍﻟ ﺪﺍ ﺭ ﺳ ﻴ ﻦ ﺑﺎ ﻟﻤ ﺴ ﺘ ﻮ ﻳﺎ ﺕ ﺍﻟ ﺪ ﺭ ﺍ ﺳ ﻴﺔ ﺍ ﻷ ﻭﻟ ﻰ ﻫ ﻢ ﺍ ﻷ ﻛﺜ ﺮ ﺭ ﺿ ﺎ ﻣ ﻦ ﻏ ﻴ ﺮ ﻫ ﻢ ﻋ ﻦ ﺍﻟﺒ ﻴﺌ ﺔ ﺍﻟﺘ ﻌﻠ ﻴﻤ ﻴﺔ . ﺍﻟ ﻜﻠ ﻤﺎ ﺕ ﺍﻟ ﻤ ﻔﺘ ﺎ ﺣ ﻴ ﺔ : ﺍﻟﺒ ﻴﺌ ﺔ ﺍﻟﺘ ﻌﻠ ﻴﻤ ﻴﺔ ; ﺍﻟﺘ ﻌﻠ ﻴﻢ ﺑﺎ ﺳ ﻠﻮ ﺏ ﺣ ﻞ ﺍﻟ ﻤ ﺸ ﻜ ﻼ ﺕ ; ﻣﻘ ﻴﺎ ﺱ ﺩﻧ ﺪ ﻱ ﺍﻟ ﺠ ﺎ ﻫ ﺰ ﻟﻠﺒ ﻴﺌ ﺔ ﺍﻟﺘ ﻌﻠ ﻴﻤ ﻴﺔ ; ﺩ ﺭ ﻳﻢ Abstract
Objectives: This study was an attempt to measure and compare the educational environment of two parallel cur-ricular streams in the University of Dammam. It examined the effect of the type of curriculum, year of study and gen-der on students’ perception of their educational environ-ment.
Methods: The Dundee Ready Education Environment
Measure (DREEM) tool was selected for this purpose. It was administered to 573 (Male 241, female 332) students by the researcher and collected at the same setting. The sta-tistical analysis included (i) Descriptive statistics (ii) Effects of single variables (iii) Multivariate and regression analysis. The researcher used Mann–Whitney test and Kruskal–Wal-lis test for determining the effects of single variables with respect to two groups and three groups respectively. In Corresponding address: Head of the Examination Center, Physiology Department, Administration Bldg 400, 2nd floor, Medical Education Unit, Medical School, King Fahd University Hospital AlKhobar, P.O. Box 2208, AlKhobar 31952, Kingdom of Saudi Arabia. Tel.: +966 8966666x1151, mobile: +966 0504981912; fax: +966 8966720.
E-mail:[email protected],[email protected](M.H. Al Sheikh) Peer review under responsibility of Taibah University.
Production and hosting by Elsevier
Journal of Taibah University Medical Sciences (2014) 9(2), 115–122
Taibah University
Journal of Taibah University Medical Sciences
www.sciencedirect.com
1658-3612Ó2014 Taibah University. Production and hosting by Elsevier Ltd. All rights reserved.
order to determine the combined effect of the gender, year of study and method of teaching the researcher used Spear-man rank correlation and Multiple linear regression.
Results: DREEM score was 106/200. The curriculum had the greatest impact on students’ perception of their educa-tional environment as compared to year of study and gen-der. PBL stream had higher student satisfaction. Female students were more satisfied in the PBL stream and were less satisfied in the traditional one. Lack of counseling ser-vices was prominent in all.
Conclusions: The overall educational environment is on the positive side with room for improvement. PBL students, females and junior students were more satisfied about the educational environment than their counterparts.
Keywords:Curriculum; DREEM; Educational environment; PBL
Ó2014 Taibah University. Production and hosting by Elsevier Ltd. All rights reserved.
Introduction
According to Meyer-Parsons (1989), improving the medical learning environment by changing teaching methods, for example, will lead to better learning and better perception by students of their educational environment.1
The present study aims to measure students’ perceptions about the educational environment in a medical school that teaches medicine by 2 different educational strategies parallel to each other namely conventional and problem-based learn-ing. The conventional curriculum is a discipline-based 100% Flexenerian curriculum with no integration and complete sep-aration between preclinical and clinical phase. The PBL curric-ulum, on the other hand, is a hybrid with few resource sessions and two case discussions per week. In the first session, students analyze the triggers and determine their learning needs. In the second session, they come prepared and present the material to their group members. Results of this study are expected to have strong implications on adoption of an effective curricu-lum design and teaching/learning practices in the mainstream of medical school, focusing remedial actions to a particular stage or year in the curriculum or to a particular gender. In addition, it will help in prioritizing development of subsets of the educational environment scales according to students’ requirements.
Students experience or perceive the educational environ-ment of the overall medical school as climate. It is the climate that influences behavior.2There is increasing evidence of the
importance of educational environment in the measurement of effective student learning. The educational environment makes a great impact on students’ learning experiences and outcomes. It dictates how, why and what students learn.3
It has a major impact on the well being of the individual, his progress and his career choice.2,4The quality of the learning environment has been identified as a factor for effective learn-ing and students’ academic success.5It is also one of the most important factors for determining the success of a curriculum.6
Creation of a conducive environment is indispensable to suc-cess. In such an environment, not only learning is valued but also the evaluation, review and commitment to improvement.7 Learning depends on several factors, but a crucial step is the engagement of the learners. This is affected by their moti-vation and perception of relevance, which in turn, can be af-fected by their previous experiences and preferred learning styles, and by the context and environment in which the learn-ing is taklearn-ing place.8
Clinical Research using students’ perceptions of important dimensions of the classroom environment as independent vari-ables has established consistent relationships between learning environment, and students’ academic and social emotional outcomes.9–15
One of the main qualities of a positive educational environ-ment is to impart students’ influence and responsibility over their own learning situation, and thereby increase the likeli-hood that students would become active learners. This focus is consistent with a social cultural perspective which views learning as an active process, taking place in interactions with other more knowledgeable persons.9
The UK Standing Committee on Postgraduate Education highlighted the importance of educational environment in their statement that ‘‘A working environment that is conducive to learning is critically important to successful training”.16
Materials and Methods
Inclusion criteria:All medical students in the conventional and PBL program in levels III, IV and VI were included. Students were 573; 241 males and 332 females in both conventional and PBL curricula.
This is a cross-sectional study that was performed during the academic year 2009/2010 in a medical school in the King-dom of Saudi Arabia.
The Dundee Ready Educational Environment Measure (DREEM) Inventory was used for measurement of students’ perceptions of the educational environment in its original lan-guage (English). This instrument is intended to measure and diagnose the environments of educational institutions in the healthcare professions.17,18
Anonymous Questionnaires were directly administered and supervised by the researcher and students were given 1–2 h to answer them. Students were not allowed to discuss with each other but they were allowed to ask questions to the instructor about the meaning of statements or educational terms in the questionnaire.
Data analysis was done using Statistical Package for Social Sciences (SPSS) for Windows Version 16. Descriptive statistics were used to show the distribution of the data. It was used to give mean scoring of each statement in each students’ sub-group, overall and subscale means. Besides the statistical sig-nificance, the items were scrutinized for the educational significance in interpreting the values.
Inferential statistics were used to derive conclusions about the population, based on the sample of data. In order to deter-mine the combined effect of the gender, year of study and method of teaching the researcher used Spearman Rank Correlation.
Multivariate logistic regression models were used to iden-tify the factors related to educational environment perception
that differ between students following the conventional curric-ulum to those following the PBL program.
Results
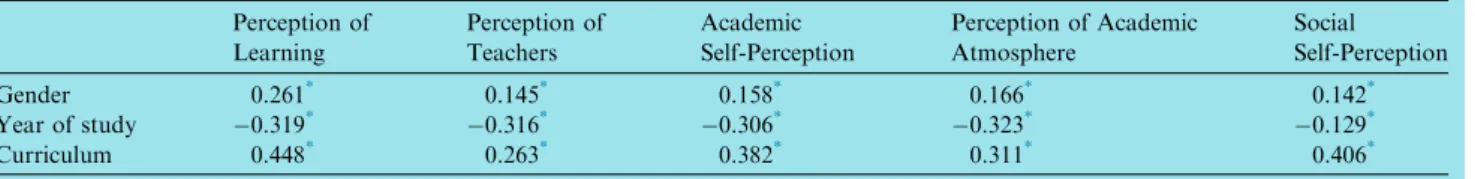
Subjects (n= 573) were drawn from third, fourth and sixth year students of both streams of the College of Medicine. Figure 1gives at a glance the distribution of subjects among various levels, type of curriculum, and gender (male and female).
In general our results have shown that the educational envi-ronment at UOD is on the positive side and is comparable to two other schools in the region. Students of the PBL stream had more positive perception of their educational ment. Third year students perceived the educational environ-ment more positively when compared with the fourth and sixth year students. Clinical phase of the curriculum needs spe-cial attention. Revision of the academic decisions on changes of exams, rotations, and training sites is required. Female stu-dents have more positive perceptions of their educational envi-ronment with exception of sixth year female students. Female students belonging to PBL stream had 14 statements with very positive score of more than ‘‘3”. Sixth year female students belonging to conventional stream had responded very nega-tively to the statement about relaxed environment in ward teaching, educational feedback is lacking and needs reinforce-ment, and feel overloaded with the curriculum work.
The subjects belonging to the PBL stream have higher aver-age scores than those belonging to the conventional stream. The females in general have higher average score when com-pared with their male counter parts. Interestingly, the higher average scores in respect of the third year, PBL stream and fe-male students are observed consistently on each of the five sub-scales of the DREEM inventory.
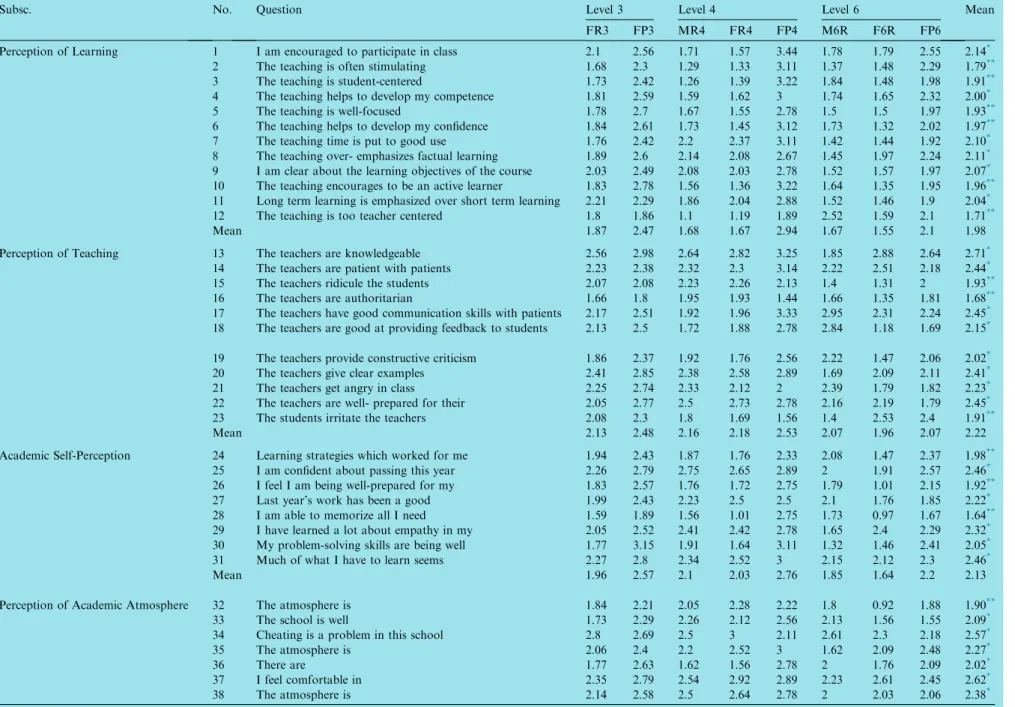
The mean score of the students under each level, stream, and gender, for each of the fifty statements of the DREEM inventory, categorized under the five sub-scales has been tabu-lated for each item inTable 1. The last column ofTable 1 rep-resents the overall mean scores on each of the fifty statements. With respect to females studying in third level, it can be seen
that the DREEM scores in PBL stream are higher consistently in each of the five sub-scales.
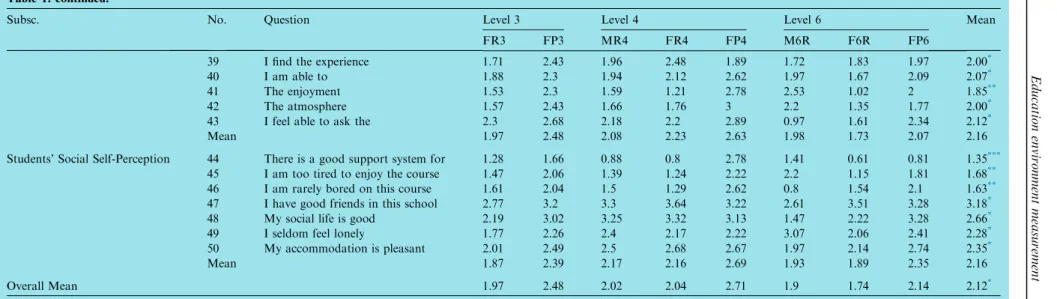
Similarly between scores on conventional stream and PBL stream for the fourth level students. It can be seen that in both males and females, the DREEM scores are higher in PBL stream than conventional stream. The superiority of PBL stream is observed consistently on each of the five sub-scales. The relationship of average scores with gender, year of study and method of teaching were measured by Spearman Rank Correlation and Multiple linear regression. The results of correlation are shown inTable 2. There are significant posi-tive correlations between average scores andGender, but sig-nificant negative correlations between average scores and Year of Study.Also there are significant positive correlations between average scores andCurriculum.
Discussion
Our study found anoverall score for DREEM in all groups (n= 573) to be equal to 106/200 The DREEM global scores for medical schools in Trinidad, Srilanka, Nepal, Nigeria and UK were reported as 109.9/200,19 108/200,20 130/200,21
118/20021 and 139/20022 respectively. The mean DREEM score for a medical school in India was reported as 107/ 200.23 The mean domain scores for first year students were 29/48, 26/44, 19/32, 28/48 and 16/28, respectively, while for the clinical phase students, the scores were found to be 27/ 48, 30/44, 20/32, 30/48 and 15/28, respectively.
Our result is comparable to the medical school in India and Sri Lanka and shows a similar trend of better satisfaction in ear-lier years of study. As far as the subscales of DREEM are con-cerned, the difference was more pronounced for the Academic Self Perception, followed by Perception of Atmosphere and Per-ception of Learning in the clinical phase. The preclinical phases were comparable in the two universities. Regression analysis showed Year of Study and Curriculum to have the strongest influence on overall DREEM scores (p<0.0005) in (Table 3).
This study demonstrates that students perceive the educa-tional environment of PBL curriculum to be more conducive to learning than that of conventional curriculum. The
differ-84 27 130 100 55 33 34 68 42 0 20 40 60 80 100 120 140
Conventional PBL Conventional PBL Conventional PBL
3rd Level 4th Level 6th Level
Male Female
Figure 1:Distribution of study subjects among different levels, type of curriculum and gender.
Table 1: Mean scores of students and perceptions of students on all 5 subscales of DREEM.
Subsc. No. Question Level 3 Level 4 Level 6 Mean
FR3 FP3 MR4 FR4 FP4 M6R F6R FP6
Perception of Learning 1 I am encouraged to participate in class 2.1 2.56 1.71 1.57 3.44 1.78 1.79 2.55 2.14*
2 The teaching is often stimulating 1.68 2.3 1.29 1.33 3.11 1.37 1.48 2.29 1.79**
3 The teaching is student-centered 1.73 2.42 1.26 1.39 3.22 1.84 1.48 1.98 1.91**
4 The teaching helps to develop my competence 1.81 2.59 1.59 1.62 3 1.74 1.65 2.32 2.00*
5 The teaching is well-focused 1.78 2.7 1.67 1.55 2.78 1.5 1.5 1.97 1.93**
6 The teaching helps to develop my confidence 1.84 2.61 1.73 1.45 3.12 1.73 1.32 2.02 1.97**
7 The teaching time is put to good use 1.76 2.42 2.2 2.37 3.11 1.42 1.44 1.92 2.10*
8 The teaching over- emphasizes factual learning 1.89 2.6 2.14 2.08 2.67 1.45 1.97 2.24 2.11*
9 I am clear about the learning objectives of the course 2.03 2.49 2.08 2.03 2.78 1.52 1.57 1.97 2.07*
10 The teaching encourages to be an active learner 1.83 2.78 1.56 1.36 3.22 1.64 1.35 1.95 1.96**
11 Long term learning is emphasized over short term learning 2.21 2.29 1.86 2.04 2.88 1.52 1.46 1.9 2.04*
12 The teaching is too teacher centered 1.8 1.86 1.1 1.19 1.89 2.52 1.59 2.1 1.71**
Mean 1.87 2.47 1.68 1.67 2.94 1.67 1.55 2.1 1.98
Perception of Teaching 13 The teachers are knowledgeable 2.56 2.98 2.64 2.82 3.25 1.85 2.88 2.64 2.71*
14 The teachers are patient with patients 2.23 2.38 2.32 2.3 3.14 2.22 2.51 2.18 2.44*
15 The teachers ridicule the students 2.07 2.08 2.23 2.26 2.13 1.4 1.31 2 1.93**
16 The teachers are authoritarian 1.66 1.8 1.95 1.93 1.44 1.66 1.35 1.81 1.68**
17 The teachers have good communication skills with patients 2.17 2.51 1.92 1.96 3.33 2.95 2.31 2.24 2.45*
18 The teachers are good at providing feedback to students 2.13 2.5 1.72 1.88 2.78 2.84 1.18 1.69 2.15*
19 The teachers provide constructive criticism 1.86 2.37 1.92 1.76 2.56 2.22 1.47 2.06 2.02*
20 The teachers give clear examples 2.41 2.85 2.38 2.58 2.89 1.69 2.09 2.11 2.41*
21 The teachers get angry in class 2.25 2.74 2.33 2.12 2 2.39 1.79 1.82 2.23*
22 The teachers are well- prepared for their 2.05 2.77 2.5 2.73 2.78 2.16 2.19 1.79 2.45*
23 The students irritate the teachers 2.08 2.3 1.8 1.69 1.56 1.4 2.53 2.4 1.91**
Mean 2.13 2.48 2.16 2.18 2.53 2.07 1.96 2.07 2.22
Academic Self-Perception 24 Learning strategies which worked for me 1.94 2.43 1.87 1.76 2.33 2.08 1.47 2.37 1.98**
25 I am confident about passing this year 2.26 2.79 2.75 2.65 2.89 2 1.91 2.57 2.46*
26 I feel I am being well-prepared for my 1.83 2.57 1.76 1.72 2.75 1.79 1.01 2.15 1.92**
27 Last year’s work has been a good 1.99 2.43 2.23 2.5 2.5 2.1 1.76 1.85 2.22*
28 I am able to memorize all I need 1.59 1.89 1.56 1.01 2.75 1.73 0.97 1.67 1.64**
29 I have learned a lot about empathy in my 2.05 2.52 2.41 2.42 2.78 1.65 2.4 2.29 2.32*
30 My problem-solving skills are being well 1.77 3.15 1.91 1.64 3.11 1.32 1.46 2.41 2.05*
31 Much of what I have to learn seems 2.27 2.8 2.34 2.52 3 2.15 2.12 2.3 2.46*
Mean 1.96 2.57 2.1 2.03 2.76 1.85 1.64 2.2 2.13
Perception of Academic Atmosphere 32 The atmosphere is 1.84 2.21 2.05 2.28 2.22 1.8 0.92 1.88 1.90**
33 The school is well 1.73 2.29 2.26 2.12 2.56 2.13 1.56 1.55 2.09*
34 Cheating is a problem in this school 2.8 2.69 2.5 3 2.11 2.61 2.3 2.18 2.57*
35 The atmosphere is 2.06 2.4 2.2 2.52 3 1.62 2.09 2.48 2.27* 36 There are 1.77 2.63 1.62 1.56 2.78 2 1.76 2.09 2.02* 37 I feel comfortable in 2.35 2.79 2.54 2.92 2.89 2.23 2.61 2.45 2.62* 38 The atmosphere is 2.14 2.58 2.5 2.64 2.78 2 2.03 2.06 2.38* 118 M.H. Al Sheikh
Table 1: continued.
Subsc. No. Question Level 3 Level 4 Level 6 Mean
FR3 FP3 MR4 FR4 FP4 M6R F6R FP6
39 I find the experience 1.71 2.43 1.96 2.48 1.89 1.72 1.83 1.97 2.00*
40 I am able to 1.88 2.3 1.94 2.12 2.62 1.97 1.67 2.09 2.07*
41 The enjoyment 1.53 2.3 1.59 1.21 2.78 2.53 1.02 2 1.85**
42 The atmosphere 1.57 2.43 1.66 1.76 3 2.2 1.35 1.77 2.00*
43 I feel able to ask the 2.3 2.68 2.18 2.2 2.89 0.97 1.61 2.34 2.12*
Mean 1.97 2.48 2.08 2.23 2.63 1.98 1.73 2.07 2.16
Students’ Social Self-Perception 44 There is a good support system for 1.28 1.66 0.88 0.8 2.78 1.41 0.61 0.81 1.35***
45 I am too tired to enjoy the course 1.47 2.06 1.39 1.24 2.22 2.2 1.15 1.81 1.68**
46 I am rarely bored on this course 1.61 2.04 1.5 1.29 2.62 0.8 1.54 2.1 1.63**
47 I have good friends in this school 2.77 3.2 3.3 3.64 3.22 2.61 3.51 3.28 3.18*
48 My social life is good 2.19 3.02 3.25 3.32 3.13 1.47 2.22 3.28 2.66*
49 I seldom feel lonely 1.77 2.26 2.4 2.17 2.22 3.07 2.06 2.41 2.28*
50 My accommodation is pleasant 2.01 2.49 2.5 2.68 2.67 1.97 2.14 2.74 2.35*
Mean 1.87 2.39 2.17 2.16 2.69 1.93 1.89 2.35 2.16
Overall Mean 1.97 2.48 2.02 2.04 2.71 1.9 1.74 2.14 2.12*
F: female, M: male, P: PBL, R: Conventional, 3–6: level or year of study.
* Positive perception of the educational environment. ** Weakness areas.
*** Negative perception (alarm sign).
Education
environment
measurement
ence in perception or satisfaction was even more pronounced in preclinical years.
The University of Dammam (UoD) has a unique setup where two parallel programs are conducted simultaneously for teaching medicine, sharing the same faculty. The conven-tional stream was established 35 years ago, and the recently-adopted PBL stream started in 2003. In addition, the Kingdom of Saudi Arabia adopts the gender segregation model for high-er education. Male and female students study separately, at least in the first 4 years of the curriculum. At present, the stra-tegic plan of UoD is being revisited to adhere to the require-ments of NCAAA. One of the major issues is to evaluate the present curriculum.
The strength of this study lies in the following facts: The DREEM inventory was used in its original form and language with consistent high reliability (0.89), the student response rate was 100% due to the fact that the questionnaire was submitted before written examination and the inventory was adminis-tered directly by the researcher giving explanations and clarifi-cations, whenever needed.
The study has some limitations. It is by no means conclu-sive because we are assessing the current perception, which may change on reflection later in practice. The real difference
will be known after the products of these two streams performed in practice. Then only can the advantages and disadvantages be assessed and compared. Comparison of perceptions of instructors of both these streams was not done. It would have given a valuable insight into this issue.
It is good that friendship is perceived positively by medical students in a highly competitive program (>3). The next high-est was the statement about cheating. It is reassuring that most students thought there was no cheating in exams. It is worth noting that this statement was less positive in the PBL stream. A warning signal was recorded in the statement regarding counseling and support services which got a lowest overall score of1.35. This necessitates immediate action. The solution lies in opening a ‘‘Counseling and Student Support Center”as a part of the strategic plan of the University.
The next group of statements with a score of 1.5–2 were considered as areas of deficiency/weakness. They need to be gi-ven priority to create a remedial action plan with time frames. It is alarming to note that students feel that teaching is not stimulating or not student-centered, which is a basic principle of the Adult Learning Theory first described by Malcolm Knowels in 1970. This calls for overall curricular reform and major change in methods of instruction. If the teaching is
Table 2: Spearman rank correlation.
Perception of Learning Perception of Teachers Academic Self-Perception Perception of Academic Atmosphere Social Self-Perception Gender 0.261* 0.145* 0.158* 0.166* 0.142* Year of study 0.319* 0.316* 0.306* 0.323* 0.129* Curriculum 0.448* 0.263* 0.382* 0.311* 0.406* *
Correlations are significant at 0.01 level.
Table 3: Regression analysis.
Scale Value ß t p-value
Perception of Learning Constant 1.616 10.448 <0.0005
Gender of student 0.063 1.171 0.242
Year of study 0.11 5.485 <0.0005
Curriculum 0.569 10.054 <0.0005
Perception of Teachers Constant 2.367 22.248 <0.0005
Gender of student 2.089 6.463 0.531
Year of study 0.023 0.627 <0.0005
Curriculum 0.211 5.41 <0.0005
Academic Self-Perception Constant 2.108 13.708 <0.0005
Gender of student 0.073 1.371 0.171
Year of study 0.126 6.308 <0.0005
Curriculum 0.53 9.414 <0.0005
Perception of Academic Atmosphere Constant 2.296 16.192 <0.0005
Gender of student 0.025 0.506 0.613
Year of study 0.115 6.283 <0.0005
Curriculum 0.331 6.376 <0.0005
Social Self-Perception Constant 1.704 12.381 <0.0005
Gender of student 0.033 0.688 0.492
Year of study 0.033 1.874 0.041
Curriculum 0.486 9.677 <0.0005
Coding:1 – Male, 2 – Female; 1 – Conventional, 2 – PBL; 3 – 3rd year, 4 – 4th year, 6 – 6th year.
not stimulating or not student-centered, it will not be condu-cive for learning. Further, the students will not be confident, and therefore, not well-prepared for their profession. There is also an element of overload. Students feel too stressed to en-joy their learning. They are forced to be passive learners. Envi-ronment is perceived as threatening and not relaxed.
The statement related to teachers being authoritarian re-flects the faculty body of UoD which was studied in a recent Faculty Perceptions Survey. This may be a reflection of the ‘‘older type” of senior teachers who taught by experience rather than by training. Faculty development workshop on ‘‘Effective Teaching Techniques” covering all skills required for ideal lecturing, small group teaching, bedside teaching, and constructive feedback is given by the ‘‘Medical Education Unit”at the start of each academic year. Participation in these workshops is optional and does not cover the ones who need it most.
The relevance of learning is closely linked to motivation: relevance for immediate needs, for future work, for getting a certificate or degree regardless of content. Learning for learn-ing’s sake is out of fashion in higher education after a move to-ward vocational or industrial preparation. Certain courses in medical degrees have been notoriously poorly received by stu-dents. Faculty members need to explain to students why these courses are necessary and how they link to future practice.
Students of the PBL stream thought more positively about being encouraged and being able to ask questions in class than the conventional one. This is part of the educational structure for PBL where students are the main actors and teachers are mere facilitators. Students think, speculate, and solve prob-lems, in an informal setting following group dynamics and team work. In conventional stream, students listen to the lec-turer in a formal setting and ask questions only if allowed by the instructor.
PBL students thought that their teaching is more stimulat-ing than conventional ones. This is expected because these stu-dents can perceive relevance early in the curriculum as they start learning about cases that are common in their commu-nity. They are asked to take history, suggest pertinent physical examination, laboratory investigation, decide the diagnosis and management. They discover their lack of knowledge and have a natural drive to learn required information in order to solve the problem and be of help to the patient. This way of teaching is very stimulating and follows the Experiential Theory of Learning. In contrast to that, students in the conven-tional program learn a lot of theoretical facts that they don’t see the relevance till later years. This, in addition to the high workload deprives students from enjoying or being stimulated. In PBL, students appreciate their active role in the learning process. They decide their gaps in the knowledge, list their learning needs, and are required to search for them in appro-priate resources. They also prepare power-point presentations and explain what they gathered to their colleagues which al-lows them to practice interpersonal, presentation and commu-nication skills. It is made very clear from the beginning that facilitators are not a source of knowledge.
PBL students thought more positively about their training for long term memory. This could be because they are contin-uously asked to decide on prior knowledge. The higher satis-faction of the PBL group about their teachers may be partly because of the fact that tutors are paid extra money and they are nominated by students. So if the tutor is helpful they get
more cases. This result is surprising because teachers are the same for PBL and conventional programs. So, it is the same teacher perceived differently by different student groups be-cause of the different type of interaction and setup.
PBL tutors are instructed to give constructive feedback at the end of each case discussion session which explains why stu-dents in this stream gave higher scores to feedback. All tutors are also given some training on proper feedback mechanisms and the use of the ‘‘Sandwich technique”. Lack of proper feed-back and constructive criticism is a universal finding in most educational systems.
Confidence in passing develops when the student knows the learning outcomes, trusts the assessment and feels that he/she has acceptable competency in all the areas required. Although PBL curriculum is a new one, students of this program seem to have more confidence in the system.
The relevance of teaching to career is much more evident to PBL students who learn about clinical problems, teamwork, and group dynamics from the first day. So face validity is very high in PBL programs in general. Conventional program stu-dents eventually realize that what they learnt throughout col-lege was relevant but the problem is that they forget by the time they need it. Group interaction among PBL students cre-ates a collaborative atmosphere. Students learn to be patient with weaker students and help them to pick up. PBL students feel accountable for the knowledge of their colleagues. They try to simplify, clarify the information, and reveal the maze of thoughts to their friends. This explains why they perceived Empathy in their training.
The hallmark of problem-based learning is developing problem solving skills in every case discussion session. Con-ventional program students practice problem solving in tutori-als, laboratory sessions and in some assignments. Still PBL students are more satisfied in this regard.
PBL students are all the time interacting with their col-leagues, teachers, physicians and administrators and so they get more chance to develop their interpersonal skills. Small group discussion is much less threatening than large group ses-sion in front of 100 students.
Sixth year students were particularly negative about being able to ask questions or get feedback and the reasons could be that most of the learning activities in senior years are not supervised. Clinical attachment system, in which a few stu-dents are continuously linked with one clinical unit, can solve this issue. Contrary to expectation, preclinical students thought they were more active learners than clinical students, and that long-term learning was emphasized.
Conflict of interest
The author declares no conflict of interest in the study being submitted.
References
1. Meyer-Parsons B. Exploding heads, doing school and intangible work: an ethnographic case study of first year education doctoral students becoming education researchers;2011.
2. Genn JM. AMEE Medical Education Guide No. 23 (Part 1): curriculum, environment, climate, quality and change in medical education – a unifying perspective.Med Teach 2001; 23: 337.
3. Fraser BJ, Williamson JC, Tobin KG. Use of classroom and school climate scales in evaluating alternative high schools.Teach Teach Educ 1987; 3: 219–231.
4. Genn JM. Research into the climates of Australian schools, colleges and universities: contributions and potential of need-press theory.Aust J Educ 1984; 28: 227–248.
5. Bassaw B. Students’ perspectives on the educational environment, Faculty of Medical Sciences, Trinidad.Med Teach 2003; 25: 522. 6. Berwick DM. A primer on leading the improvement of systems.Br
Med J 1996; 312: 619–622.
7. Hutchinson L. Educational environment. BMJ (Clin Res Ed) 2003; 326: 810.
8. Thuen. Are changes in students’ perceptions of the learning environment related to changes in emotional and behavioural problems?School Psychol Int 2009; 30: 115–136.
9. Carmody DF. Perceptions by medical students of their educa-tional environment for obstetrics and gynaecology in metropolitan and rural teaching sites.Med Teach 2009; 31: 596.
10. Clapham M, Wall D, Batchelor A. Educational environment in intensive care medicine – use of Postgraduate Hospital Educa-tional Environment Measure (PHEEM).Med Teach 2007; 29: 184. 11. de Oliveira Filho GR, Vieira JE. The relationship of learning environment, quality of life, and study strategies measures to anesthesiology resident academic performance.Anesth Analg 2007; 104: 1467–1472.
12. Eccles JS. The development of children ages 6 to 14.Future Child 1999; 9: 30–44.
13. Fraser BJ. Syntheses of educational productivity research.Int J Educ Res 1987; 11: 147–252.
14. Rutter M. Environmentally mediated risks for psychopathology: research strategies and findings. J Am Acad Child Adolesc Psychiatry 2005; 44: 3–18.
15. Dunne F, McAleer S, Roff S. Assessment of the undergraduate medical education environment in a large UK medical school.
Health Educ J 2006; 65: 149–158.
16. Roff S, McAleer S, Skinner A. Development and validation of an instrument to measure the postgraduate clinical learning and teaching educational environment for hospital-based junior doc-tors in the UK.Med Teach 2005; 27: 326.
17. Roff S. Development and validation of the Dundee Ready Education Environment Measure (DREEM). Med Teach 1997; 19: 295–299.
18. Linda H. Educational environment.Br Med J 2003; 326: 810. 19. Abraham R. Students’ perceptions of learning environment in an
Indian medical school.BMC Med Educ 2008; 8: 20.
20. Jiffry MTM. Using the DREEM questionnaire to gather baseline information on an evolving medical school in Sri Lanka. Med Teach 2005; 27: 348.
21. Roff S. A global diagnostic tool for measuring educational environment: comparing Nigeria and Nepal. Med Teach 2001; 23: 378.
22. Varma R, Tiyagi E, Gupta JK. Determining the quality of educational climate across multiple undergraduate teaching sites using the DREEM inventory.BMC Med Educ 2005; 5: 8. 23. Shreemathi M, Sue R. Students perceptions of educational
environment: a comparison of academic achievers and under-achievers at Kasturba Medical College, India.Educ Health Change Learn Pract 2004; 17: 280.