Portland State University
PDXScholar
Dissertations and Theses Dissertations and Theses
Spring 5-29-2019
Development of a Readiness Assessment Model for Evaluating Big
Data Projects: Case Study of Smart City in Oregon, USA
Husam Ahmad Barham Portland State University
Let us know how access to this document benefits you.
Follow this and additional works at:https://pdxscholar.library.pdx.edu/open_access_etds
Part of theTechnology and Innovation Commons
Recommended Citation
Barham, Husam Ahmad, "Development of a Readiness Assessment Model for Evaluating Big Data Projects: Case Study of Smart City in Oregon, USA" (2019).Dissertations and Theses.Paper 4996.
Development of a Readiness Assessment Model for Evaluating Big Data Projects: Case Study of Smart City in Oregon, USA
by
Husam Ahmad Barham
A dissertation submitted in partial fulfillment of the requirements for the degree of
Doctor of Philosophy in
Technology Management
Dissertation Committee: Tugrul U. Daim, Chair
Timothy R. Anderson Richard C. Sperry
Dara Shifrer
Portland State University 2019
Abstract
Big data projects are facing an alarmingly high percentage of failure, with severe consequences related to the cost of this type of projects, the waste of resources and efforts in doing it, and the competitive disadvantage caused by the lack of big data analytics capabilities in comparison with competitors. Furthermore, there is a decent amount of research on the main challenges facing big data projects. However, there is a lack of research on how to leverage on this knowledge to evaluate an organization’s readiness for a big data project, more specifically, how to systematically assess an organization’s current status against known reasons that might cause a big data project to fail. Hence, identifying shortcomings that need to be addressed before the project start, to reduce chances of failure for that project.
Therefore, the primary goal of this research is to help any organization, which is planning to transform to the big data analytics era, by providing a systematic and comprehensive model that this organization can use to better understand what factors influence big data projects. Also, the organization’s current status against those factors. Finally, what enhancements are needed in the organization’s current capabilities for optimal management of factors influencing an upcoming big data project. However, big data applications are vast and cover many sectors, and while most of the factors
influencing big data projects are common across sectors, there are some factors that are related to the specific circumstances of each sector. Therefore, this research will focus on
one sector only, which is the smart city sector, and its generalizability to other sectors is discussed at the end of the research.
In this research, literature review and experts feedback were used to identify the most critical factors influencing big data projects, with focus on smart city, Then, the HDM methodology was used to elicit experts judgment to identify the relative
importance of those factors. In addition, experts’ feedback was used to identify possible statuses an organization might have regarding each factor. Finally, a case study of four projects related to the City of Portland, Oregon, was conducted to demonstrate the practicality and value of the research model.
The research findings indicated that there are complicated internal and external, sometimes competing, factors affecting big data projects. The research identified 18 factors as being among the most important factors affecting smart-city-related big data projects. Those factors are grouped into four perspectives: people, technology, legal, and organization. Furthermore, the case study demonstrated how the model could pinpoint shortcomings in a city’s capabilities before the project start, and how to address those shortcomings to increase chances of a successful big data project.
DEDICATION
To my beloved parents:
My father and role model, Ahmad Barham, who instilled in me the notion that sky is the limit, and anything is possible with hard work and passion.
My mother, Aqsam Ijmail, whose unshakeable belief in me and my ability to achieve success in anything I engage in, have always ignited me to do more and keep trying to be better every day.
To my dear wife, Asmaa Hamadmad, whose endless love, support, and compassion allowed me to overcome all the challenges I faced throughout my Ph.D. journey.
ACKNOWLEDGMENTS
I cannot begin to express my thanks and gratitude for every person who supported me while doing my research, these are people who dedicated time and effort that I
leveraged to conduct this research, and without them, I would not be able to finish it successfully. I am eternally grateful to all of them.
I am deeply indebted to my advisor and committee chair Prof. Tugrul Daim; it would not have been possible to reach where I am today without his guidance, mentoring, and endless support. He is one of the best and brightest minds in the technology
management discipline, and I am privileged to be one of his students.
I would also like to express my deepest appreciation to my committee members, Dr. Tim Anderson, Dr. Richard Sperry, and Dr. Dara Shifrer. I am grateful to all the time, effort, advice, and encouragement they offered me while doing my dissertation.
I would also like to acknowledge Dr. Wilfred Pinfold, CEO at urban.systems, and John MacArthur, Sustainable Transportation Program Manager at TREC for their
valuable insights and feedback regarding my research topic. Furthermore, I wish to thank Kevin Martin, Smart City PDX Manager, and Hector Dominguez, Open Data
Coordinator at the City of Portland for their help and valuable insights. Moreover, I would like to extend my sincere thanks to all the experts who participated in my subject-matter-expert panels, their time, feedback, and insights were critical for my research to move forward.
In addition, I am grateful to all the faculty members and staff in the ETM department; they were always available to answer questions and clarify any issue. Also,
other Ph.D. students who helped me by offering advice and support at each stage of my research.
Finally, I am sure to forget someone, as the support I received was tremendous. To anyone I failed to mention, please accept my apologies and thanks for your time and effort.
TABLE OF CONTENTS
ABSTRACT ... i
DEDICATION ....... iii
ACKNOWLEDGMENTS ....iv
LIST OF TABLES ... x
LIST OF FIGURES ....xii
CHAPTER 1: INTRODUCTION ... 1
1.1PROBLEM STATEMENT ... 3
1.1.1 My Research Focus ... 5
CHAPTER 2: LITERATURE REVIEW ... 10
2.1BIG DATA ... 10
2.1.1 Definition ... 10
2.1.2 Big Data Benefits and Value ... 15
2.2SMART CITY ... 17
2.2.1 Definition ... 18
2.2.2 Smart-City Categories ... 19
2.2.3SMART-CITY AND BIG DATA ... 20
2.3INTELLIGENT TRANSPORTATION SYSTEMS ... 21
2.3.1 Definition ... 22
2.3.2 Automotive Technologies Under ITS ... 24
2.4READINESS ASSESSMENT ... 27
2.5PROJECT MANAGEMENT ... 29
2.5.1 Definition ... 29
2.5.2 Big Data Projects ... 30
2.5.3 Readiness Assessment Phase ... 30
2.6CRITICAL FACTORS AFFECTING BIG DATA PROJECTS ... 31
2.6.1 People Perspective ... 36
2.6.2 Technology Perspective ... 38
2.6.3 Legal Perspective ... 40
2.6.4 Organization Perspective ... 42
2.7BIG DATA PROJECTS VS.LARGE-SCALE ITPROJECTS IN THE PUBLIC SECTOR ... 45
CHAPTER 3: RESEARCH OBJECTIVES, QUESTIONS, AND METHODOLOGY ... 54 3.1RESEARCH GAPS ... 54 3.2RESEARCH GOAL ... 55 3.3RESEARCH QUESTIONS ... 55 3.4METHODOLOGY ... 56 3.4.1 HDM Model ... 56
3.4.2 Experts Judgement ... 62
3.4.2.1 Challenges and Considerations ... 67
3.4.2.2 Experts Inconsistencies ... 69
3.4.2.3 Experts Disagreements ... 74
3.4.2.4 Sensitivity Analysis (SA) ... 82
3.4.3 Value/Desirability Curves ... 86
3.4.4 HDM Benefits ... 89
3.4.5 HDM Limitations ... 90
3.4.6 City’s Index of Readiness to Conduct a Smart-city-related Big Data Project . 92 3.4.7 Methodology Justification and Comparison with other Methodologies ... 94
CHAPTER 4: RESEARCH DESIGN ... 104
4.1HIGH-LEVEL RESEARCH REVIEW ... 104
4.2RESEARCH DESIGN DETAILS ... 105
4.3EXPERT PANELS DESIGN ... 112
4.3.1 Expert Panels Format ... 112
4.3.2 Potential Experts ... 118
CHAPTER 5: RESULTS OF MODEL VALIDATION AND QUANTIFICATION ... 123
5.1EXPERT PANELS FORMATION ... 127
5.1.1 Overview of Experts ... 127 5.1.2 Data Collection ... 133 5.2HDMMODEL VALIDATION ... 134 5.2.1 Decision Level ... 134 5.2.2 Perspective Level ... 135 5.2.2 People Factors ... 136 5.2.3 Technology Factors ... 138 5.2.4 Legal Factors ... 140 5.2.5 Organization Factors ... 142 5.2.6 Changes ... 144 5.2.7 Final HDM Model ... 147 5.3HDMMODEL QUANTIFICATION ... 148 5.3.1 Perspective Level ... 148 5.3.2 People Factors ... 151 5.3.3 Technology Factors ... 153 5.3.4 Legal Factors ... 155 5.3.5 Organization Factors ... 157
5.3.6 Final Model Weights ... 159
5.4INCONSISTENCY AND DISAGREEMENT ANALYSIS ... 161
5.5VALUE CURVES ... 163
5.5.1 People Factors ... 165
5.5.2 Technology Factors ... 168
5.5.4 Organization Factors ... 174
CHAPTER 6: CASE STUDY ... 177
6.1SMART CITY PDX ... 177
6.2CASE STUDY SMART-CITY RELATED BIG DATA PROJECTS ... 178
6.2.1 Proj1: Traffic Safety Sensor Project (IQ Center) ... 178
6.2.2 Proj2: Air Quality Sensor Testing & Deployment ... 179
6.2.3 Proj3: Connected Streetcar Project ... 179
6.2.4 Proj4: Pollution Prevention Technical Assistance for Idle Reduction and Electrification of Refrigerated Transport ... 180
CHAPTER 7: ANALYSIS OF CASE AND SENSITIVITY ANALYSIS ... 182
7.1CITY’S INDEX OF READINESS TO CONDUCT A SMART-CITY-RELATED BIG DATA PROJECT TECHNOLOGY FOR CASE STUDY ... 182
7.1.1 Readiness Score ... 183
7.1.2 Strengths and Weaknesses ... 187
7.2SCENARIO ANALYSIS ... 193
7.3WHAT CAN BE DONE TO IMPROVE READINESS SCORE (AND INCREASE THE POTENTIAL FOR SUCCESSFUL BIG DATA PROJECT)? ... 202
CHAPTER 8: RESEARCH VALIDITY ... 211
8.1CONSTRUCT VALIDITY ... 211
8.2CONTENT VALIDITY ... 212
8.3CRITERION VALIDITY ... 213
8.4GENERALIZABILITY ... 214
CHAPTER 9: DISCUSSION ... 215
9.1PRACTICAL APPLICATION:GENERAL ... 215
9.2PRACTICAL APPLICATION:PEOPLE PERSPECTIVE ... 217
9.3PRACTICAL APPLICATION:TECHNOLOGY PERSPECTIVE ... 218
9.4PRACTICAL APPLICATION:LEGAL PERSPECTIVE ... 218
9.5PRACTICAL APPLICATION:ORGANIZATION PERSPECTIVE ... 219
9.6CAN THE MODEL BE USED FOR OTHER SECTORS? ... 220
CHAPTER 10: CONCLUSIONS ... 222
10.1CONCLUSIONS AND CONTRIBUTIONS ... 222
10.1.1 Research Gaps and Questions ... 223
10.1.2 Research Implications ... 224
10.2LIMITATIONS ... 225
10.3FUTURE WORK ... 227
REFERENCES ... 228
APPENDIX B: QUALTRICS SURVEYS TO EVALUATE AND QUANTIFY THE MODEL ... 261 APPENDIX C: HDM SOFTWARE TOOL ... 301 APPENDIX D: R PACKAGE FOR BIBLIOMETRIC AND SNA ANALYSIS ... 304
LIST OF TABLES
TABLE 1.COMPARISON OF BIG DATA AND BIG ITPROJECT CHALLENGES ... 49
TABLE 2.MATRIX A ... 59
TABLE 3.MATRIX B ... 59
TABLE 4.MATRIX C ... 60
TABLE 5.POTENTIAL DECISION-MAKING METHODS COMPARISON ... 98
TABLE 6.EXPERT PANELS ... 112
TABLE 7.EXPERTS BACKGROUNDS FOR EACH PANEL ... 118
TABLE 8.PERSPECTIVES OF FACTORS AFFECTING SMART-CITY-RELATED BIG DATA PROJECTS ... 123
TABLE 9.CRITICAL FACTORS AFFECTING SMART-CITY-RELATED BIG DATA PROJECTS .. 124
TABLE 10.LIST OF EXPERTS ... 128
TABLE 11.PERSPECTIVES VALIDATION SUMMARY BY P1PANEL. ... 135
TABLE 12.PERSPECTIVES DETAILED VALIDATION BY P1PANEL. ... 135
TABLE 13.PEOPLE-RELATED FACTORS VALIDATION SUMMARY BY P2PANEL. ... 136
TABLE 14.PEOPLE-RELATED FACTORS DETAILED VALIDATION BY P2PANEL. ... 136
TABLE 15.TECHNOLOGY-RELATED FACTORS VALIDATION SUMMARY BY P3PANEL. .... 138
TABLE 16.TECHNOLOGY-RELATED FACTORS DETAILED VALIDATION BY P3PANEL. ... 138
TABLE 17.LEGAL-RELATED FACTORS VALIDATION SUMMARY BY P4PANEL. ... 140
TABLE 18.LEGAL-RELATED FACTORS DETAILED VALIDATION BY P4PANEL. ... 140
TABLE 19.ORGANIZATION-RELATED FACTORS VALIDATION SUMMARY BY P5PANEL. .. 142
TABLE 20.ORGANIZATION-RELATED FACTORS DETAILED VALIDATION BY P5PANEL. .. 142
TABLE 21.CHANGES VALIDATION SUMMARY BY P6PANEL. ... 146
TABLE 22.CHANGES DETAILED VALIDATION BY P6PANEL. ... 146
TABLE 23.PERSPECTIVES RELATIVE DETAILS ... 149
TABLE 24.PEOPLE RELATED FACTORS WEIGHTS -DETAILS ... 151
TABLE 25.TECHNOLOGY RELATED FACTORS WEIGHTS -DETAILS ... 153
TABLE 26.LEGAL RELATED FACTORS WEIGHTS -DETAILS ... 155
TABLE 27.ORGANIZATION RELATED FACTORS WEIGHTS -DETAILS ... 157
TABLE 28.HDMMODEL FINAL WEIGHTS ... 159
TABLE 29.DESIRABILITY CURVE MATRIX ... 163
TABLE 30.PEOPLE RELATED FACTORS DESIRABILITY CURVES ... 165
TABLE 31.TECHNOLOGY RELATED FACTORS DESIRABILITY CURVES ... 168
TABLE 32.LEGAL RELATED FACTORS DESIRABILITY CURVES ... 171
TABLE 33.ORGANIZATION RELATED FACTORS DESIRABILITY CURVES ... 174
TABLE 34.PROJ1READINESS ASSESSMENT SCORE ... 183
TABLE 35.PROJ2READINESS ASSESSMENT SCORE ... 184
TABLE 36.PROJ3READINESS ASSESSMENT SCORE ... 185
TABLE 37.PROJ4READINESS ASSESSMENT SCORE ... 186
TABLE 38. STRENGTHS AND WEAKNESSES FOR EACH SCENARIO ... 187
TABLE 39.FUTURE SCENARIOS ... 193
TABLE 41.SCENARIO II:TECHNOLOGY EMPHASIS ... 196
TABLE 42.SCENARIO III:LEGAL EMPHASIS ... 198
TABLE 43.SCENARIO IV:ORGANIZATION EMPHASIS ... 200
TABLE 44.PROJ1 SUGGESTED ENHANCEMENTS ... 204
TABLE 45.PROJ2 SUGGESTED ENHANCEMENTS ... 205
TABLE 46.PROJ3 SUGGESTED ENHANCEMENTS ... 207
TABLE 47.PROJ4 SUGGESTED ENHANCEMENTS ... 209
TABLE 48.HOW THE RESEARCH ADDRESSED THE GAPS ... 224
LIST OF FIGURES
FIGURE 1.BIG DATA VARIOUS COMPONENTS ... 6
FIGURE 2.PROJECT RESEARCH FOCUS ... 7
FIGURE 3.BIG DATA AS A PROCESS ... 13
FIGURE 4.BIG DATA ANALYTICS ... 14
FIGURE 5A.WEB OF SCIENCE SEARCH RESULTS FOR THE KEY WORDS: BIG DATA ... 32
FIGURE 5B.WEB OF SCIENCE SEARCH RESULTS FOR THE KEY WORDS: BIG DATA CHALLENGE ... 32
FIGURE 5C.WEB OF SCIENCE SEARCH RESULTS FOR THE KEY WORDS: BIG DATA ADOPT . 33 FIGURE 5D.WEB OF SCIENCE SEARCH RESULTS FOR THE KEY WORDS: BIG DATA EVALUATE READINESS ... 33
FIGURE 5E.WEB OF SCIENCE SEARCH RESULTS FOR THE KEY WORDS: BIG DATA ASSESSMENT READINESS ... 33
FIGURE 6.RESEARCH GAPS,GOAL, AND QUESTIONS ... 56
FIGURE 7.EXAMPLE OF MOGSA(KOCAOGLU 1983) ... 57
FIGURE 8.CONCEPTUAL HDMMODEL DESIGN (ESTEP 2017;GIBSON 2016;ABOTAH 2014; PHAN 2013) ... 58
FIGURE 9.PAIRWISE COMPARISON ... 70
FIGURE 10.CONCEPTUAL HDMMODEL WITH DESIRABILITY CURVES ... 87
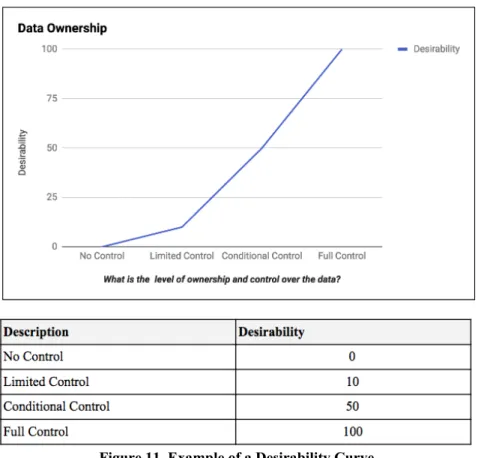
FIGURE 11.EXAMPLE OF A DESIRABILITY CURVE ... 88
FIGURE 12.VALUE CURVES USAGE ... 92
FIGURE 13.CONCEPTUAL HDMMODEL WITH DESIRABILITY CURVES ... 93
FIGURE 14.RESEARCH PHASES ... 104
FIGURE 15. RESEARCH APPROACH DESIGN ... 106
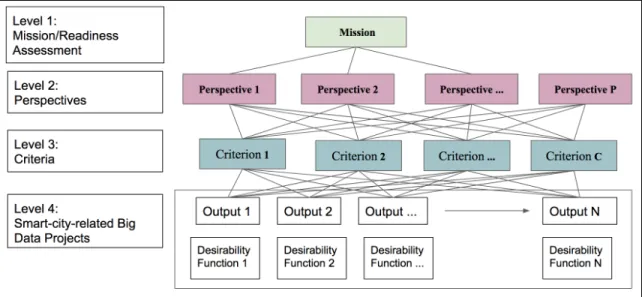
FIGURE 16.HDMMODEL FOR CITY’S READINESS ASSESSMENT FOR A SMART-CITY -RELATED BIG DATA PROJECT ... 107
FIGURE 17.MODEL VALIDATION ... 107
FIGURE 18.MODEL QUANTIFICATION ... 108
FIGURE 19.MODEL ANALYSIS ... 109
FIGURE 20.IDENTIFYING EXPERTS PROCESS (GARCES ET AL.2017) ... 121
FIGURE 21.EXPERTS BY SECTOR ... 132
FIGURE 22.EXPERTS BY TYPE (THE SAME EXPERT CAN HAVE MULTIPLE TYPES) ... 132
FIGURE 23.THE FINAL HDMMODEL ... 147
FIGURE 24.PERSPECTIVES RELATIVE WEIGHTS ... 149
FIGURE 25.PEOPLE RELATED FACTORS WEIGHTS ... 151
FIGURE 26.TECHNOLOGY RELATED FACTORS WEIGHTS ... 153
FIGURE 27.LEGAL RELATED FACTORS WEIGHTS ... 155
FIGURE 28.ORGANIZATION RELATED FACTORS WEIGHTS ... 157
FIGURE 29.FACTORS THAT HAVE CRITICAL IMPACT ON SMART-CITY-RELATED BIG DATA PROJECTS ... 160
FIGURE 30.CONTINUOUS READINESS ASSESSMENT APPROACH ... 203
CHAPTER 1: INTRODUCTION
Data is being generated about almost everything around us in an unprecedented exponential rate. According to IBM (2017), in 2017, 90% of the data in the world has been generated in the last two years, with 2.5 quintillion (1018) bytes of data generated
every day. This massive influx of data is being fueled by the accelerated advances in information and communication technologies that affected every aspect of the modern, quick-paced life. For example, in 2018, every minute, the internet users did 3,877,140 searches using Google, posted 473,400 tweets on Twitter, shared 2,083,333 photos on Snapshot, and watched 4,333,560 videos on YouTube, to name a few examples (James, 2018).
We are struggling to catch up and make sense of this phenomenon, as data being generated in continuously-increasing volume, velocity, and variety, making it beyond our capability to catch up and make sense of (Ransbotham and Kiron 2017; McAfee et al. 2012). Hence, big data emerged, a field in the information technology sector, in response to this phenomenon; to offer ways to understand and make use of this data.
Big data offers a viable way to understand the modern world and to transform this influx of data into usable information and insights that allow for better decision making, and in the case of businesses, to achieve competitive advantage over competitors. Big data promises to provide the means to help making the right decision at the right time based on faster, more accurate, more efficient, and more effective aggregation and analysis of comprehensive internal and external sources of data, in ways that are
unparalleled in human history (Barham 2017; Ransbotham and Kiron 2017; McAfee et al. 2012; LaValle 2011).
According to Gartner Inc., big data is one of the leading IT technologies in recent years (Cearley 2016). It is now part of decision making in all aspects of business, on the strategic, operational, and business processes levels. Big data is being utilized in
commercial, industrial, social, governmental, and academic sectors. Some of the sectors where big data is thriving include healthcare, banking, government, and municipal planning and management, manufacturing, telecommunication, academic research like sociology and psychology, and marketing, just to name few (Ransbotham and Kiron 2018; Ethirajan et al. 2017; Rosculet et L. 2017; Wang et al. 2017; Etzion and Aragon-Correa 2016; Groves 2016; Chen and Zhang 2014; Burrows and Savage 2014; Kitchin 2014; Walker 2014; Sagiroglu and Sinanc. 2013; Boyd and Crawford 2012).
In addition, a NewVantage survey of the fortune 1000 firms found that 92% of those firms are increasing their spending on big data analytics in 2019, also the survey found that 55% of firms are spending over $50M on resources related to big data and AI (NewVantage Partners 2019). Furthermore, a survey by MIT Sloan Management Review, with thousands of participants from several sectors, sizes, and location, found out that 55% of the surveyed firms are using insights from big data to make decisions, 49% are “analytical Practitioners”, and 17% are “Analytical Innovators” (Ransbotham and Kiron 2017). Another survey by Harvard Business Review of the fortune 1000 firms’ CEOs found that: 70% of the CEOs reported that big data is of critical importance to their firms and 63% of the firms reported having Big Data in production (Bean 2016).
1.1 Problem Statement
The literature review has much evidence of the businesses value of big data, and how big data creates a competitive advantage for organizations against competitors (refer to section 2.1 for more details). However, studies indicate that more than half of big data projects fail, conservative studies indicate that 50% of big data projects fail, up to 85% by other studies (NewVantage Partners 2019; NewVantage Partners 2017; Ransbotham and Kiron 2017; Walker 2017; Iron Mountain 2015). A big data project fails when it never finishes or does not generate the expected outcome. In addition, in a recent survey of the fortune 1000 firms, 77% of respondents indicated that they are facing challenges in adopting big data (NewVantage Partners 2019).
The failure of such projects has a serious impact on the organization, as big data projects are generally expensive and require dedicating core organization’s resources to implement, not to mention the disadvantage against competitors who have successfully implemented big data into their organizations (NewVantage Partners 2019; Adrian et al. 2017; NewVantage Partners 2017; Bean 2016; Iron Mountain 2015; Winter et al. 2013). In fact, a recent survey indicated that 78% of the respondents indicated that they fear disruption or displacement due to competitors and new entrants being more successful in using big data (Davenport and Bean 2018).
The reasons behind this high percentage of failure were the subject of many studies in the past few years (Barham 2017; NewVantage Partners 2017; Ransbotham and
Kiron 2017; Bean 2016; Saltz and Shamshurin 2016; Buckley 2015; Iron Mountain 2015; Marr 2015b; McAfee et al. 2012).
Big data projects are considered large-scale IT projects (Chen et al. 2014;
Martinez 1994) (please refer to section 2.7). The same consequences of a big data project failure also apply to any large-scale IT project. In addition, some reasons for failure and counter measurement of any big IT project fit for big data projects. However, literature clearly indicates that big data projects have many unique challenges (for example, the shortage of data scientists and the lack of data strategies), as well as, challenges that are, while common to most big IT projects, are more impactful when it comes to big data projects (for example, data integration complexities and data privacy issues). Therefore, realizing big data projects specific nature while addressing its challenges would lead to solutions that are more effective.
Consequently, before organizations implement big data projects to move to the big data analytics era, they need to make sure that the chances of success of such projects are reasonably high. Since the consequences of failure are severe and include financial loss due to the cost of the projects itself and the waste of resources time, usually the best personnel in the organization, that would be allocated to work on those projects.
Therefore, there is a need for a model that can help organizations to be more confident and readier before initiating a big data project, and such a model should be able to:
• Identifies potential common factors that have a significant impact on the success or failure of big data projects.
• Assesses the organization’s readiness against each of those factors.
• Points where corrective/preventive actions are needed, based on the assessment, before starting the project.
1.1.1 My Research Focus
As big data applications have expanded over many sectors and industries,
building a general model that can fit all kinds of big data projects, while doable, will need years of testing and validation. So, it is more practical to build a model that is directed at a specific sector that can be generalized later on. Hence, the focus of this research is on developing a model that addresses one sector, where big data plays an important role, and where the challenges as mentioned earlier are clearly evident. The sector this research is focusing on is smart cities. As cities trying to adopt smart city initiatives, face the same consequences when smart city-related big data projects fail. The financial cost could be high against their tight budgets, the city will have to assign its best people to work on the project, sometimes for years, and cities with failed big data projects will be less attractive than other cities that leverages big data to become smart and offer better quality of life to its citizens (Al Nuaimi et al. 2015; Neirotti 2014).
Based on the above discussion, my research will aim to identify the main
challenges that could cause smart-city-related big data projects to fail. Big data projects, in this research context, refers to projects that aim at creating or enhancing the city’s big data analytical capabilities to support a smart city initiative. In this kind of project, the outcome is an information management system that will acquire data from various resources (internal, external, structured, and unstructured), cleanse it, reformat it,
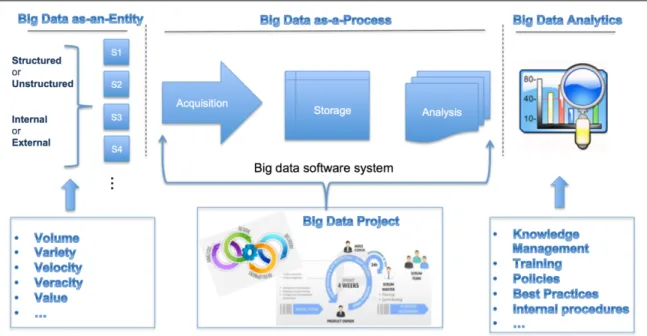
aggregate it, and store it, as well as, building analytical tools to offer insights based on the acquired data, see Figure 1.
Figure 1. Big Data Various Components
More specifically, in this research the focus will be on:
● Identifying the critical issues that are key factors in influencing a smart-city-related big data project, to be a success or a failure, based on literature review and experts’ judgment.
● Developing a model that can be used to assess a city’s readiness against these issues, by using the HDM methodology and expert panels.
● Validating and quantifying the model, with the help of subject-matter experts, to make sure the model is reliable and vigor.
● Finally, testing the model in a real situation, by working with the City of Portland regarding the city’s smart-city initiative related to big data projects. My approach to testing the model will be two folds:
○ First, sharing the model with the City of Portland personnel supervising the smart city initiative and get their feedback on what value this model present for them.
○ Second, if possible, evaluating past projects under the model, and compare the model evaluation with what really happened in those projects, to find out how aligned the model is with real scenarios.
This research will allow project managers and cities to better understand their ability to conduct big data projects. Hence, allowing for better preparing for the upcoming project and higher chances of successful implementation, see Figure 2.
Figure 2. Project Research Focus
In the following sections, first, in Chapter 2 an in-depth literature review is
offered, that covers the background of the subject, the gap, and the gap’s importance. The literature review includes: what is big data and why it is important, what is smart city, big data as part of smart city, intelligent transportation systems (ITS) as an application of big data under smart cities, what is readiness assessment, what is a big data project, and finally what are the main factors that can contribute to making a big data project a success or a failure, as identified in literature. Then, in Chapter 3, the research gaps, objective, and questions are presented, as well as, the methodology that this research used to answer the research questions to achieve the research goal, which is the HDM
methodology. The HDM methodology was used to build a model that can be used by cities, planning to implement a smart-city-related big data project. The model will structurally and thoroughly assesses and determines the city’s readiness to implement a big data project and will identify areas of concern that might cause the upcoming project to fail, in order to take preventive actions toward those issues before starting the project.
Moreover, Chapter 4 provides the research design that was used to achieve the research goals. Furthermore, Chapter 5, presents the data gathering phase, based on the design explained in Chapter 4. Chapter 5 includes expert panels formation, model validation and quantification by experts and the analysis of experts’ reliability.
In addition, Chapter 6 and Chapter 7 covers the case study, that was used to demonstrate the model. The City of Portland, OR was used as a case study, since this city is currently one of the leading cities in the USA in regards of smart city initiatives.
Finally, Chapters 8, 9, and 10 go through a discussion of the results of the
research and its validity, as well as, how this research outcome is beneficial and what are its academic contribution to the body of knowledge.
CHAPTER 2: LITERATURE REVIEW 2.1 Big Data
2.1.1 Definition
The roots of big data can be traced back to the late 1980s when the term business intelligence became known. According to Davenport (2006), “business intelligence ... encompasses a wide array of processes and software used to collect, analyze, and disseminate data, all in the interests of better decision making.” Also, as more advances were achieved in computer hardware capabilities and capacity, telecommunications, and data storage and mining, the term business analytics emerged in the 2000s, where software tools start doing more complex operations including predictive analysis and future planning (Bartlett 2013). Leading to the emerging of the big data term in the late 2000s, were far huge influx of datasets of different sources and structures, or no structure for that matter, are now being aggregated, processed, and analyzed, using far more complex processes and techniques, to achieve better decision making (Ransbotham 2016; Chen et al. 2012; McAfee et al. 2012). In fact; Mayer-schönberger and Cukier (2014) argue that big data is making a shift in the way we analyze phenomena, as big data scan and process all the data related to a phenomenon from multiple sources, instead of just samples, and also deals with types of data that are not readily accessible for current methods of analysis, like social media content for example, that has no clear structure and has a sentimental value in the same time, allowing for new ways of analysis based on correlation rather than causation.
The literature review of academia, business, and IT vendors publications revealed that there are several definitions of big data. Most of the definitions fall under one of the following categories: big data as an entity, big data as a process, and big data analytics (Barham 2017;Ransbotham and Kiron 2017; Bean 2016; IBM 2016b; Oracle 2016; Rajaraman 2016; Tsai et al. 2016; Marr 2015b; Narayanan 2014; Stubbs 2014; Arthur 2013; Chen et al. 2012; Dumbill 2012; Parise et al. 2012; LaValle et al. 2011; Laney 2001). Following is an overview of each category:
Big data as an entity: Refers todata that cannot be handled (i.e., capturing, storing, and handling) by traditional analytical approaches, due to its volume, velocity, and variety, or what Lany called the 3V’s (2001). Over the years, more V’s were introduced and become widely accepted, including veracity, and value. Following is a review of the most
common V’s (Bean 2016; Tsai et al. 2016; Marr 2015b; Zikopoulos and Eaton 2012; Laney 2001):
● Volume: is the most known attribute of big data, it is referring to the massive amount of the data being generated and is relevant to any subject, organization, or individual being analyzed. It is worth mentioning here that data coming from unstructured sources such as social media, internet logs, and internet-of-things devices are far more tremendous than data coming from traditional structured sources such as an ERP system.
● Velocity: The rate of receiving the data and when we need to act upon it. ● Variety: data about any subject, organization, or individual is now being
from sources like social media, web behavior logs, and internet-of-things (IoT) devices. The challenge is how to understand data meaning and correctly identify related metadata, as well as, how to integrate and aggregate data coming from different sources.
● Veracity: How reliable the data is, especially data coming from sources like social media or Wikipedia, where anybody could post anything without much validation or review, making such sources, in many cases, generators of fake facts and news. ● Value: Data has an intrinsic value embedded in it. The challenge is how to reveal
such value and build on it to offer the right information to decision makers. There are several stages under big data to extract value from data including discover, ingest, process, persist, integrate, analyze, and expose.
● More V’s: According to Firican (2017) other V’s are introduced, representing more detailed focus areas under the original V’s, including visualization, variability, validity, vulnerability, volatility,
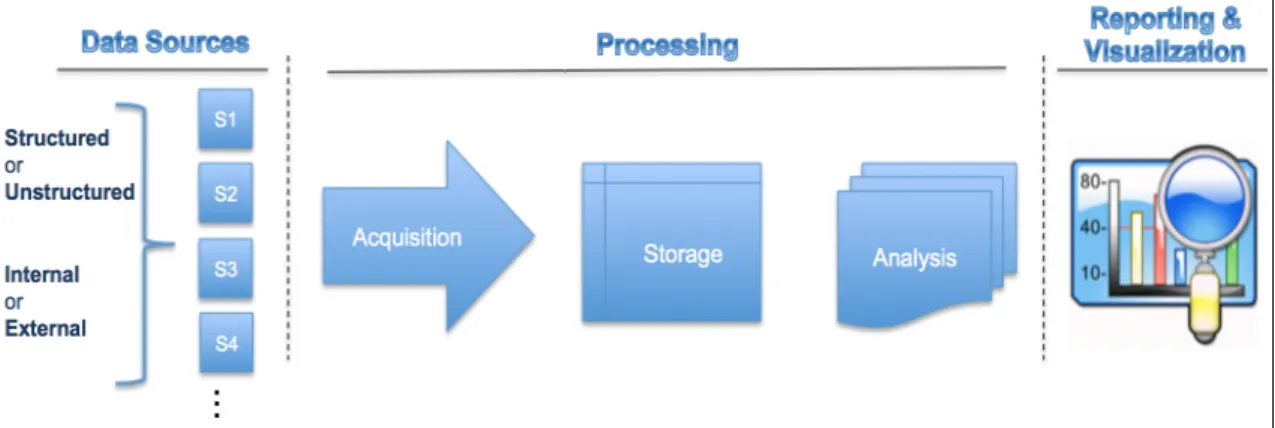
Big data as a process: To make the right decision, the decision maker needs the right information at the right time. Organizations collect/generate data from various sources, they collect more than what they know about or can process. So, big data aim is to take a holistic information management approach to consume and integrate data, whether the data is structured (e.g., transactional records) or unstructured (e.g., social media and web behaviors) from multiple internal and external sources. Then, identifies relations among them, and creates insights that allow for sophisticated analysis and future predictions, which ultimately will result in higher probability of making the right decision, and hence
leapfrog competitors and lead the market, Figure 3 demonstrates the workflow of data in a typical big data system (Shapiro 2018; Barham 2017;Bean 2016; Erevelles 2016; García et al. 2016; IBM 2016b; Oracle 2016; Stubbs 2014; LaValle et al. 2011).
Figure 3. Big Data as a Process
Big-data-as-a-process offers viable ways to handle big-data-as-an-entity, by leveraging on advances in scaling-up technologies, that can orchestrate a cluster of inexpensive processors to work in parallel to perform the extracting, processing, and analyzing tasks, as well as, to store the data in distributed storage units using formats that can handle unstructured data properly. There are many technologies behind Big-data-as-a-process, examples include Apache Hadoop, MapReduce, NoSQL, Apache HDSF, in-memory database and so on (Rajaraman 2016; Chen and Zhang 2014; Zikopoulos and Eaton 2012).
Big data analytics: Big data analytics is the modern advanced version of business intelligence (BI), it offers the ability to apply advanced analytical techniques on big data (data that has massive volume, being generated frequently, and comes from various sources). Big data analytics shift the analysis focus from hindsight-analysis of what
already happened (for example, last year sales statistics), and insight-analysis of why it happened (for example, why are we losing sales), towards a more advanced foresight-analysis of what will happen next and how can we benefit from it (for example, how can we leverage future events to generate more revenue in coming years) as illustrated in Figure 4. However, this is not a linear path; trying to become more analytically advanced and moving from hindsight to foresight is very difficult and few organizations were able to achieve that (Ransbotham and Kiron 2017; Sivarajah et al. 2017; Suthaharan 2016; Tsai et al. 2016; Niemeijer 2014; LaValle et al. 2011; Russom 2011).
Figure 4. Big Data Analytics
According to a study conducted by LaValle et al. (2011), organizations can be classified, based on the level of big data maturity and the use of analytics in making decisions, into three categories:
Aspirational: Organizations in this category have minimum big data adoption, and their information technology focus is more on automation and efficiency.
Experienced: Organizations in this category have already achieved automation and have efficient processes in place, and now they are going beyond the use of information
technology to aid operations, by injecting some analytics processes and tools to aid in making some decisions.
Transformed: Organizations in this category have implemented analytical processes and tools to support most of the decisions making processes in the organization, on the strategic and operational levels.
The same study found out that transformed organizations are three times more likely to outperform competitors than aspirational organizations.
2.1.2 Big Data Benefits and Value
A report by Data Science (Swanson 2017) indicated that organizations, which adopted big data, has seen 41% improved customer experience, and 38% better business decisions. Furthermore, A recent report by Harvard Business Review (Bock 2017) indicated that organizations with advanced big data and data analytics capabilities, called “Digital Leaders” by the report, are 2.6x more likely to prescribe business actions to limit customer churn, are 1.5x more likely to optimize production runs based on demand forecast, and are 2.3x more likely to inform product design by capturing data on how their products are used in comparison to competition. Moreover, another study by Keystone Strategy (Iansiti and Lakhani 2016) showed that organizations that utilize big data analytics have 18% higher gross margins 4% higher operating margins than competitors.
There is a lot of discussion in the literature about how big data can generate benefits for organizations against competitors, and this section summaries the main points that many literature references agreed on (Barham 2017; Bock et al. 2017; Ransbotham
and Kiron 2017; Flood et al. 2016; Lim 2015; Tan et al. 2015; Nasser and Tariq 2015; Columbus 2014; Guangting and Junxuan 2014; Prescott 2014; Bell and Zaric 2013; McAfee et al. 2012; McGuire et al. 2012).
Mainly, big data enables effective data analytics by aggregating data from various internal and external sources, and then it applies data analytics to it to discover relations and hidden information, that otherwise would not be found, this will allow for many benefits, including:
● First and foremost, increasing decision maker’s chances of making the right decision at the right time. For example, in a commodity market like personal hygiene, big data can get and analyze consumers’ behavior and feedback momentary, allowing the organization to make small changes to its products, as soon as possible, and before competitors realize that there is a shift in the market or new need, which is usually a small window in such markets. Another example, in the aviation sector, an airline can use big data to look for historical destinations demand, current economic status, weather forecasts, and social media feedback to predict which destinations are expected to be more utilized in the near future, and hence, run more trips or use bigger planes for those destinations. Also, big data can allow consumers to make better decisions; for example, a patient can compare the efficiency of alternative drugs that treat her illness, not just in general, but also, for patients who are similar to her age, race, and gender, among other factors.
● Doing better risk management: By running robust and quick future predictive scenario analysis. For example, an oil company can use big data to generate future scenarios depending on current production rates, market demand, historical price trends, and other factors, to predict future oil prices for better budget and financial forecasting.
● More accurately identifying narrow market segments and niches: Which will allow for quicker response to such market’s needs. For example, big data could reveal that senior citizens in a particular city, spend more time in their backyards planting vegetables, instead of the general flowers trend common in other cities, and hence correctly targeting this market segment needs.
● Better follow up and monitor of products: Big data can tell organizations immediately about defects and new uses of their products, as soon as that happened in the market. For example, a pharmaceutical company could use big data to analyze the feedback on a recently launched drug and find out new side effects, bad or good, that were not known at the pre-launch trials.
● Detecting frauds and act on it immediately: For example, banks can use big data to detect transactions abnormality that might be a result of stolen bank accounts, or better analyze loans risks and hence make better lending decisions.
● More efficient production processes: Big data can pinpoint where waste is being generated, delays are happening, or high costs are incurred in a production process, allowing management to address those areas and increase the production efficiency. For example, a giant manufacturer with multi factories in several countries can find in real time, which factory is generating more cost, which part of its process in all factories generates more waste, and which raw materials cost more in each country where the factories are.
2.2 Smart City
Urban areas are changing due to the unprecedented advances in information and communication technology applications used within those areas. Such applications are used to automate services related to city planning and management, infrastructure, and people, with the focus on improving services offered by cities, quality of life for citizens,
and cities resiliency against urban changes (Castelnovo et al. 2016; Meijer and Bolivar 2013; Batty et al. 2012).
2.2.1 Definition
The term smart city is fuzzy and has several definitions in the literature. Most definitions focus on features and dimensions or perspectives and aspects (Castelnovo et al. 2016; Al Nuaimi et al. 2015; Meijer and Bolivar 2013; Batty et al. 2012; Tranos and Gertner 2012). A concise but comprehensive definition of smart-city by Harrison et al. (2010, 1) is: “connecting the physical infrastructure, the IT infrastructure, the social infrastructure, and the business infrastructure to leverage the collective intelligence of the city.” Another definition by Caragliu et al. (2011:70) is: ‘... [A] city to be smart when investments in human and social capital and traditional (transport) and modern (ICT) communication infrastructure fuel sustainable economic growth and a high quality of life, with a wise management of natural resources, through participatory governance.’
Across the globe, cities are adopting smart-city initiatives, to achieve several goals. These goals include, enhancing the quality of life for the city’s citizens and
visitors, increase the efficiency of infrastructure usage, making city’s essential resources, like water, electricity, and mobility infrastructure more sustainable for future generations, making city’s services more equitable, and to have more resilience by being able to quickly identify emerging problems within the city, and respond to them effectively (Belanche 2016; Puiu 2016; Al Nuaimi et al. 2015; Batty et al. 2012; Caragliu 2011). However, smart city initiatives face the same challenges mentioned in “2.6 Big Data Adoption Challenges” section, as well as, other challenges like the need to update
regulations and policies to enable smart-city, and the infrastructure investment high cost to enable and maintain many of the crucial smart city components (Al Nuaimi et al. 2015; Kramers et al. 2015; Neirotti 2014).
According to Batty et al. (2012), cities can be smart by leveraging on the massive amount of operational data being generated from city infrastructure, by urban
applications of technology and communications. This data to be further used by cities to monitor, understand, analyze, and plan for the services offered by the city, to make the services more efficient and effective, while offering better equity and quality of life for the city citizens. Furthermore, it is common for cities to have data from its infrastructure that is being generated by separated technologies, as each of those technologies is focused on the particular area of infrastructure it serves. So, in a smart-city, this data can be integrated and combined to address big-picture issues across all sectors within the city (Batty et al. 2014; Caragliu 2011; Harrison et al. 2010).
To achieve these goals, smart city initiatives aim at integrating the city’s infrastructure data to be more effective in offering insights that can allow decision makers to make better decisions that can enhance the quality of life of citizens while making optimal use of the city’s infrastructure. As well as, to identify emerging problems early, or before they even become problems, and proactively address them (Batty 2013).
2.2.2 Smart-City Categories
Smart city initiatives cover several areas of interest, or categories, in urban setups including infrastructure, people, and planning and management. By leveraging insights from related collected and integrated data, following is an overview of the city main
challenges under those categories that smart-city initiatives are targeting: (Chowdhury and Dey 2016; Fitzgerald 2016; Al Nuaimi et al. 2015; Schuurman et al. 2012;
Dimitrakopoulos and Demestichas 2010; Harrison et al. 2010)
Infrastructure: Addressing transportation traffic jams, shortage of parking lots, and time-wastage on the road, also, the related environmental impact of vehicles spending more time on the road due to those issues. As well as, creating an efficient, clean, cheap, sustainable, and steady stream of energy and water.
People: Offering cheap, high quality, and individually customized health care, education, and social programs for the city’s citizens while maintaining equity and more effectively addressing the needs of the underserved neighborhoods.
Planning and Management: Smart city aim to leverage data to improve government administration, city planning and operations, buildings, and public safety.
2.2.3 Smart-City and Big Data
Big data is in the heart of what makes smart cities truly smart cities (Lim et al. 2018); big data is used to enhance the infrastructure operation management by analyzing data to offer better insights and understanding of those operations. For example, using traffic data, from sensors and vehicle tracking devices, to analyze traffic demand that can be used for optimal configuration of traffic lights. Moreover, big data can be used to address the city’s challenges. For example, reducing crime rates by taking proactive measures, through analyzing crime patterns and locations to predict future crime locations, and hence, more efficient allocation of policing resources in those locations. Another example is intelligent navigation, by utilizing feedback from traffic sensors,
navigation application like google maps (trip time by others who previously went to the same destination at the same time of the day), weather data, reported accidents, public transit data, and so on, to determine the best route to reach the required destination. Fleet management is another example, where IoT devices attached to trucks can generate detailed data about trips that can be used to influence driver’s behavior, for more efficient use of fleet trucks. Furthermore, big data allows for the customization of services to address individual needs. For example, people who have certain respiratory conditions can get alerts, on the spot, when certain areas of the city have dangerous levels of
pollution (Lim et al. 2018; Hashem 2016; Maglio and Lim 2016; Puiu 2016; Al Nuaimi et al. 2015; Kitchin 2014; Batty 2013; Khan et al. 2013).
Many big data-based solutions that are already implemented or actively being developed to enable smart-city. Examples include smart grid, intelligent transportation systems, smart education, smart healthcare systems, and smart safety systems, to name few (Lim et al. 2018; Hashem 2016; Maglio and Lim 2016; Puiu 2016).
2.3 Intelligent Transportation Systems
Intelligent transportation systems (ITS) is a growing technology sector as part of smart cities. According to some industry analysts, it is expanding at a 13% rate annually and is expected to reach $47.5 billion by 2020 (Global Market Insights 2016). ITS is becoming popular as it holds the promise of solving key modern traffic challenges, including safety, congestions, and pollution by leveraging on advancements in information and communications technologies (Moral-Munoz 2016; Lim et al. 2015; Dimitrakopoulos and Demestichas 2010).
The demand for transportation is continuously increasing due to increased human population and the accompanying mobility needs, which is further fueled by
transportation becoming more affordable in recent decades. In the same time, the
expansion of transportation infrastructure to meet this demand is not sufficient as adding more infrastructure capacity is expensive and requires time. This led to several problems, including increased traffic incidents, time wastage on the road, pollution, and economic losses. In the United States, for example, there are more than 6 million traffic accidents annually, including fatality accidents that kill more than 30 thousand people (DOT 2016). Also, every year, time wastage due to road congestion results in 1.9 billion gallons of wasted fuel and more than $100 billion in economic costs, due to time loss and fuel bills. In fact, it is estimated that about 4.8 billion hours are being lost annually on the roads in the United States (FHWA 2017; US Census Bureau 2017; DOT 2016; Thomopoulos and Givoni 2015; Dimitrakopoulos and Demestichas 2010).
2.3.1 Definition
ITS refers to the application of advanced information and communications technology to surface transportation in order to achieve enhanced safety and mobility while reducing the environmental impact of transportation (DOT 2017). ITS is used to manage the traffic and to influence driving decisions and behaviors by utilizing cognitive networking principles and data analytics to creates management mechanisms with
learning capabilities (Chowdhury and Dey 2016; Saito 2016; Dimitrakopoulos and Demestichas 2010).
ITS uses information and communication technologies to collect and analyze the traffic data. Traffic data is broadcasted by sensors and computing capabilities embedded in vehicles and road elements. Also, traffic data are generated from interactions among vehicles and between vehicles and the transportation infrastructure. This data is captured and analyzed by ITS to generate analytics that can be used to manage traffic and advise drivers on better driving decisions (Chowdhury and Dey 2016; Yu 2016; US Government Accountability Office 2015; Joseph et al. 2006; Weiland and Purser 2000).
It is worth mentioning here that wireless communication technologies are the backbone of ITS technologies, ITS significantly benefited from the recent advances in wireless communication technologies since leverage on different types of wireless communication technologies to read and report traffic data, to further enable cooperative systems and dynamic data exchange using a broad range of advanced systems and technologies (Sill 2011).
ITS has several benefits (Asselin-Miller et al. 2017; Alam et al. 2016; Chowdhury and Dey 2016; Yu 2016; US Government Accountability Office 2015; Dar et al. 2010; Dimitrakopoulos and Demestichas 2010):
● Reducing time wastage on the road: ITS helps reduction traffic congestions and commute time wastage by effectively managing the traffic and guiding cars to optimal routes from source to destination based on real-time feedback on traffic and road elements conditions.
● Increasing safety: By minimizing the risk of accidents, or at least, reduce the severity of accidents using technologies like incident management and collision
avoidance. As well as, increasing safety for pedestrians, by adding smart capabilities to vehicles to identify and avoid pedestrians.
● Reduce environment pollution: by helping reducing average traffic time, ITS helps reduce pollution as well, since vehicles will burn less fuel. Furthermore, ITS can create better environmental traffic patterns, for example, by spreading the traffic around the city and make sure vehicles, especially vehicles with diesel engines, are not condensed in certain areas and so on.
● Cost savings: less time on the road means more time to work, less time to reach clients, and of course fewer fuel costs.
● Efficient use of infrastructure: ITS manages traffic to better optimize the utilization of transportation infrastructure, which reduces the need to launch expensive and time-consuming projects to increase traffic capacities in response to increased traffic demands.
2.3.2 Automotive Technologies Under ITS
As explained earlier, ITS is a ubiquitous information and communication system that monitors, collects, and broadcasts data about the vehicle, as well as, connecting and facilitating communications between vehicles, between vehicles and road elements, and between vehicles and the infrastructure, while collecting and broadcasting data about those interactions. The data is then analyzed to create insights that will be used to manage the traffic and help drivers (Cheng 2015).
So, ITS consist of a wide range of technologies, from standard common technologies like ABS systems to complex centralized artificial intelligence systems
capable of machine learning and making decisions based on traffic data to optimize the traffic. Generally, ITS technologies are grouped into three categories: within the vehicle, between vehicles, and between vehicle and infrastructure (Gaffney 2017; Cheng et al. 2015; Linkov 2015; Thomopoulos and Givoni 2015; US Government Accountability Office 2015; Youngmin et al. 2013; Fogue et al. 2012; Rooyen et al. 2011; Coelho and Rouphai 2010; Dimitrakopoulos and Demestichas 2010; Weiland and Purser 2010; Papadimitratos 2009).
● Technologies within the car itself: These technologies help reducing traffic accidents and increasing driving efficiency. Technologies within the car usually serve one or both of the following purposes: offering driving assistance to the driver by providing information about the status of the car, or even help driving the car, e.g., auto parking, also by offering passive safety against road conditions. Examples of commercially available technologies within the car include GPS based navigation, anti-lock braking, collision avoidance, objects detections, and auto braking, rear cross-traffic alerts, blind-spot monitoring, adaptive headlights, drowsiness detection, park assist (automatic, rear cameras, back sensors).
Technologies within the car are the base enablers for the future autonomous driving.
● Vehicle-to-vehicle (V2V) communication technologies: Drivers typically rely on other drivers’ behavior to make many driving decisions. For example, a driver deciding on whether to hit the braking pedal or accelerate the car based on tail brake light and distance of the car immediately ahead. However, this is not
necessarily the best strategy as drivers cannot tell what is going in front of the next vehicle ahead and might not react to emergencies fast enough [26]. V2V technologies address this issue by using sensors feedback to identify and analyze the current situation around the vehicle and then to disseminate safety messages to nearby vehicles by leveraging on vehicular ad-hoc networks (VANETs). So, drivers can respond to emerging situations properly and at the right time. ● Vehicle-to-infrastructure (V2I) communication technologies: technologies that
gather data generated by vehicles and road elements, mainly from sensors, and broadcast it to a central location. Then the data is merged with pre-existing information about the road and is analyzed to draw the big-picture view of the road and its conditions, and generate information and suggestions to drivers in real time. Such information and suggestions could be as simple as notifying drivers about an accident or traffic jam ahead of the road and suggest alternative routes. To more sophisticated directives and behavior, suggestions aim at more efficient use of roads to reduce time on the road, in general, across a city, as well as, to reduce the environmental impact of transportation.
2.4 Readiness Assessment
US Dept. of Health and Human Resources defines readiness assessment as: “Measuring readiness is a systematic analysis of an organization’s ability to undertake a transformational process or change. A readiness assessment identifies the potential challenges that might arise when implementing new procedures, structures, and processes within a current organizational context” (HRSA 2018).
One known method to assess technology readiness, that was developed by NASA in the mid-1970s and was extended in the mid-1990s, is Technology Readiness
Assessment (TRA). TRA identify 9 levels of maturity that R&D programs can use to assess the readiness level of a technology being developed. This method looks for several technology and non-technology factors to determine the maturity level of a technology, and whether it is ready to be transferred to the next step in technology development life cycle (Mankins 1995; Mankins 2009).
It can be seen from HRSA definition of readiness assessment, and other
discussion about technology readiness in literature, that the emphasis is on the concept that there are multiple internal and external challenges or factors affecting the readiness of a technology and must be assessed to identify the maturity and readiness of a
technology (HRSA 2018; Lavoie & Daim 2018; GAO. 2016; DoD 2011; Razmi et al. 2009; Al-Omari and Al-Omari 2006; Snyder-Halpern 2001; Parasuraman 2000). The discussion about readiness in other disciplines also points to assessing current status against internal and external factors to determine readiness level. For example, children readiness to go to school (Maxwell and Clifford 2004). Another example is patient
readiness to be discharged from hospital (Titler and Pettit 1995). Another example is organization readiness for knowledge management (Mohammadi et al. 2009).
Based on the above discussion, readiness assessment within the context of this research points to the process of conducting a systematic analysis of a particular city’s ability to carry a particular smart-city-related big data project, by evaluating that city’s current capabilities against the needs of that project, with reference to a list of internal and external factors that are known to be critical to the success of this type of projects. The ultimate goal is to increase chances of successful smart-city-related big data project implementation, by identifying and properly addressing the sources of weaknesses in the city’s capabilities that otherwise, would most likely hinder the upcoming project.
2.5 Project Management 2.5.1 Definition
Project management is a widespread discipline that gains popularity in recent decades. Project management as a practice has several definitions, one common
definition is by Olsen (1971): “Project Management is the application of a collection of tools and techniques (such as the CPM and matrix organization) to direct the use of diverse resources toward the accomplishment of a unique, complex, one-time task within time, cost and quality constraints. Each task requires a particular mix of these tools and techniques structured to fit the task environment and life cycle (from conception to completion) of the task.” Project Management Institute (PMI), stressed on the temporary and unique nature of projects and identified five process groups under project
management: initiating, planning, executing, monitoring and controlling, and closing. PMI also identified ten knowledge areas that project management draw from integration, scope, time, cost, quality, procurement, human resources, communications, risk
management, and stakeholder management (PMI, 2017). Initially, project management focus was mainly on the triple constraints of scope, time, and cost. However, a gradual interest, in the last two decades, was shifted toward quality, risk, and resources, with an overall focus on how to generate value to the customer, instead of being rigidly
constrained by the triple constraint (Meredith 2017; Schwalbe 2015; Kerzner 2013; Cobb 2011; Atkinson 1999).
2.5.2 Big Data Projects
In this research, the focus is on big data projects. Based on the above definitions, big data projects are projects that aim at creating or enhancing organizational big data analytical capabilities, by building information management systems that will acquire data, cleanse it, reformat it, and store it, such data would be coming from various resources. As well as, building analytical tools to offer insights based on the acquired data.
2.5.3 Readiness Assessment Phase
This research is focusing on the phase between project selection and project management. The project selection process includes identifying potential projects that can support organizational strategic objectives, conducting a feasibility study for each project, and evaluating and prioritizing the projects against the organization’s current projects portfolio and selection criteria. Leading to a selection decision (Kaiser et al. 2015; Rosacker and Olson 2008; Stoemmer 2006).
So, this research is focusing on the phase after the project selection phase and before the initiation phase of project management as illustrated by Figure 1 (in the section “1.1 Problem Statement”). This is an important phase, where there is a need to make sure that the organization is ready to conduct the already-selected project, and if there are any potential “showstoppers,” to deal with them now before starting the actual project.
2.6 Critical Factors Affecting Big Data Projects
According to a recent study by NewVantage Partners (NewVantage Partners 2017), more than 50% of big data projects fail. Many researchers addressed big data projects failure phenomenon. Mainly, investigating the reasons behind big data projects tend to fail. The literature includes research related to what kind of challenges are particular to big data projects and big data adoption within organizations. Many big data projects never completed or did not generate the expected outcome, causing severe impact on the organization; due to the high cost of obtaining and running big data
systems, the time-waste of personnel assigned to work on these projects (usually the best in the organization), and the competitive disadvantage of not having big data analytics, while competitors do. The following references are samples from literature about research done around the challenges of big data (NewVantage Partners 2017;
Ransbotham and Kiron 2017; Saltz and Shamshurin 2016; Ransbotham 2016; Angrave et al. 2016; Bean 2016; Iron Mountain 2015; Thabet and Soomro 2015; Buckley 2015; Nasser and Tariq 2015; Mayer-Schönberger and Cukier 2014; Chen et al. 2014; Katal et al. 2013; Chiolero 2013; McAfee et al. 2012; LaValle 2011).
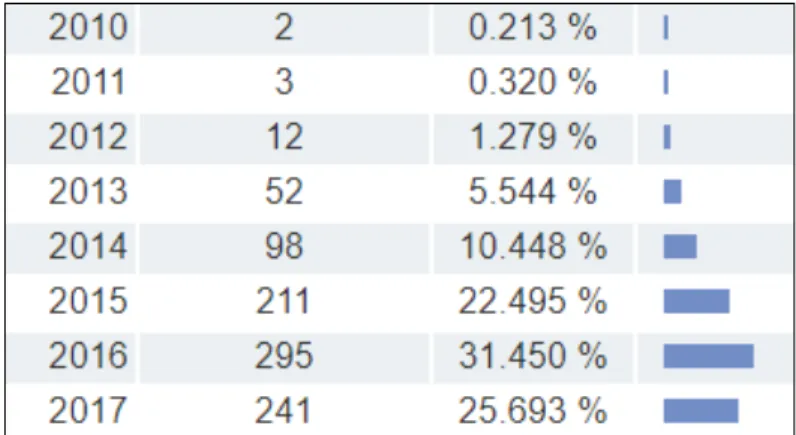
Web of Science engine (https://webofknowledge.com) was used for an overview of literature related to big data. As illustrated by Figure 5a, the Web of Science engine indicated that there is enormous research related to big data in recent years. Furthermore, Web of Science engine search results for the keywords “big data challenge” show that a decent number of big data research is about its challenges, almost 25% in the last three years, as illustrated by Figure 5b. However, most of this research is about challenges that
big data can address, as the number of research related to “big data adopt” is meager in compare, as illustrated by Figure 5c. Moreover, when searching the keywords “big data evaluate readiness,” the results were minimal; it included only ten papers in the last ten years, and the search by the keywords “big data assessment readiness” produced even fewer results, as illustrated by Figure 5d and Figure 5e. Moreover, only two of those papers were indeed related to big data readiness (Klievink et al. 2017; Olama et al. 2014). The rest of the papers were about using big data to evaluate the readiness of other
applications and programs. Google Scholar search with the same keywords did only reveal one extra paper (Lam et al. 2017).
Figure 5a. Web of Science Search Results for the Key Words: big data
Figure 5c. Web of Science Search Results for the Key Words: big data adopt
Figure 5d. Web of Science Search Results for the Key Words: big data evaluate readiness
Figure 5e. Web of Science Search Results for the Key Words: big data assessment readiness
For the papers related to big data readiness evaluation: Klievink et al. (2017) suggested a framework to evaluate public organizations’ big data readiness based on three categories: Organizational capabilities, Organizational alignment, and
organizational maturity. On each of those categories an assessment of 5 points from “1: Very Low” to “5: Very High” was suggested based on assessing the public organization’s current status against a set of big data challenges under each of those categories. Then the
scores are to be aggregated for an overall score between 3 and 15. The authors suggested that this framework can be used to rank public organizations against each other, for benchmarking, as well as, to identify weak areas that need improvements before starting a big data project. In the (Olama et al.2014) paper, the authors focused on the data integration phase of big data (big data as a process). The paper introduced an Integration Level Model (ILM) to measure how mature is the organization and its datasets against various levels of data integration by assessing data governance within the organization. The ILM tool can be used to score nine organizational functions related to data
integration to identify organizational readiness and areas that need improvement. Finally, in the (Lam et al. 2017) paper, the focus was about the relation between front-end users’ small data and the big data of the organization, and how to make sure that the small data generated by front-end users is being effectively captured for the needs of organization’s big data analytics. The authors offered a framework based on absorptive capacity and knowledge management theories, which can be used to assess and enhance the capturing of these small data.
While there is not much literature about big data readiness evaluation or assessment, there is still an enormous amount of research about big data challenges, as illustrated by Figure 5b. Most of this literature can be categorized into the following:
● Surveys: Several papers conducted surveys targeting CEOs and high-ranking executives of organizations from several industries and with varying sizes. Other surveys targeted practitioners from the information technology industry. Surveys main target is to identify the most significant challenges facing big data adoption,
and then offer discussion on how to overcome those challenges. Following are some examples: (Shapiro 2018; Bock et al. 2017; NewVantage Partners 2017; Ransbotham and Kiron 2017; Bean 2016; Flood et al. 2016; Buckley 2015; Burrows and Savage 2014; Chen 2104; Chen and Zhang 2014; LaValle et al. 2010).
● Literature review: Papers in this category investigated the challenges of big data by identifying patterns of challenges discussed in other academic papers, books, and IT vendors’ publications. Some of the papers investigated factors influencing the successful adoption of big data, which complement the challenges discussion. Papers that are based on a literature review usually include discussion and
recommendations about the reasons behind those challenged and how to
overcome them based on the authors' academic background. Following are some examples: (Bertino and Ferrari 2018; Adrian et al. 2017; Barham 2017; Carillo 2017; Nunan and Domenico 2017; Sivarajah et al. 2017; Flood et al. 2016; Thabet and Soomro 2015; Saltz and Shamshurin 2016; Ebner et al. 2014; Philip Chen and Zhang 2014; Adrian 2013; Kaisler et al. 2013; Katal et al. 2013; Boyd and
Crawford 2012).
● Talking to experts or using personal experience: Literature in this category is based on “fieldwork.” It describes challenges related to big data based on discussion/interviews with experts in the field or based on the authors’ personal experience doing big data projects. This kind of research is usually combined with a literature review to bolster the findings and prove that the findings have a degree
of generalization. Following are some examples: (DalleMule and Davenport 2017; Lam et al. 2017; Angrave et al. 2016; Bughin 2016; Ransbotham 2016; Marr 2015b; Tallon 2013; Bartlett 2013; Berman 2013; Brown and Willmott 2013; Chiolero 2013; Labrinidis and Jagadish 2012).
● Case Studies: This kind of papers will investigate a particular case study and use it to draw conclusions and recommendations on what are big data challenges and how to handle them. Following are some examples: (Klievink et al. 2017;
Fitzgerald 2016; Lim et al. 2015; Laurila et al. 2012).
Finally, few papers tried to categories the challenges facing big data projects, but those papers did not try to quantify or qualify the relation among those factors and how important each of them in comparison with the others. Following are some examples: (O’Halloran et al. 2018; Adrian et al. 2017; Sivarajah 2016).
Following is a review of some of the most common factors that influence the likelihood of implementing a big data project successfully, as indicated by the literature review. They are divided into four perspectives: Personal, Technical, Political, and Management.
2.6.1 People Perspective
This perspective covers people-oriented factors that affect big data projects.
Data Scientists: Data scientists are the minds that can realize what type, size, and
frequency of data need to be captured; they devise the predictive analysis algorithms that maximize data value, with realization of organizational goals, as well as, internal and external factors around the organization. According to IBM (2016b): “Good data