IZA DP No. 3670
Effects of Low-Skilled Immigration on U.S. Natives:
Evidence from Hurricane Mitch
Adriana Kugler Mutlu Yuksel
DISCUSSION P
APER SERIES
Forschungsinstitut zur Zukunft der Arbeit Institute for the Study of Labor
Effects of Low-Skilled Immigration on U.S.
Natives: Evidence from Hurricane Mitch
Adriana Kugler
University of Houston, NBER, CEPR and IZAMutlu Yuksel
IZADiscussion Paper No. 3670
August 2008
IZA P.O. Box 7240 53072 Bonn Germany Phone: +49-228-3894-0 Fax: +49-228-3894-180 E-mail: iza@iza.orgAnyopinions expressed here are those of the author(s) and not those of IZA. Research published in this series may include views on policy, but the institute itself takes no institutional policy positions. The Institute for the Study of Labor (IZA) in Bonn is a local and virtual international research center and a place of communication between science, politics and business. IZA is an independent nonprofit organization supported by Deutsche Post World Net. The center is associated with the University of Bonn and offers a stimulating research environment through its international network, workshops and conferences, data service, project support, research visits and doctoral program. IZA engages in (i) original and internationally competitive research in all fields of labor economics, (ii) development of policy concepts, and (iii) dissemination of research results and concepts to the interested public. IZA Discussion Papers often represent preliminary work and are circulated to encourage discussion. Citation of such a paper should account for its provisional character. A revised version may be available directly from the author.
IZA Discussion Paper No. 3670 August 2008
ABSTRACT
Effects of Low-Skilled Immigration on U.S. Natives:
Evidence from Hurricane Mitch
*Starting in the 1980s, the composition of immigrants to the U.S. shifted towards less-skilled workers partly due to the influx of Latin American immigrants in the past few decades. Around this time, real wages and employment of younger and less-educated U.S. workers fell. Some believe that recent shifts in immigration may be partly responsible for the bad fortunes of unskilled workers in the U.S. On the other hand, some recent studies claim that low-skilled immigrants may complement relatively skilled natives. OLS estimates using Census data are consistent with this as they show that wages and employment of natives and earlier Latin Americans are positively related to recent Latin American immigration. However, these estimates are biased if immigrants move towards regions where there is high demand for their skills and/or if natives and earlier immigrants out-migrate in response to Latin American immigration. An IV strategy, which deals with the endogeneity of immigration by exploiting a large influx of Central American immigrants towards U.S. Southern ports of entry after Hurricane Mitch, also generates positive wage effects but only for more educated native men. Yet, ignoring the flows of native and earlier immigrants in response to this exogeneous immigration is likely to generate upward biases in these estimates too. When we control for potential out-migration, we find that the wage effects disappear and less-skilled employment of previous Latin American immigrants falls, indicating instead that recent Latin American immigrants substitute for previous immigrants from this region. This highlights the importance of controlling for out-migration not only of natives but also of previous immigrants in regional studies of immigration.
JEL Classification: J11, J21, J31, J61
Keywords: immigration, imperfect substitution, disemployment effects, natural experiments, outmigration
Corresponding author: Adriana Kugler Department of Economics University of Houston 204 McElhinney Hall Houston, TX 77204-5019 USA E-mail: adkugler@uh.edu *
We are especially grateful to Joe Altonji, Josh Angrist, David Autor, Frank Bean, George Borjas, Richard Freeman, Dan Hamermesh, Jenny Hunt, Chinhui Juhn, Larry Katz, Kevin Lang, Ethan Lewis, Peter Mieszkowski, and David Neumark as well as seminar participants at the NBER Summer
1
Introduction
Since the 1980s the composition of immigrants to the U.S. has shifted towards less skilled workers. This is partly the result of the sharp increase in Latin American immigration in the past few decades, which is less skilled than previous waves of immigration. The percentage of Latin Americans among all immigrants increased from 18% in 1970 to 48% in the year 2000. Many believe this flow of unskilled immigrants has had a negative effect on the fortunes of unskilled natives in the labor market. However, previous work on the impact of immigration in the U.S. has generally found little evidence of earnings and employment effects on natives (e.g., Friedberg and Hunt, 1995). A crucial problem in assessing the impact of immigration is that immigrants may move precisely to areas where, or during times when, there is high demand for their skills. This makes it difficult to detect the effects of immigration on native labor market outcomes, since natives may also benefit from positive demand shocks. To address this issue, a number of studies have used exogenous sources of immigration (e.g., Card (1990, 2001) for the U.S., Hunt (1992) for France, Carrington and deLima (1996) for Portugal, Friedberg (2001) for Israel and Angrist and Kugler (2003) for Europe). However, even these studies for the U.S.find modest or little impact of immigration on the wages and employment of less-skilled natives.
Given the scant evidence focusing on exogenously-driven immigration into the U.S., in this paper we revisit the question of the impact of immigration by exploiting the influx of Central American immigrants towards U.S. border states following Hurricane Mitch in October 1998. Like, the Mariel Boatlift studied by Card (1990), this natural experiment allows us to concentrate on exogenous immigration to the U.S. both in terms of timing and location. In addition, given the composition of Latin American immigrants towards younger and less educated workers, this quasi-experiment allows us to focus on the impact of unskilled immigrants who are perceived as the biggest threat in terms of worsening the labor market prospects for the majority of natives. Moreover, we control for state-specific trends to further address the concern that ongoing positive demand shocks in a state may be both attracting immigrants as well as improving labor market conditions for natives and all other workers in the state.
Using Census data for 1980, 1990, and 2000 and a “2005” cross-section generated using the American Community Surveys (ACS), we examine whether the influx of young and less educated immigrants who exogenously migrated from Latin America in the late 1990s affected the earnings and employment of natives and earlier Latin American immigrants from various skill groups. OLS results suggest Latin American immigration is positively related to
native hourly wages but negatively related to native employment. Yet, as pointed out above, these estimates are likely to be biased if immigrants migrate towards states where, or during times when, there is high demand for their skills. IV estimates, relying on the influx of Latin American immigrants following Hurricane Mitch towards U.S. Southern ports of entry, show positive effects on the wages of college and high school educated native men and earlier Latin American high school women, after controlling for state-specific trends, but show no effects on employment. These results would suggest that unskilled immigrants complement skilled native workers.
However, recent analyses (e.g., Borjas et al. (1996,1997), Borjas (2003)) have argued that area studies, which mostly exploit regional variation in immigration, may be unreliable because they fail to account for two potentially countervailing responses to immigration. First, trade may counteract the effects of immigration on natives and, second, out-migration of natives may undo the effects of immigrants. The counteracting effects of inter-state trade are, however, likely to be a longer-run phenomenon, while in this paper we are analyzing short-run effects. Since inter-state trade is unlikely to be a major concern in our context, we focus here on possible biases introduced due to internal migration responses to immigration.1
While a number of previous studies have found little migration response of natives and earlier immigrants to recent immigration (Card and DiNardo (2000), and Card (2001)), a recent study by Borjas (2005) finds that immigration is associated with lower in-migration, higher out-migration and lower population growth of natives. Here we examine whether the native population responded to the flow of immigrants following Hurricane Mitch and find no evidence that the native population or earlier Latin American or African immigrants ad-justed in response to this recent wave of exogenous immigration. On the other hand, wefind that earlier Asian and earlier European and Australian immigrants appear to have moved away from Southern states in response to the recent wave of Latin American immigration, so we control for possible out-migration by these groups. Our results controlling for internal migration by earlier immigrants show very different results: recent Latin American immi-grants have no effects on native wages and employment but reduce the employment of earlier Latin American immigrants.
The rest of the paper is organized as follows. Section 2 documents Hurricane Mitch and its consequences in terms of migration towards U.S. Southern ports of entry. Section 3 describes
1As an alternative to the use of regional variation as in area studies, other studies (e.g., Borjas et al.
(1996, 1997, 2008) and Borjas (2003)) exploit variation in the share of immigrants in different skill groups at the national-level, thus assuming that those in the same skill-group compete in a national labor market. Given that these studies are not subject to biases due to internal migration, these studies tend thefind larger effects than the ones in area studies.
our identification strategy, which exploits the exogenous influx of Central Americans to near-by U.S. states after Mitch. Section 4 describes the Census and American Community Survey data used in the analysis. Section 5 presents estimates of immigration effects on native and earlier immigrant wages and employment. Section 6 concludes.
2
Consequences of Hurricane Mitch for Migration
Similarly to a handful of other papers (e.g., Card (1991), Hunt (1992), Carrington and DeLima (1996), Friedberg (2001), and Angrist and Kugler (2003)), in this paper we study the effects of an unexpected wave of immigrants on the labor market outcomes of natives and earlier immigrants. In particular, we exploit the immigration from Central America to the U.S. generated by a natural disaster, Hurricane Mitch. Other than Card (1991) ours is the only study for the U.S. based on a natural experiment as other studies of this sort exploit natural experiments in Europe. Like Card (1991), we are able to concentrate on unskilled immigrants, who are thought to contribute less to the host country and most likely to generate negative political reactions to immigration.2 In addition, since we use data for all of the U.S., we can control for ongoing trends in receiving states.
An important difference between our study and Card’s study of the Mariel boatlift is that, as described below, our study considers an influx of immigrants who quickly became legalized. By contrast, the Marielitos, unlike previous Cubans, were not given automatic refugee status and roughly half of them were initially sent to alien camps in Georgia and other states outside of Florida (Aguirre et. al. (1997)). While the Marielitos arrived to the U.S. between April and September of 1980, it was only until December 1984 that INS regulations were changed to allow Marielitos to register for permanent resident status. Moreover, both the wave of Cuban immigrants in 1980 and the wave of Central Americans after Mitch were composed mainly of less educated workers but the Mariel exodus included social ‘undesirables’, including some who had been in prison and others suffering from mental illnesses. While it is estimated that at most 7% of the 125,000 Cubans who arrived from the port of Mariel had been inmates in Cuba, this wave of Cuban immigrants received very negative media coverage and many of them were subsequently institutionalized in the U.S. (Aguirre et. al. (1997)). In fact, public opinion polls from 1980 showed that 75% of respondents nationwide believed the Marielitos should had never been allowed into the U.S. and about 60% thought they should be sent back to Cuba (ABC News-Harris Survey (1980)). The perception of the Marielitos as undesirable,
2See Borjas (1995) for a general discussion of these issues and Mayda (2005) for an analysis of the
and possibly unemployable, contrasts with the image of Mitch refugees by the U.S. public as survivors and hard-working. The legal status of Mitch refugees together with the positive perception of the refugees means that Mitch immigrants were probably more likely to be hired and, thus, were more likely to compete with natives and earlier immigrants than the Marielitos.
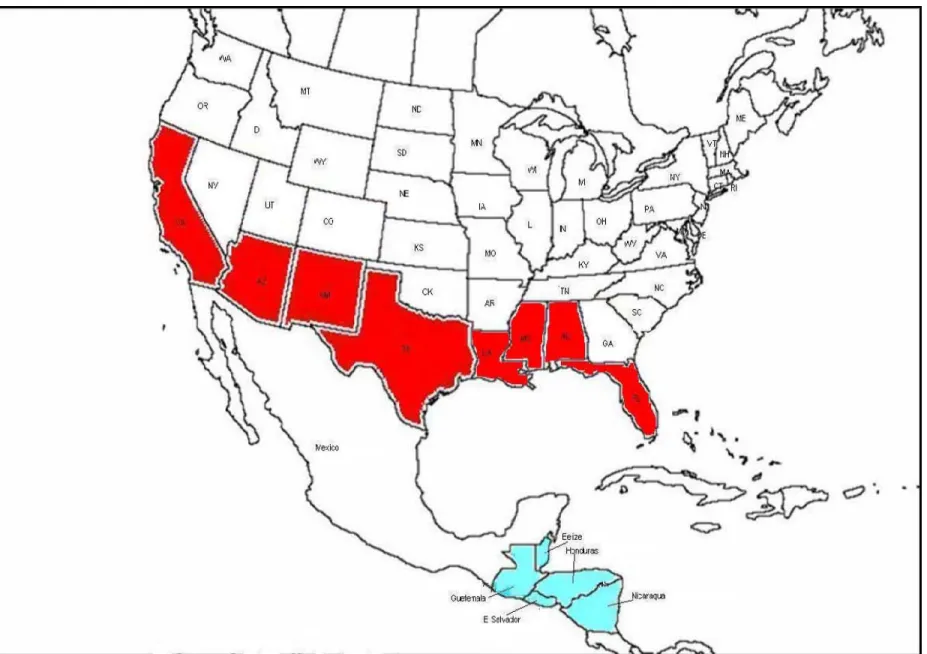
Hurricane Mitch hit Central America during the last week of October 1998. Honduras and Nicaragua were particularly hard hit, but Guatemala and El Salvador (and to a much lesser extent Belize) were also affected by the Hurricane (see the map in Figure 1). Hurricane Mitch became the fourth strongest Atlantic Hurricane on record together with Hurricanes Camille (1969), Allen (1980), and Gilbert (1988). It reached category 5 on the Saffir-Simpson scale with winds peaking at 180 miles per hour. Although Mitch was one of the strongest Atlantic hurricanes on record, the winds slowed down considerably as the storm moved inland. However, it was precisely the large amounts of rainfall that accumulated due to the slow moving storm that caused most of the damage. In fact, Mitch is the second deadliest hurricane to have hit the Atlantic after the Great Hurricane of 1780 (U.S. National Weather Service and U.K. National Meteorological Service).
Hurricane Mitch is estimated to have generated a very high human and material cost. Mitch is estimated to have caused 20,000 deaths and 13,000 injuries; to have left 1.5 million homeless, and to have affected another 2 million in other ways (FAO, 2001). The hurricane also destroyed a large part of these countries’ road networks and social infrastructure, in-cluding hospitals and schools. Overall, FAO (2001) estimates that about 28,000 kilometers of roads and 160 bridges were destroyed. According to U.S. Aid, 60% of the paved roads in El Salvador were damaged, and 300 schools and 22 health centers were also destroyed or damaged by the hurricane in this country (US Aid, 2004). In addition, Mitch largely destroyed crops and flooded agricultural land in the all the affected countries, reducing pro-duction in the agricultural sector. The share of agriculture in the region’s GDP dropped from 21.2% before the hurricane to 17.8% after Mitch (FAO, 2001). The direct estimated damage to the farming sector inflicted by Mitch was of $960.6 million in Honduras, $264.1 million in Guatemala, $129.8 million in Nicaragua and $60.3 million in El Salvador. Two of the crops most affected were bananas and coffee, on which these countries’ export sector heavily depends on. According to ECLAC, the estimated damage totalled $6,18 billion or about 12% of the Regional GDP, 42% of exports, 67% of grossfixed investment, and 34% of the external debt of these countries. Even before the hurricane hit, the four Central Amer-ican countries most affected by the hurricane were already among the poorest countries in all of Latin America. For example, the percent of households living below the poverty line
reached 73.8%, 65.1%, 53.5% and 48% in Honduras, Nicaragua, Guatemala, and El Salvador the year before the hurricane hit (ECLAC, 2001). Moreover, the hurricane hit the hardest in rural areas and, thus, is likely to have affected mainly individuals already living under or close to the poverty line.
According to the World Bank, the main way in which Central American men responded to the disaster was by migrating North (World Bank, 2001).3 Information from Migration
Departments in these countries shows that external migration from Honduras almost tripled and external migration from Nicaragua increased by about 40% (FAO, 2001). In January 1999, New York Times headlines announced “Desperate Hurricane Survivors Push[ing] North to [the] U.S. Border.” In January 1999, Honduran immigration director reported that about 300 Hondurans a day were leaving for the U.S. and visa requests for the U.S. were up 40% from the previous year. According to journalistic accounts many Central Americans crossed through Mexico to get to the U.S., which is reflected by the big rise in the “other than Mexican” apprehensions in the U.S.-Mexico border, which were close to 4,000 in January 1999 (i.e., a record high for a single month). Officials at the border in Brownsville, Texas area reported a 61% increase in the number of Hondurans apprehended after illegally crossing the border during the last three months of 1998. Likewise, in the Laredo, Texas area 583 “other than Mexican” foreigners were apprehended in December 1998 compared to 123 in December 1997.
As a formal response to the migration generated by Hurricane Mitch, on December 30, 1998, the Immigration and Naturalization Service (INS) announced in a news release the designation of Temporary Protected Status (TPS) for Honduras and Nicaragua for a period of 18 months (i.e., through July 5, 2000), which was later extended.4 During the following
18th month period, Hondurans and Nicaraguans who had entered the country before this date would not be subject to removal and would be eligible for permission to work in the U.S. It is estimated that by 2003, close to 150,000 Hondurans and Nicaraguans had been granted Temporary Protected Status (TPS) to allow them to stay and work in the U.S. At the same time, there were many Hondurans and Nicaraguans who came during that time but were not granted TPS, so the number of Central Americans who came from these countries was probably higher than this official number. In addition, in the same news report, the INS announced that it would suspend deportations of Guatemalans and Salvadorans for 60 days (or until March 1999).
3By contrast, according to the study, women responded by increasing their labor force participation and
mobilizing social networks.
4Up until that point, TPS had normally been granted to refugees from countries suffering from war or
Figure 2 shows the percentage of Central Americans out of all immigrants coming in a given year for the 20 percentile of states closest and farthest from Central America. The
figure shows that the share of Central Americans was low in all states over the 1990s, but higher in states closer to Central America than in those farther away. In nearby states the share of Central Americans declined since 1993 until the influx of Mitch refugees came in 1998, when the share of Central Americans jumped. By contrast, the share of Central Americans in far-away states declined slightly from 1992 to 1995 and increased steadily in 1996 and 1997 but declined in 1998, the year the Mitch generated the large migration North. The migration of Hondurans, Nicaraguans, Salvadoreans, and Guatemalans after 1998 observed in Figure 2 was highly concentrated in close-by states. Data from the 2000 US Census shows that 23.6% of all Central Americans who came to the U.S. after 1998 went to California, 11.6% went to Florida and 9.7% went to Texas. The rest were dispersed in other Southern states including the states of North Carolina, Virginia, and Georgia.5
In the following section, we describe how we exploit the increased immigration after 1998 towards U.S. states close to Central America following Hurricane Mitch to study the labor market effects of immigration on natives and earlier immigrants.
3
Identi
fi
cation Strategy
The goal of this paper is to identify the impact of less-skilled immigration on the wages and employment of natives and earlier immigrants. To do so, we begin with the following simple model:
yijt=μj +τt+X 0
ijtβ+γLASLAjt+εijt, (1)
where the dependent variable, yijt, is either the log of the hourly wage or the employment
status for individuali in statej at timet. The model includes state and year effects,μj and
τt. X 0
ijt is a vector of individual characteristics of individual i in state j at time t, which
includes education, experience, marital status, and race.6 The regressorS
LAjtis the share of
Latin American-born individuals who immigrated to state j in the past five years out of the
5Other states with a percentage of Central Americans above 3% included Maryland, New Jersey, and
New York. By contrast, among the states receiving very few immigrants from Central America, with several states receiving none or close to zero, were Alaska, Hawaii, Idaho, Maine, Montana, North and South Dakota, Oregon, Vermont, and Washington, all of which are distant from Central America.
6By controlling for these variables in the regression, we are able to control for potential changes in
composition affecting the wages and employment of natives and earlier immigrants. Our controls are the same as those included by Card (2001), except that we exclude occupation and industry controls which are potentially endogeneous.
population in that state.7 This specification is estimated for male and female workers in three
education groups (high school dropouts, high school graduates, and college educated). In addition, we estimate this same specification for earlier Latin-American immigrants, where we classify earlier immigrants as foreign-born who arrived more than 10 years ago. The idea of estimating this specification separately by education group is that some groups of workers may be more substitutable with recent Latin American immigrants than others and probably with earlier Latin Americans than with natives.
A basic problem with this simple OLS regression is that the error term, εijt, may be
capturing a positive demand shock to state j at time t, which could be driving the decisions of recent immigrants to move to that state at that point in time and which could also be affecting the wages and employment of natives and earlier immigrants. Overall positive demand shocks correlated with immigration will bias upwards the impact of immigration and may not allow us to detect any effects even if immigrants indeed reduce the wages and employment of natives and earlier immigrants. On the other hand, positive demand shocks to unskilled relative to skilled workers, which attract unskilled immigrants will bias upwards the effects of immigration on unskilled natives and earlier immigrants but will bias downwards the effects on skilled workers.
We address the potential endogeneity of immigration by using an IV strategy which relies on the large influx of Central American immigrants towards close-by U.S. states following Hurricane Mitch. The first-stage equation for the IV estimates is:
SLAjt =λj+κt+δPostt×Distancej +νijt, (2)
where λj and κt are state and year effects. Postt is a dummy that takes the value of 1 if
the immigrants arrived after Hurricane Mitch and zero otherwise. Distancej is a variable
which measures the average of the straight-line distance in miles from all Central American capitals to the Southern-most city of each statej.8The choice of instrument as the interaction
between a post-Mitch dummy and distance from Central America to various states in the U.S. is motivated by the discussion in the previous section which documents the large migration North from Central America towards near-by U.S. states right after Hurricane Mitch. Given
7We also tried using alternative regressors, including the shares of recent unskilled immigrants from Latin
America and from all destinations. Using the share of unskilled immigrants instead of the share of Latin American immigrants yields similar but bigger effects. We prefer to focus on the Latin American share since our Mitch instrument produces a strongerfirst-stage for this group.
8See Table A1 in the Data Appendix for more details on the distance measure. This table also shows the
distance from each of the capital cities of the affected Central American countries and the average distance from all four capital cities. Our results are robust to the use of distance to Tegucigalpa, the capital of Honduras, which was the country hardest hit by the Hurricane.
that thePosttdummy takes the value of 1 if the person is observed in the 2000 Census or the
2005 ACS cross-section and zero otherwise and that the left-hand side variable includes Latin American immigrants who came in the past five years, our instrument captures those Latin Americans who came between 1995 and 2005 to states close-by to the Central American capital cities.9
We do a number of specification checks since the share of other Latin Americans, and es-pecially the share of Mexicans, increased starting in the 1970s (see Borjas and Katz (2007)).10
First, we control for the pre-existing increasing trend of other Latin Americans by including the share of Latin Americans if the immigrants from each country had located exactly as previous immigrants from those same countries did 10 years ago (i.e., this is the Card instru-ment from Card (2001)). Second, we include the lagged share of Mexicans in those states to control for the possibility that this trend is driving the higher shares of Latin Americans in close-by states after Mitch. Third, we do a falsification test similar to that done by Angrist and Krueger (1999) of the Mariel Boatlift. In particular, we run a regression of the share of Latin Americans on the interaction of the distance measure with a post-1990 dummy (instead of a post-Mitch dummy) using only the 1980 and 1990 Censuses to check again that we are not simply capturing an on-going trend. Finally, we estimate equivalent first stages for the share of earlier African, European and Australian, and Asian immigrants to check that the correlation between the share of Latin Americans and the instrument is not simply spurious. The idea is that by estimating the first stage for other source regions, we can check whether we are likely to be capturing Latin American immigration to the border states driven by Mitch or simply a generalized immigration pattern to border states in recent years from all areas of the world.
In all specifications we also include state-specific trends to control for pre-existing demand shocks at the state-level. The specifications with trends replace λj with λ0j +λ1jt in the first-stage andμj with μ0j +μ1jt in the second-stage.
Another important problem that arises, even when instrumenting the immigrant share, is that natives or earlier immigrants may move in response to exogenous immigration and
9We also tried using the share who came in the last three years, which can only be identified in the 1990
and 2000 Censuses and in the “2005” ACS cross-section, so that our instrument would be capturing Latin Americans who came between 1997 and 2005 in states close-by to the Central American capital cities. The results using the shares of those who came in the past three years provide an even stronger first stage, but we would loose information from the 1980 Census. The 1980 Census asks the question of when the person came to live in the U.S. in 5-year intervals (e.g., 1965 to 1970, 1975 to 1980, etc.). By contrast, the 1990 Census asks the same question in three-year intervals (e.g., 1987 to 1990, etc), while the 2000 Census and ACS ask the exact year when the person came to live in the U.S.
10It is noteworthy, however, that the share of Mexicans started to increase earlier in most border states
bias the IV estimates. This is equivalent to failing to control for the share of other groups in the regression, so that the error term will be εijt =γOT HERSOT HERjt+ξijt and the bias
will be,
Bias= γOT HER×Cov(Postt×Distancej, SOT HERjt)
Cov(Postt×Distancej, SLAjt)
.
The direction of the bias, thus depends on whether the impact of other groups on native wages is positive or negative (i.e., on whether they are complements,γOT HER >0, or
substi-tutes,γOT HER <0), and on whether the other groupsflee to far away states as Central
Amer-ican immigrants come due to Mitch, in which case Cov(Postt×Distancej, SOT HERjt)>0.If
there is no out-migration by other groups in response to the immigration due to Mitch, then there is no bias. However, if there is out-migration and other groups are substitutes with natives then the bias in the IV estimates will be positive. If they are complements then the bias will be negative.
We deal with the possible concern that natives and earlier immigrants may be coun-teracting the impact of recent immigrants by re-estimating the IV results with trends, but adding the shares for native or immigrant groups of concern as follows:
yijt =μ0j +μ1jt+τt+X 0
ijtβ+γLASLAjt+γOT HERSOT HERjt+ξijt (3)
whereSOT HERjtis the share of other groups in the total population, and where we instrument
the share of earlier immigrants with a Card-type instrument.11 The first-stage is thus,
SOT HERjt=ψj+πt+ρP SOT HERjt+ζjt, (4)
where P SOT HERjt is the predicted share of immigrants from the same country based on
previous migration from those countries to the state in the previous decade,
P SOT HERjt= [ P C∈OT HER ¡M cjt−1 M ct−1 ¢ ×M ct ¡P C∈OT HER ¡M cjt−1 M ct−1 ¢ ×M ct¢+Njt−1 ],
11Another way to deal with this concern is to exploit variation in skill groups and over time at the
national-level as Borjas et. al (1996,1997, 2008), Borjas (2003) and Ottaviano and Peri (2006, 2008). By exploiting this source of variation, these analyses assume national labor market for every skill group, which may hold for some groups but less for others. In addition, like analysis exploiting regional variation, these analysis are also subject to endogeneity in terms of the timing of immigration. Borjas (2003) includes interactions between schooling and experience groups and time to control for changes in the effects of schooling and experience on wages over time, so this helps to alleviate the concern with the endogeneous timing of immigration.
and whereMct andMct−1 are the number of immigrants from countrycwho came to all U.S.
states more than 5 years ago and more than 15 years ago, respectively; Mcjt−1 is the number
of immigrants from countryc in statej who came more than 15 years ago; andNjt−1 is the
native population in state j more than 15 years ago.12 Like in Card (2001), the use of this
instrument is motivated by the fact that immigrants may prefer to locate in the same places as those from their same countries, since they may provide them access to social networks and facilitate entry into labor and housing markets.
4
Data Description
Our data come from two sources. First, we use data from the U.S. Census PUMS files for the years 1980, 1990, and 2000. Second, we pooled data from the 2003, 2004, and 2005 American Community Surveys (ACS) to create what we will refer to as the “2005” cross-section. We rely on this “2005” ACS cross-section to make sure we cover a longer period after the immigration North due to Hurricane Mitch.
Census data has information on demographic characteristics including age, marital sta-tus, race, and education. We use the information on education and graduation to separate the sample into three groups of individuals: high school dropouts, high school graduates, and college educated.13 More importantly for our study, the Census has precise information on country of birth which allows us to identify natives and foreign-born individuals or immi-grants. In addition, the data allows us to distinguish immigrants from different origins. We can also identify recent and earlier immigrants by using information on year since immigra-tion to the U.S., where we define recent immigrants as those who arrived less thanfive years ago. We restrict our sample to individuals between 21 and 65 years of age. In addition, we exclude individuals working in the public sector.
The data also include information on labor market outcomes for the year just prior to the Census year.14 We use information on total hourly earnings together with information on weeks worked and hours per week to construct an hourly wage measure. These hourly
12Card (2001) assigns the location of those from the same countries one decade before. Since we are
instrumenting for earlier immigrants, i.e., those who came more than 5 years ago, this means that for those who came in 2000 we assign the 1995 location for those from the same countries; for those who came in 1995 we assign the 1985 location for those from the same countries; for those who came in 1990 we assign the 1985 location for those from the same countries, and so forth. Then, for those who came before 1960 we simply assign their actual location.
13See Data Appendix for greater detail on how we divided individuals into these three education groups. 14Note that given that the influx of Central Americans following Mitch occurred in late 1998 and early
1999, using data on labor market outcomes from the 2000 Census would imply we would only capture the effects of immigration in the earnings and employment of natives just one year after the arrival of Mitch refugees. This is why we also rely on the “2005” ACS cross-section.
wages are then deflated using a yearly CPI from the Bureau of Labor Statistics.15 We also
construct an employment status indicator which takes the value of 1 if the person is employed and zero otherwise. Since information on labor market experience and tenure is not asked in the Census, we construct a measure of potential experience as age minus years of education minus 6.
The ACS was introduced to replace the decennial Census long-form. Thus, the ACS includes all detailed demographic, socio-economic and housing characteristics which were traditionally collected on the long-form until the 2000 Census. The ACS uses the same questionnaire as the 2000 Census. This means that we are able to construct exactly the same variables as with the Census data. Nationally representative ACS data have been available each year since 2000. We use the 2003, 2004, and 2005 ACS. We pull these three years to have a similar sample size for the “2005” cross-section as for the 1% Census samples. While geographic identifiers at a finer geographic level than the state are restricted due to confidentiality, this does not present a problem for our analysis which relies on state-level immigrant shares.16 As for the Census data, we deflate the hourly wages by the national
CPI.
Table 1 presents descriptive statistics using our combined data from the 1980, 1990, and 2000 Censuses and the “2005” ACS cross-section for natives by education group (high school dropouts, high school graduates, and college educated) and sex. The table shows higher hourly wages and employment for more highly educated groups and for men than for women. The table also shows that individuals with more education are older; more likely to be married; and less likely to be in blue-collar occupations, and in the agricultural, construction and manufacturing sectors. Finally, the table shows that dropouts are disproportionately Black and Hispanic.
Table 2 presents descriptive statistics for recent (i.e., those who arrived less thanfive years ago) and veteran or earlier (those who arrived more thanfive years ago) Latin American im-migrants as well as for recent and veteran or earlier non-Latin American veteran imim-migrants. Immigrants from non-Latin American countries have on average completed high school, i.e., recent and earlier non-Latin American immigrants have completed 12.9 and 12.77 years of schooling on average. By contrast, Latin American immigrants are closer in educational at-tainment to native dropouts. Recent Latin American immigrants have on average 9.4 years of schooling and earlier Latin American immigrants have on average close to 10 years of schooling, compared with close to 9 years for native dropouts. Also like native dropouts,
15See the Data Appendix for more details on the construction of the hourly wage. 16See Data Appendix for more details on the ACS.
Latin American immigrants and, in particular, recent Latin American immigrants are more likely to work in blue-collar occupations and in agriculture, construction and manufacturing than more educated natives. This descriptive statistics show the change in composition to-wards less-educated workers, not only because the share of Latin American immigrants who are less-educated than other immigrants has been growing over the past decades,17 but also
because among Latin American immigrants the more recent ones are less educated.18
5
Estimates of Immigration E
ff
ects
5.1
OLS Estimates
Table 3 presents OLS estimates of the effect of Latin American immigration on natives, i.e.,
γLA in equation (1). The dependent variables are the log of the hourly wage and an indicator
of whether the person is employed or not. The controls are state and year effects; years of education; potential experience and potential experience squared; a marriage dummy; and Black, Asian, and Hispanic dummies. The reported standard errors allow for clustering at the state-level, allowing for correlations of individuals within states and for correlations within states over time.
Panel A of Table 3 shows the effects of immigration on the hourly wages of male and female natives in different education groups.19 The results show positive effects of
immi-gration on the hourly wages of men at all education levels with and without state-specific trends. However, one may be suspicious of these results, since dropouts and immigrants seem to have about the same skill level and thus likely to be substitutes. The results also show positive effects on the hourly wages of high school and college educated women when controlling for state-specific trends. On the other hand, the results in Panel B show negative effects on male and female employment of dropouts and high school graduates.
Table 4 shows similar effects of recent immigrants on earlier Latin American immigrants. The results in Panel A again suggest positive effects on the hourly wages of earlier Latin
17In 1970, the percent of Latin Americans was 18%, in 1980 it was 31%, in 1990 it was 38% and by 2000
it had reached 48%.
18While this change in the composition of immigration may in thefirst intance affect the labor market, in
the longer-run it may also have an effect on the demand for services and products and also on prices (see Cortes (2008) for an analysis of the effect of immigration on the CPI and see Bodvardsson et al. (2008) for an analysis of the impact of the Mariel Boatlift on product and labor demand) and it may induce employers to shift towards less-skilled intensive technologies (see Lewis (2005) for an analysis of this issue).
19The native group pools white, African-American, Hispanics, Asian-Americans and Native-Americans.
While some studies focus solely on African-Americans (e.g., Bean and Hamermesh (1998) and Borjas et al. (2006)), we do notfind significantly different effects for African-Americans from other groups so we decide to pool them for our analysis.
American immigrants when not including trends. However, when we include state-specific trends to help control for ongoing demand shocks, the results become insignificant. By contrast, the results without trends in Panel B suggest that employment decreased for ear-lier Latin American men with high school or college degrees in immigrant-receiving states. However, once we control for state-specific trends the results on employment also disappear. Given the potential response of immigration to positive regional demand shocks, which would also increase wages and employment for natives and earlier immigrants, it is difficult to give a causal interpretation to the OLS estimates. As discussed above, endogenous im-migration in response to omitted regional demand shocks would introduce positive biases in OLS estimates and may hide the true effects of immigration. On the other hand, endogenous immigration in response to demand shocks for unskilled relative to skilled workers may in-troduce negative biases in the OLS estimates for skilled workers. The following IV estimates based on exogenous immigration from Central America after Hurricane Mitch attempt to eliminate such biases.
5.2
IV Estimates
This Section presents estimates of immigration effects which rely on an IV strategy. The IV strategy is motivated by the large influx of Central American immigrants into close-by U.S. states in the late 1990s documented in Section 2. The accounts about the response to the Hurricane and data from the 2000 Census indicate that many immigrants were locating in states close to the border, suggesting that distance from the countries hard-hit by the Hurricane should be a good predictor of the state share of Latin American immigrants after 1998. The first-stage equation for the IV estimates is given by equation (2). The essence of this IV strategy is to look for a break after Hurricane Mitch in hourly wages and employment in states close-by to Central America.
Table 5 presents results of the first-stage regression, i.e., equation (2). Results without trends in Panel A indicate that states closer to Tegucigalpa experienced an increase in the share of Latin American immigrants after Hurricane Mitch. In Panel B, we include state-specific trends to check whether the increase in the share of Latin American immigrants in close-by states simply reflects an ongoing trend or whether there is indeed a discernible break after Mitch. The results with trends show an even bigger increase in the share of Latin American immigrants after Mitch. For example, the results with trends in Column (1) of Panel B suggest that moving closer to Central America, say from Washington State to Texas, increases the share of immigrants coming from Latin America after Mitch by a third
of a percentage point.20
Since, as documented above, the share of Latin American immigrants has been increasing over the last few decades, we include the previous shares of Latin Americans, and in particular Mexicans, to assure that we are not simply capturing this ongoing trend. First, in Column (2), we include in the first-stage regression the share of Latin Americans as they would have located if they had lived in the same states as those from the same Latin American countries in the previous decade. This is the instrument that Card (2001), and many others after him, have used. The idea of this instrument is that networks play an important role in determining location and that people go to where others from their same countries have gone in the past. This variable is indeed significant, but our interaction between distance and the post-Mitch dummy also remains highly significant and its magnitude hardly changes.21 In addition, since Borjas and Katz (2007) document an increase in the share of Mexicans, we explicitly control for the share of Mexicans in Column (3). Surprisingly, once we control for state-specific trends, the results show that a higher share of Mexicans in the past reduces the share of current Latin Americans. More importantly, the coefficient on the interaction between distance and post-Mitch remains very similar and highly significant.
As another check on the possibility that we are simply capturing some pre-existing trend, Column (4) reports the results of a regression of the share of Latin Americans on an inter-action of distance and a post-1990 dummy using only data for the 1980 and 1990 Censuses. This is a falsification test a-la Angrist and Krueger (1999), who look at the impact of a false Mariel Boatlift in 1994 (an announcement by then-President Clinton to let Cuban Refugees into the U.S. but which never materialized) on the Miami labor market. While Angrist and Krueger (1999) found a similar result using the 1994 announcement as with the actual Mariel boatlift, here we find no effect of the fake natural experiment after 1990 while the Hurricane does show the expected increase in the share of Latin Americans.
To test whether the increase in the share of Latin American immigrants after the Hurri-cane simply reflected a general increase in immigration towards Southern states towards the late 1990s not driven by the natural disaster, in Columns (5), (6) and (7) we also estimate
20We also tried estimatingfirst-stage regressions of the share of unskilled immigrants from all destinations
and the share of unskilled immigrants from Latin America and thefirst-stage results are slightly smaller but significant, i.e., -0.0016 (0.00076) and -0.001 (0.00046), respectively. By contrast, the second-stage results are similar but larger in magnitude.
21We do a Hausmann-Wu test comparing the IV estimates using our instrument and the IV estimates
using Card’s estimates under the null that the IV estimator using the interaction between distance and post-Mitch is consistent. A concern wtih Card’s instrument is that if demand shocks are autocorrelated, then past immigration to a state is also likely to be correlated to past and current demand shocks. Wefind that the Mitch IV estimates and the Card IV estimates are significantly different from each other, so we decide to use only the distance post-Mitch interaction to instrument the Latin American share.
the equivalentfirst-stage regression for the shares of recent immigrants coming from Africa, Europe and Australia, and Asia. Unlike the share of recent Latin American immigrants, the shares of recent immigrants from other destinations towards Southern states did not increase after Hurricane Mitch. The results with and without trends in Panels A and B show no effects on the immigration shares of other ethnic groups.
Table 6 reports results of equation (1) estimated for natives, but where the Latin Ameri-can share is instrumented with the interaction between the post-Mitch dummy and distance. Panel A shows results for hourly wages and Panel B shows results for employment. As be-fore the results show no effect on employment. On the other hand, the IV results without trends continue to show an increase in the hourly wages for high school dropouts and college educated men. However, IV results controlling for state-specific trends show positive effects on the wages of men who graduated from high school and college. In particular, these results for men suggest that an increase of 10% in the share of Latin Americans increases the hourly wage of educated native men by between 0.8% and 1.25%. On the other hand, unlike the OLS results, the IV results suggest no effect on the hourly wage of male dropouts who are more likely to be substitutes with immigrants.22 These results suggest that less educated
Latin American immigrants complement high-skilled native men.23 The results for women,
with or without trends, show no effects on hourly wages or employment.
Table 7 presents equivalent results to those in Table 6, but for earlier Latin American immigrants. Like the OLS results the IV results without trends continue to show positive effects on the hourly wages of both men and women of all education groups. However, the results disappear when including state-specific trends, with the exception of a positive effect on women with a high school degree. The results imply that an increase of 10% in the Latin American immigrant share would increase hourly wages of women with a high school degree by 1.4%. Results without trends only show a negative effect on the employment of earlier Latin American immigrant men with a high school degree. However, this sign reverses when including trends, suggesting no clear employment effect.
Contrary to the OLS results in Table 3, the IV results with trends in Table 6 only show
22The positive effects on high school and college graduates are significantly different from the zero effect
on high school dropouts.
23Ottaviano and Peri (2006, 2008) use variation in the share of immigrants for different skill groups and find evidence of positive effects of immigration on native wages, driven mostly by the more educated, but negative effects on previous immigrants. However, Borjas, Grogger and Hanson (2008) show that the ealier results in Ottaviano and Peri (2006) were not robust to the exclusion of young people still in school from the sample. The latter study onlyfinds positive effects of immigration on wages in the medium-run. Card (2007) Ottaviano and Peri (2007) alsofind a positive association between the share of immigrants and native wages. However, while both studies instrument the share of immigrants and control for native out-migration, they fail to control for out-migration by previous immigrants in the way we do in the next section.
positive effects of Latin American immigration on the hourly wages of more educated native men and no effects on employment. Thus, the generalized positive effects on wages, even on high school dropouts, observed in the OLS results seemed to have been largely driven by positive demand shocks which both attracted low-skilled immigrants to these states as well as increased the earnings of high school dropouts.
5.3
Controlling for Migration Responses by Natives and Earlier
Immigrants
Aside from the problem of endogeneity which is addressed in the previous results by in-strumenting the immigrant share, there are two additional potential biases in the results presented above. First, inter-state trade in response to lower wages from migration may dissipate the effects of immigration in the long-run. Second, out-migration by natives or earlier immigrants may undo the effects of recent immigration. As the first effect is likely to be a long-run effect and, in this paper, we are studying short-run effects of immigration, we are mainly concerned here with the second potential problem.
Previous studies which examine the migration response of natives and earlier immigrants to recent immigration provide mixed evidence. For instance, Card (2001) estimates the effect of recent immigrants on net population growth, the outflow rate and the inflow rate of natives and earlier immigrants. On net, Card (2001) finds that immigration is associated with an increase in population growth for natives and a decrease for earlier immigrants, though the latter depends on whether weights are used or not for the analysis. The net effects are the result of effects on outflows and inflows of natives and earlier immigrants. In particular, recent immigration is associated with an increase in the outflow rate of natives and earlier immigrants, though the effect is small in magnitude especially for natives. At the same time, Card’s study finds that recent immigration is associated with an increase in the inflow rate of natives and earlier immigrants, with the exception of the unweighted results for earlier immigrants. Card (2001) thus concludes that recent immigrant inflows may be correlated with positive demand shocks, which cause an increase in the net population of both natives and earlier immigrants.
By contrast, a recent study by Borjas (2005) uses data from the 1960-2000 decennial censuses and finds that immigration is associated with a decline in the population growth rate of natives, which may mitigate the effects of immigration. This effect on net migration arises both because of higher out-migration and lower in-migration into high immigration states. He also finds that these associations become smaller as the geographic area that defines the labor market becomes larger. For example, moving from the metropolitan area
level to the state level reduces the extent of these correlations.24 Borjas (2005), however,
does not look at the association between recent immigration and migration patterns of earlier immigrants.
In Table 8 we explore whether net migration responded to exogenously driven Latin American immigration. In particular, Table 8 reports results of equations like equation (2), but where the dependent variable is the share of natives and earlier immigrants in the states’ population. If natives and earlier immigrants respond to recent immigration by moving away from or slowing down migration towards states close to Central America, then we should expect a positive coefficient in the interaction term. By contrast, if native and earlier immigrant migration do not respond to the exogenously-generated Latin American immigration, then we should expect this coefficient to be insignificant. The results show no effect on natives or earlier Latin American or African immigrants. On the other hand, there is a positive and significant effect on the share of earlier Asian immigrants with or without state-specific trends, and a positive and significant effect on the share of European and Australian immigrants when trends are included. These results, thus, suggest that these veteran Asian and European and Australian immigrants may had responded by moving away from border states after Hurricane Mitch.
To reduce the biases due to the omission of these groups we do two things. First, following Borjas (2005), we re-estimate the regressions in Tables 6 and 7 using the regional shares of Latin Americans instead of the state-level shares.25 The idea is that by moving up to the
regional level, we eliminate the inter-state migration within regions and may reduce the bias due out-migration. We estimate the shares for the standard 9-regions as defined in the Census: the New England Division, Middle Atlantic Division, East North Central Division, West North Central Division, South Atlantic Division, East South Central Division, West South Central Division, Mountain Division, and Pacific Division. We, then, construct the instrument as the interaction between the post-Mitch dummy and the average distance from the Central American capitals to all states within these regions. As with the state-level shares, the only significant effects on wages for natives are on high-school and college men. As expect, however, these wage effects are smaller and less precise than when we use the state-level variation. The high-school effect is 0.098 with a se of 0.05 and the college effect is 0.065 with a se of 0.023, which are significantly smaller than the results in Table 6 for natives.
24Thus, to the extent that we use state-level rather than metropolitan-level immigration, internal migration
in response to immigration should be less of a concern in our study.
25Borjas (2005) re-estimates the labor market effects of immigration moving from the metropolitan-level, to
the state-level, to the regional-level andfinds that the effect of immigration on native labor market outcomes becomes increasingly more negative as the level of geographical aggregation increases.
For Veteran Latin American, the only significant wage effect is for high school women. The coefficient is larger in this case, but the effect is only marginally significant while it was significant at the 1% level when using the state-level shares. Thus, using regional shares seems to reduce the upward biases due to out-migration.26
Second, given that out-migration can be viewed as introducing omitted variable biases, we add the shares of earlier Asians and Europeans and Australians in the population as in equation (3).27 Aside from the interaction between distance and the post-Mitch dummy,
we use two other instruments for the shares of immigrants: the share of Asians and the share of Europeans/Australians had they located in the same states as those from their same countries did a decade before, as described in equation (4).28 Tables 9 and 10 report
results for hourly wages and employment of natives and earlier Latin American immigrants, respectively, which also add the Asian and European-Australian shares. In contrast to the IV results without controls for out-migration, the results in Table 9 now show no wage or employment effects of Latin American immigration on native men or women. Comparing these results with the IV results that do not control for out-migration indicates that failing to control for out-migration generates positive biases.
The results in Table 10 show no wage effects of recent Latin American immigration on earlier Latin Americans either. However, these results show negative employment effects on earlier educated Latin Americans when controlling for internal migration responses by other ethnic groups. Thus, the results controlling for potential out-migration by other groups suggest displacement of earlier Latin Americans by recent Latin American immigrants. In particular, an increase of 0.1 in the share of Latin Americans reduces the probability of employment of earlier Latin Americans by close to 0.01.29 Similarly, the results show that
previous Asian immigrants displace veteran Latin Americans. On the other hand, former European and Australian immigrants have a positive effect on Veteran Latin Americans suggesting complemenatarities between these two groups. These results highlight the im-portance of controlling for out-migration not only of natives but also of previous immigrants when exploiting geographical variation to estimate immigration effects. Previous regional studies which find positive effects of immigration only control for native out-migration but fail to control for out-migration by previous immigrants.30
26We do not report complete tables for this exercises, but results are available upon request.
27We do not have to worry about including shares for other groups, because the correlation between natives
and earlier Latin Americans and Africans and the instrument is zero.
28Thefirst-stageR20sfor earlier Asians is 0.97 and for earlier Europeans and Australians is 0.98. 29The magnitude of this effect is similar to the employment effect found in Card (2001).
30Card (2007) and Ottaviano and Peri (2007) take account of potential migration responses of natives but
6
Conclusion
This paper presents new evidence on the impact of less-skilled Latin American immigration on the wages and employment of natives and earlier immigrants in the U.S. using data from the 1980, 1990 and 2000 Census as well as a “2005” cross-section from the American Community Surveys. OLS estimates show positive wage and employment effects of Latin American immigration on both natives and earlier immigrants. However, since these OLS results are likely to be biased due to endogenous immigration, we exploit immigration from Central America to close-by U.S. states following Hurricane Mitch. Aside from the Mariel boatlift, this is the only other study on immigration based on a natural experiment for the U.S. Yet, unlike the Marielitos, who were not legalized until half a decade later and stigmatized as criminals or mentally ill, Mitch refugees were quickly allowed to legally work and viewed as driven individuals, so they were more likely to compete in the labor market with natives and previous immigrants. In contrast to the OLS results, the IV results suggest that less-skilled immigration only increases the wages of skilled natives but have no effect on employment.
Even IV estimates that eliminate biases due to endogeneity may be biased due to out-migration by natives or earlier immigrants. While we do not find out-migration by natives or earlier Latin Americans or Africans due to the arrival of immigrants after Mitch, ear-lier Asian and European and Australian immigrants do move further away from Central America after Mitch. When we control for internal migration responses by earlier Asian and European and Australian immigrants, we no longer find wage effects. More importantly, the results that control for out-migration now show negative employment effects on earlier Latin American immigrants. The results show that earlier Latin Americans are displaced by recent immigrants from this region who can easily substitute them.
The results highlight the importance of properly controlling for the potential biases that arise in area studies of immigration. In particular, it is not only crucial to control for the endogeneity of immigration, but also to deal with potential out-migration or reduced migration not only by natives but also by previous immigrants. Few immigration studies deal with the potential out-migration response by previous immigrants, but our study shows that failing to do so generates misleading results.
Data Appendix
Census Data
We use the 1% publicly available random samples of the U.S. Censuses for the years 1980, 1990, and 2000. We do not use 1960 because in this year, the Census did not ask year since arrival to the U.S., so that we are unable to separate recent from earlier immigrants. We do not use the 1970 either because the number of weeks and hours worked was reported in a different way this year compared to the 1980-2000 Censuses.
Hourly Wages
To construct our hourly wage measure, we divide the yearly earnings by average weeks worked per year and average hours worked per week. Since the information on annual earnings is top-coded using different amounts for every year, we instead use a uniform criteria and we top code at the 99th percentile for all years and eliminate those observations whose yearly earnings are above the 99th percentile for each year. Also, while for 1980, 1990, and 2000 we have information on the exact average number of weeks and hours worked per week, the 1970 Census provides instead six 13-week intervals (e.g., 1-13, 14-26, etc.) and eight 14-hour intervals (e.g., 1-14, 15-29, etc.) for the average number of weeks and hours worked, respectively.
Education Groups
Individuals were divided into three education groups: high school dropouts, high school graduates and college educated. We constructed these groups using information on years of education as well as information on whether individuals earned a degree. The year of education variable puts the person into one of 9 categories: no school or preschool; grades 1-4; grade 5-8; grade 9, grade 10, grade 11, grade 12; 1-3 years of college, more than 4 years of college. For thefirst three groups we assign 0, 3, and 7 years of schooling, while for the last two categories we assign 14 and 16 years of schooling. To distinguish high school dropouts from high school graduates we use information on whether the individual earned a degree. Thus, a person with 12 years of schooling but who has not earned a degree is classified as a dropout, while those with 12 years of schooling and who have earned a degree are classified as high school graduates.
American Community Survey (ACS) Data
The ACS are monthly rolling samples of household that were designed to replace the Census long form. The ACS sample design approximates the Census 2000 long form sample design. It over-samples areas with smaller populations. Each month a systematic sample is drawn to represent each U.S. county and this selected monthly sample is mailed the survey. Non-respondents are contacted by phone using a computed assisted telephone interview
(CATI) system a month later. Then, a third of the non-respondents to both the mail and telephone interviews are contacted in person using a computed assisted personal interview (CAPI) system. The weights included with the ACS for the household and person-level data adjust for the mixed geographic sampling rates, non-response, and individual sampling probabilities.
Nationally representative ACS data have been available every year since 2000. We use the 2003, 2004, and 2005 American Community Surveys. The 2003 ACS is a 1-in-236 national random sample of the population; the 2004 ACS is a 1-in-239 national random sample of the population; and the 2005 ACS is a 1-in-100 national random sample of the population. The sampling unit of the ACS is the household and all persons residing in the household. The data do not include persons in group quarters. In 2003 the sample consisted of 482,000 households and 1,194,000 person records. In 2004, the sample consisted of 514,830 households and 1,194,354 person records. In 2005, the sample was larger with 1,159,000 households and 2,878,000 person records. However, the public use samples of the ACS are smaller as they are sub-samples from the Census Bureau’s larger internal files.
Due to confidentiality, the smallest geographic unit identifiable in 2003 and 2004 was the state and in 2005 the PUMA, which is a geographic unit containing at least 100,000 individuals.
CPI Data
The consumer price index (CPI) comes from the Bureau of Labor Statistics. The base period for the index is 1982-1984=100. The average CPI is 82.4 for 1980; 130.7 for 1990; 172.2 for 2000; 184 for 2003; 188.9 for 2004; and 195.3 for 2005.
Distance Information
Our distance variable measures average straight-line miles from all the capital cities of Central America (Tegucigalpa, Managua, Guatemala City, and San Salvador) to the Southernmost city in each state. Appendix Table A.1 reports the distance from each of the capital cities and the average from all four capital cities to each states’ Southern-most city.
References
[1] Aguirre, B., Rogelio Saenz, and Brian Sinclair James. 1997. “Marielitos Ten Years Later: The Scarface Legacy,”Social Science Quarterly, 78(2): 487-507.
[2] Altonji, Joseph and David Card. 1991. “The Effects of Immigration on the Labor Mar-ket Outcomes of Less-Skilled Natives,” in John Abowd and Richard Freeman, eds.,
Immigration, Trade and Labor. Chicago: Chicago University Press.
[3] Angrist, Joshua and Alan Krueger. 1999. “Empirical Strategies in Labor Economics,” in Orley Ashenfelter and David Card, eds., Handbook of Labor Economics, Vol.3A.
Amsterdam, New York and Oxford: Elsevier Science, North-Holland.
[4] Angrist, Joshua and Adriana Kugler. 2003. “Protective or Counter-Productive? Labour Market Institutions and the Effect of Immigration on EU Natives,” Economic Journal, 113: F302-F331.
[5] Bean, Frank and Daniel Hamermesh. 1998. Help or Hindrance? The Economic Impli-cations of Immigration for African-Americans. New York: Russell Sage Foundation
[6] Borjas, George, Jeffrey Grogger and Gordon Hanson. 2008. “Imperfect Substitution Between Immigrants and Natives: A Reappraisal,” NBER Working paper No. 13887.
[7] Borjas, George, Jeffrey Grogger and Gordon Hanson. 2006. “Immigration and African-American Employment Opportunities: the Response of Wages, Employment and Incar-ceration to Labor Supply Shocks,” NBER Working paper No. 12518.
[8] Borjas, George and Lawrence Katz. 2007. “The Evolution of the Mexican-born Work-force in the United States,” in George Borjas, Ed., Mexican Immigration in the U.S., University of Chicago Press.
[9] Borjas, George. 2005. “Native Internal Migration and the Labor Market Impact of Immigration,” NBER Working Paper No. 11610.
[10] Borjas, George. 2003. “The Labor Demand Curve is Downward Sloping: Reexamining the Impact of Immigration on the Labor Market,” Quarterly Journal of Economics, 118(4): 1335-1374.
[11] Borjas, George. 2002. “Assimilation, Changes in Cohort Quality, and the Earnings of Immigrants,” in Klaus Zimmerman and T. Bauer, eds., The Economics of Migration: Assimilation of Migrants. Sheltenham , U.K. and Northampton, Mass.: Elgar.
[12] Borjas, George, Richard Freeman and Lawrence Katz. 1997. “How Much Do Immi-gration and Trade Affect Labor Market Outcomes?,” Brookings Papers on Economic Activity, 0(1): 1-67.
[13] Borjas, George, Richard Freeman and Lawrence Katz. 1996. “Searching for the Effect of Immigration on the Labor Market,” American Economic Review, 246-251.
[14] Bovardsson, Orn, Hendrik Van den Berg and Joshua Lewer. 2008. “Measuring the Effects on Labor Demand: A Reexamination of the Mariel Boatlift,” forthcoming in Labour Economics.
[15] Card, David. 2007. “How Immigration Affects U.S. Cities,” CReAM Discussion Paper Series No. 11/07.
[16] Card, David. 2001. “Immigrant Flows, Native Outflows, and the Local Labor Market Impacts of Higher Immigration,” Journal of Labor Economics, 19(1): 22-64.
[17] Card, David. 1990. “The Impact of the Mariel Boatlift on the Miami Labor Market,”
Industrial and Labor Relations Review, 43: 245-257.
[18] Card, David and John DiNardo. 2000. “Do Immigrant Inflows Lead to Native
Out-flows?,” American Economic Review,90(2): 360-367.
[19] Carrington, William and DeLima, Pedro. 1996. “The Impact of 1970s Repatriates from Africa on the Portuguese Labor Market,” Industrial and Labor Relations Review, 49: 330-347.
[20] Cortes, Patricia. 2008. “The Effects of Low-Skilled Immigration on US Prices: Evidence from CPI Data,” Journal of Political Economy, 116(3): 381-422.
[21] Food and Agriculture Organization of the United Nations (FAO). 2001. Analysis of the Medium-term Effects of Hurricane Mitch on Food Security in Central America. Rome: FAO.
[22] Friedberg, Rachel. 2001. “The Impact of Mass Migration on the Israeli Labor Market,”
Quarterly Journal of Economics, 116(4): 1373-1408.
[23] Friedberg, Rachel and Jennifer Hunt. 1995. “The Impact of Immigrants on Host Country Wages, Employment and Growth,” Journal of Economic Perspectives, 9: 23-44.
[24] Hunt, Jennifer. 1992. “The Impact of the 1962 Repratriates from Algeria on the French Labor Market,” Industrial and Labor Relations Review, 45: 556-572.
[25] LaLonde, Robert and Robert Topel. 1991. “Labor Market Adjustments to Increased Immigration,” in John Abowd and Richard Freeman, eds., Immigration, Trade and Labor. Chicago: Chicago University Press.
[26] Lewis, Ethan. 2005. “Immigration, Skill Mix and the Choice of Technique,” Federal Reserve Bank of Philadelphia Working Paper No. 05-08.
[27] Mayda, Anna Maria. 2005. “Who Is Against Immigration? A Cross-country Investiga-tion of Individual Attitudes Towards Immigrants,”Review of Economics and Statistics, 88(3): 510-530.
[28] Migration News. 1999. Hurricane Mitch. UC Davis. (http://migration.ucdavis.edu/mn/more.php?id=1721 0 2 0).
[29] Morris, Saul, Oscar Neidcker-Gonzales, Calogero Carletto, Marcial Munguia and Quentin Wodon. 2000. “Hurricane Mitch and the Livelihood of the Rural Poor in Hon-duras,” World Bank, Mimeo.
[30] Ottaviano, Gianmarco and Giovanni Peri. 2008. “Immigration and National Wages: Clarifying the Theory and the Empirics,” NBER Working Paper No. 14188.
[31] Ottaviano, Gianmarco and Giovanni Peri. 2007. “The Effects of Immigration U.S. Wages and Rents: A General Equilibrium Approach,” Mimeo.
[32] Ottaviano, Gianmarco and Giovanni Peri. 2006. “Rethinking the Effects of Immigration on Wages,” NBER Working Paper No. 12497.
[33] Schoeni, Robert. 1996. “The Effect of Immigrants on the Employment and Wages of Native Workers: Evidence from the 1970s and 1980s,” Mimeo, Rand.
[34] Tobar, Hector. 1999. “Painful Exodus Follows Hurricane’s Havoc Immigration: Hordes Fleeing Mitch’s Devastation Set Sights on Rio Grande,” Los Angeles Time. (http://www.uwsa.com/pipermail/uwsa/1999q1/017734.html).
[35] Turk, Michele. 1999.After Hurricane Mitch, Hondurans’ Hopes for Future Tied to U.S.
[36] U.K. National Meteorological Office. 2004. Hurricane Mitch Fact Sheet. (http://www.metoffice.com/sec2/sec2cyclone/tcbulletins/mitch.html).
[37] U.N. Economic Commission for Latin America and the Caribbean. 2001. Social Panorama of Latin America 2000-2001. Santiago, Chile: ECLAC. (http://www.eclac.cl/publicaciones/DesarrolloSocial/8/:CG2138PI/PSI2001 chap1.pdf).
[38] USAID. 2004. Hurricane Mitch: Program Overview. El Salvador: USAID.
[39] U.S. Department of Justice. 1998. News Release: Honduras, Nicaragua Desig-nated for Temporary Protected Status Following Devastation from Hurricane Mitch. (http://www.rapidimmigration.com/www/news/news 295.html).
[40] U.S. National Weather Service. 1999. Preliminary Report: Hurricane Mitch. (http://www.nhc.noaa.gov/1998mitch.html).
[41] World Bank. 2001. Hurricane Mitch: The Gender Effects of Coping with Crisis. Wash-ington, D.C.: World Bank.