Transportation Research Procedia 14 ( 2016 ) 2297 – 2305
2352-1465 © 2016 The Authors. Published by Elsevier B.V. This is an open access article under the CC BY-NC-ND license (http://creativecommons.org/licenses/by-nc-nd/4.0/).
Peer-review under responsibility of Road and Bridge Research Institute (IBDiM) doi: 10.1016/j.trpro.2016.05.246
ScienceDirect
6th Transport Research Arena April 18-21, 2016
Single unprotected road user crashes: Europe we have a problem!
Rob Methorst
a, Rob Eenink
a,*, Joao Cardoso
b, Klaus Machata
c, Jacek Malasek
daRoad Safety Institute SWOV, PO Box 93113, 2509 AC The Hague, the Netherlands bLaboratórionNacional de Engenharia Civil, Avenida do Brasil, 101, 1700-066 Lisboa, Portugal
c
Kuratorium für Verkehrssicherheit, Schleiergasse 18 A-1100 Wien, Austria
dRoad and Bridge Research Institute, 1 Instytutowa Str., 03-302 Warsaw, Poland
Abstract
Unprotected Road Users (URU) are a subset of Vulnerable Road Users (VRU) who are not protected in their vehicles: pedestrians, cyclists and powered two-wheelers. EU statistics for 2014 show that their share in road traffic fatalities was 22% for pedestrians, 8% for cyclists and 18% for Powered Two-Wheelers, in total 47% of the fatalities. From explorative studies regarding injured road traffic casualties it is found that about two thirds of the transportation casualties are Unprotected Road Users, of which two thirds are single accidents, i.e. crashes where no other road user is involved. Most of these single crashes are not (yet) detected in the standard police reported accident statistics, but do represent costs to society that probably exceed crash costs of car related crashes. It can be expected that the shares of URU fatal and injury crashes will increase, particularly because of the ageing of the population, urbanization and despite ICT/ITS developments. Some of these crashes can be prevented by relatively simple measures, others need more investments e.g. infrastructure, legislation or enforcement. From a policy point of view it will be wise to address this issue, not only for road safety reasons, but also because the elderly are getting more numerous and a serious economic and political factor.
© 2016The Authors. Published by Elsevier B.V..
Peer-review under responsibility of Road and Bridge Research Institute (IBDiM).
KeywordsRoad safety; elderly; urbanisation; serious injuries; vulnerable road users; cycling; pedestrians
* Corresponding author. Tel.: +31703173375
E-mail address:rob.eenink@swov.nl
© 2016 The Authors. Published by Elsevier B.V. This is an open access article under the CC BY-NC-ND license (http://creativecommons.org/licenses/by-nc-nd/4.0/).
1. Introduction
In the 1970s, at the time that the number of road casualties peaked because of increased motorisation, in most countries the police started with systematically reporting road traffic accidents. The police primarily set this up from a legal perspective, trying to identify who of the crash participants were to blame. From the start, the police data were used to develop countermeasures. The measures were usually directed at the prevention of car-related crashes, because the vast majority of fatal crashes involved cars and safety targets were set on fatalities. It can be concluded that in most countries this was part of successful policy. In 2010 the number of EU road crash fatalities was less than a third of those in 19911. In e.g. the Netherlands and Germany it is now cut down to a level of less than one sixth of the
numbers in the 1970s.
For injury crashes the European situation is largely unclear. In their staff working document (European Commission, 2013) the EC states: “In total, some 1.5 million people are reported to be injured every year on EU roads. For every death on the roads there are an estimated four permanently disabled, ten seriously injured and 40 slightly injured people. The total number of people reported injured on roads (both slight and serious injuries) decreased by around 26% between 2001 and 2011. The number of people reported as seriously injured decreased by almost 36%. This should be compared to the reduction in road fatalities for the same period, around 43%”. In order to build a solid foundation for further policy the EC defines three steps: a common definition, more reliable data collection and setting a target. The definition is now set as MAIS3+ (Maximum Abbreviated Injury Scale 3 and more) and Member States have to report on this from 2015 onwards. The discussion on a European target is still pending.
In Austria, the Netherlands, Sweden and Norway, Hospital and Emergency Rescue data are also used to assess the volumes of bicycle and pedestrian casualties. With regard to pedestrians it became clear that the common definition of a road crash, being an event involving at least one moving vehicle, did not do justice to the number of casualties amongst pedestrians, including fatalities. About 70% (!) of the pedestrian casualties refer to single crashes while moving in public space. This share is about the same as for bicyclists. Both concern collisions with objects and falls happening in public space, while moving about, i.e. mobility in public space. As providing safe mobility is a public matter, it stands to reason to update the road crash definition to travel crashes, including single crashes in public space and possibly public transport (falls in trams and busses).
So, the perspective on transport or mobility safety is changing. If we don’t take proper account of single pedestrian and bicycle crashes it will be impossible to meet ambitious targets on serious injuries. This article aims to put some light on developments regarding the vast group of Unprotected Road Users mobility casualties, what the prospects are, what can be done and what happens if the policy actors fail to respond adequately to the developments. Obviously, in this article this wider definition of mobility crashes is adopted.
Nomenclature
URU URU = Unprotected Road Users: pedestrians, pedal cyclists, powered two-wheelers Road traffic crash A road traffic crash on a public road involving at least one moving vehicle
Singe URU crash A crash on a public road, involving no other road user than an unprotected road user Travel crashes A crash while moving about in public space, i.e. public roads and foot paths
Seriously injured An injury so severe that hospital admittance is necessary and the injury is classified MAIS2+
2. Europe, we have a problem…
2.1. Fatalities
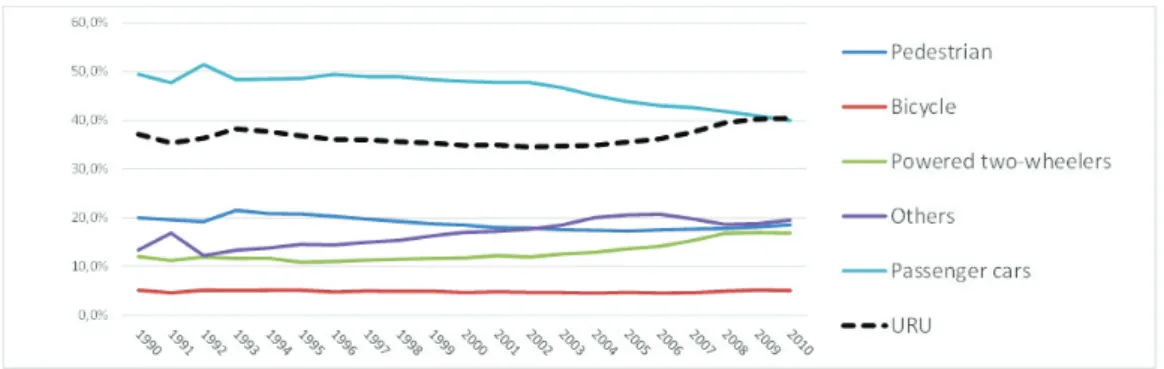
Unprotected Road Users (URU) are a subset of Vulnerable Road Users (VRU) who are not protected in their vehicles: pedestrians, cyclists and powered two-wheelers. EU statistics for 2014 show that their share in road traffic fatalities was 22% for pedestrians, 8% for cyclists and 18% for Powered Two-Wheelers, in total 47% of the fatalities. Since 1990 on the European level the share of car user fatalities has dropped from 50% to 40%, while URU’s did not
1
follow this trend. The share of Powered Two-Wheelers (PTW) fatalities increased from about 12% to 17% of the fatalities; on the European scale the shares of both pedestrians and cyclists remained fairly stable (See Figure 1).
Fig. 1. Percentage of fatalities per mode.
The total number of fatalities and the fatality risk decreased substantially over the years in European countries. The number of reportedpedestrian fatalities decreased more than average; the number of cyclist and PTW however decreased less than average. Bicycle and pedestrian fatalities mainly concern collisions with motor vehicles, impact speed being the main determinant. Powered two wheelers concern both collisions with motor vehicles and single vehicle accidents. PTW’s move faster than bicycles, and impact speeds on single accidents can easily exceed human tolerance for impacts.
With regard to accident (or better: crash) statistics it has to be kept in mind that not all crashes and casualties are included in police reporting. Not in all cases the police is made aware of a fatality or able to respond. Furthermore, single pedestrian accidents, comprising 30–60% of the pedestrian travel fatalities (Methorst, 2010; Den Hertog, 2013) are excluded of the road traffic accident definition. It is likely that in many countries the crash reporting rate (excluding pedestrian single crash fatalities) decreased from more than 95% to 90% or lower. There is also likely a bias in underreporting fatalities towards URU crashes. In the Netherlands the reporting rate was 84% in 2014. For car fatalities it was 90% (177 versus 195), but for cyclists only 72% (134 versus 185). In about 10% of the fatal bicycle crashes no motorised traffic was involved.
2.2. Injuries
Contrary to fatality crash statistics, injury crash data are not generally available on the EU level for all countries. Available crash data generally concern police reported crashes which are typically seriously underreported, particularly single crashes. For instance, in Switzerland (BFU, 2015) the police registered 3033 injured bicyclists in 2012, whereas BFU made an extrapolation of 30190, around 10 times as many. PTW crashes are slightly better reported because of insurance reasons. Severity definitions vary between countries, which makes it impossible to compare and benchmark countries in this regard. In order to be able to compare countries in this regard, the European Commission has adopted a MAIS3+ Injury target for road safety in the EU.
In this paper a wider perspective is taken: all non-deliberate injuries while traveling in public space, requiring medical attention are seen as ‘injury crashes’. First of all because of the summed impacts MAIS1 and 2 injuries (in the Netherlands MAIS1 plus MAIS2 together include almost 70% of all traffic casualties and correspond to more than twice the MAIS3+ medical costs; Den Hartog e.a., 2013). A second reason is that it is as yet impossible to operationalize MAIS3+ on an European scale.
Based on coverage assessment it can be argued that hospital data based statistics are the best alternative source for providing an overall image of the volumes of the travel casualties problem. In the Netherlands there are two data sets available: the sample based Injury Database called LIS (covering medical treatments at walk-in clinics at the hospitals in the sample) and the hospital in-patient registration called LMR (almost fully covering hospital admittances). Austria and Switzerland have LIS comparable databases; in Sweden the STRADA database includes LMR comparable data.
In some other countries such data are also present, although not publicly available. A downside of the medical data bases is that the databases do not cover important information like crash location and preconditions, and the data are not easily available.
In order to give meaning to the figures, it is useful to relate casualty figures to some measure of exposure. Mobility data are generally used for this purpose. Unfortunately mobility data on walking and cycling are notoriously underreported and biased, and their quality varies much between countries. A second best exposure measure concerns population data, which have the advantage of being very reliable and available for almost all countries. However, such data do not express mobility accurately, and by using such data for country comparison actual differences in mobility between countries are neglected.
In this paper we apply data from comparable Injury Data Bases from Austria, Switzerland and the Netherlands published in national reports taking a broad perspective on safety matters. As the data did not focus on the distinction between single crashes and crashes involving more than one road user (= multiple crash), estimations had to be made to fill in the gaps. In dedicated studies in the Netherlands by Methorst e.a. and Den Hertog e.a. the distinction was clearly made; for pedestrians and cyclists the ratio between single crashes and multiple crashes is about 3 : 1. In Winter-countries like Sweden, Austria and Switzerland particularly the ratio for pedestrian crashes can be as high as 8 : 1, because of the many casualties from falls that take place at times of snow and icy conditions (e.g. Österreichischer Verkehrssicherheitsfonds (2012)). From most studies it is also clear that the elderly do fall more often and that they are more often seriously injured than younger persons, the Austrian study states that almost every second pedestrian injured was over 60 years old.
A new phenomenon are e-bikes, which in the Netherlands are now good for 10% of the bicycle kilometres. BFU (2015) keeps track of e-Bikes in their accident statistics and for severely injured (Swiss definition) this rose from 14 in 2010 to 145 in 2014, i.e. ten times as high in 5 years. In 2014 there were 890 ‘normal’ cyclists severely injured. In general e-bike use poses higher risks because of its higher speed, its heavier mass and frailer (older) users.
In Table 1 a basic picture of injury data is presented. Like above for fatalities, on top we present the figures for all URU casualties, and below the data are split up between single crashes and multiple crashes. Again not all figures follow directly from the databases. To fill in gaps, we estimated the ratios between single and multiple crashes based on Dutch research results. Additionally we again crudely estimated the numbers of casualties on the EU28 level.
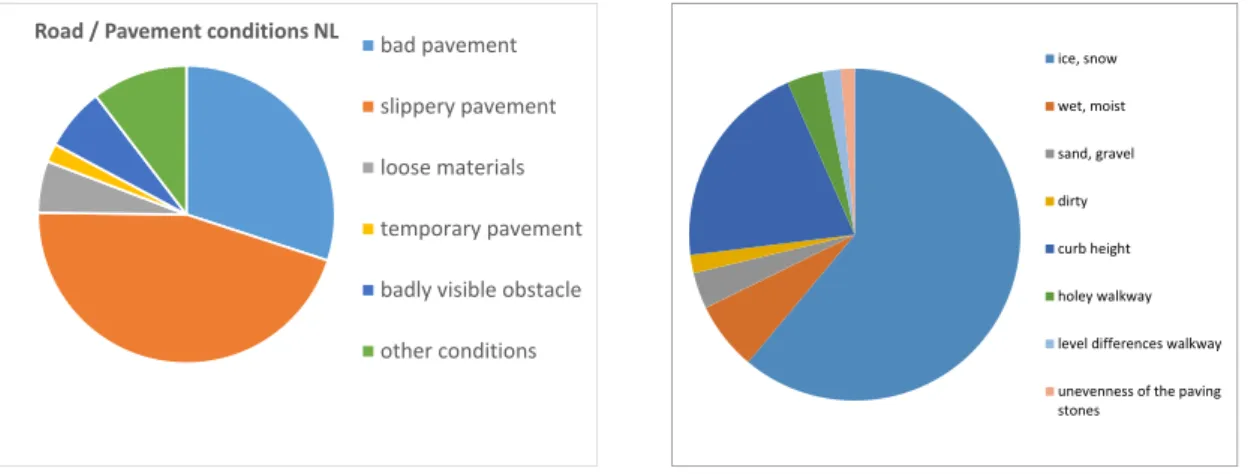
With regard to crash causes Austrian and Dutch research results point in the same direction: a dominant cause is to be found in road pavement conditions and the physical environment.
Fig. 2. Pedestrian single crash causes in NL (left) and Austria (right). Table 1. URU crash walk-in clinic injured (estimates).
Pedestrians Bicyclists Powered Two-Wheelers URU
country total number # per million total number # per million total number # per million total number # per million Road / Pavement conditions NL
bad pavement slippery pavement loose materials temporary pavement badly visible obstacle other conditions ice, snow wet, moist sand, gravel dirty curb height holey walkway level differences walkway unevenness of the paving stones
Austria 36495 4318 31643 3744 3580 424 71718 8485
Switzerland 61360 7633 30185 3755 4376 544 95921 11932
Netherlands 48000 2861 78000 4649 1267 76 127267 7585
EU28 total 145855 4384 139828 4203 9223 277 294906 8864
of which single crashes
Austria 32500 3845 22284 2637 465 55 55249 6537
Switzerland 55000 6842 18111 2253 569 71 73680 8718
Netherlands 43000 2563 54000 3218 171 10 97171 11497
EU28 total 130500 3922 94395 2837 1205 36 226100 8917
of which multiple crashes
Austria 3995 473 9359 1107 3115 369 16469 369
Switzerland 6360 791 12074 1502 3807 474 22241 474
Netherlands 5000 298 24000 1430 1096 65 30096 65
EU28 total 15355 462 45433 1366 8018 241 68806 241
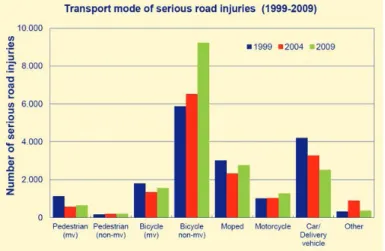
In a SWOV Factsheet (2013) the estimated real numbers of severely injured (defined as MAIS2+) per mode of transport are given for 1999. 2004 and 2009 (Figure 3)
Fig. 3. Number of serious road injuries in the Netherlands, distributed by mode of transport of the casualty; with pedestrians and cyclists also distributed by involvement of a motorized vehicle ('mv') or non-motorized vehicle ('non-mv').
In 2011 there were around 20,000 severe injuries in the Netherlands, a number that had increased since 2006 for 5 years in a row with approximately a thousand per year. Recent number for 2012 and 2013 show a slight decrease to 18,800. The major reason is an increase in bicycle crashes where no motorized vehicle is involved. In fact already in 2009 the number of serious non-motorized vehicle crashes exceeded the motorized ones.
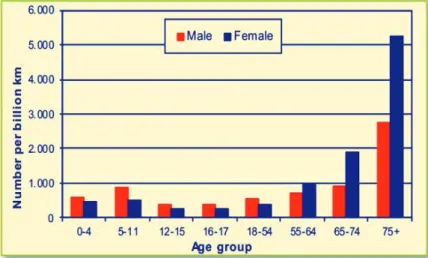
Another SWOV Factsheet-Cyclists (2013) shows the risk (seriously injured per km) of cycling per age group (see Figure 4.).
Fig. 4. Number of seriously injured cyclists by gender and age, divided by distance travelled by bicycle (in billions of kilometres) in 2005-2009.
It is clear that the risk of cycling increases rapidly with age, especially for females. The reason for this gender effect is not yet clear, it could be the nature of these crashes (falls), different bicycle types and over 75 it is likely that the average age is higher (women live longer). BFU has similar findings for their severely injured cyclists, although the differences are smaller. This could be due to differences in the definition that was used for severely injured. For fatalities the gender effect is switched, i.e. the risk for older men is higher than for women. Again for yet unclear reasons, but one has to realise that in fatal bicycle crashes a motorized vehicle is usually involved (90%) so these are different crash types.
The ITF (2013) used CARE data (i.e. police registration) to see where serious injury bicycle crashes took place (fig. 5).
Fig. 5. Percentage of all police-reported serious injury bicycle crashes occurring in urban vs. rural areas and motorways in selected EU countries.
It is clear that the vast majority (around 85%) are to be found inside the urban area. It is likely that the same is true for walking.
2.3. Social costs
The social costs of road crashes suffer from different definitions as well. The main reason is usually the way in which human costs (loss of quality of life) are calculated. In the Netherlands (De Wit & Methorst, 2012) total costs are estimated at 12.5 billion € (2% of GDP) of which 5.8 billion are related to human costs. In Switzerland (BFU, 2015) it is 4.3 billion Swiss francs of which 1.9 billion human costs. Around 1/3rdof this is related to severely injured.
In the Netherlands the total costs per seriously injured is 281 thousand € (2003) and per fatality 2.612 million €. If we realise that in 2011 there were 661 fatalities that would imply around 1.7 billion but for seriously injured (20,000) it would be 5.6 billion. So for the Netherlands the costs of single URU crashes, i.e. more than half of all seriously injured, could add up to 2,8 billion which is far more than the costs of all road fatalities.
2.4. Conclusions
The most common measure of road (un)safety is the number of fatalities. The EU has a target for fatalities and so do many EU countries. Recently, many countries and the EU realised that fatalities do not tell the whole story and serious injuries are targeted as well. Besides that, (slight) injuries and total (social) costs are considered vital elements of road safety. So far, no clear EU-figures are available on these indicators but the EU is rightfully aiming at harmonisation of the severe injuries definition (i.e. MAIS3+). Data and knowledge that is available from countries like Austria, Switzerland, the Netherlands and Sweden, indicate that single pedestrian and bicycle crashes are a far more important issue than anticipated so far. In the Netherlands many people cycle and that is one of the reasons that the costs of crashes without motorized vehicle involvement are far higher than all (!) social costs of fatalities. In other countries this may well be true because of single pedestrian crashes. It is clear from these data that single unprotected road user crashes are overrepresented among the elderly and inside urban areas.
3. A problem, that will get worse…
The European SUNflower project produced a target hierarchy for road safety, the ‘SUNflower pyramid’ in which the basis is the structure and culture of a country under consideration. A vital part of this are societal trends. The European project PROS recently formulated research priorities for Horizon2020 road safety research and considered the most important societal trends. Two of these trends are likely to have a major negative impact on URUs: ageing and urbanisation.
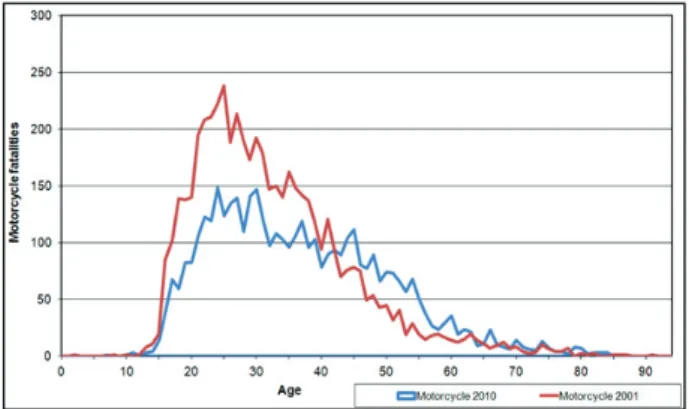
PROS states “In Europe already today 16% of the population exceeds 65 years, projected to increase to around 22% in 2030”. In Austria (section 2.2) already almost half of all injured pedestrians are over 60 years old. In the Netherlands cyclists’ risk to get seriously injured (or killed) is increasing rapidly with age. In ERSO (2012, Figure 6) we can see the development of the age distribution of motorcycle fatalities in Europe.
Apparently, the center of gravity has shifted from early twenties to late twenties in less than a decade, with a substantial increase for ages around 50. Nevertheless, the share of over 60 is still rather small.
According to PROS about half of the world’s population is now living in cities (2011) and this will grow to 2/3rd
in 2025. In Europe already 68% lives in a city and this share will also rise in the next years and decades. In Figure 5. we saw that already 85% of serious injury bicycle crashes were inside the urban area and it is likely that something similar is true for pedestrians. It is therefore unavoidable that this urbanisation trend will lead to larger shares and maybe even numbers, of single bicycle and pedestrian (serious) crashes.
4. A problem we can and must do something about…
The pedestrians single crash distributions in Figure 2. show that between 55 and 75 percent of these crashes are related to walkway surface issues. Between 45 and 55% of the crashes concern slippery surfaces (ice, snow, wet or greasy slippery surfaces etc.), at least 7% concern unseen obstacles and differences in height in the surface, and 3 to 6% concern loose materials like sand and gravel. Such causes relate to either bad walkway design or inadequate management and maintenance of the walkways. Particularly because of the ageing of the population the number of crashes is likely to increase substantially. Because of progressing urbanisation, the crashes will dominantly happen in urban conditions. The first thing that needs to be done is to raise awareness of the seriousness of the problem of pedestrians single crashes. Collecting better data about such crashes is a prime concern. A second matter is finding out where walkway conditions pose serious single crash risks. Walkway survey and public involvement is needed for detecting the poor conditions. A third matter to be dealt with is the organisation of the improvement and maintenance of walkways and pedestrian crossings. The design of pedestrian facilities needs to be structured; knowledge and professional skills to solve problems needs to be upgraded; resources for improvements need to be made available; co-operation and partnerships with regard to the monitoring walkway conditions, getting rid of obstacles and garbage, management of public space etc. need to be set up. On the short run needful measures are good quality marking of building sites on sidewalks and the installation of guidance systems for barrier free bypasses for steep slopes / ramps and stairs (which are also a serious problem for wheelchair users); on the medium term it is advisable to organise the prevention of vehicles (partially) blocking sidewalks or path and increase the use of tactile ground information; on the longer term fixed barriers on the sidewalk need to be avoided, traffic signs to be attached at ı2.2 m from the sidewalk surface and compliance with general width for sidewalks ı2m needs to be delivered; additional requirements are separation of pedestrian and bicycle paths, setting longer and more frequent green traffic signal for pedestrians, and improvement of lighting for pedestrians (Furian e.a., 2011). Walking and sojourning in public space policies on the city level should also focus on upgrading walkways and crossing particularly routes to and from important destination of the elderly, such as public transport stops, neighbourhood shopping centres, health care centres and meeting points; enforcing obstacle free walkways by moving away illegally parked cars, bicycles and commercial displays; organising winter maintenance, i.e. clearing snow and ice from sidewalks in co-operation with residents.
Wearing a bicycle helmet is one of the few protective measures a cyclist is able to take for himself. For single bicycle crashes the helmet can be effective in preventing serious head and brain injuries. The vehicle itself has hardly changed with respect to safety, the e-bike being neutral to safety at best. Lowering the centre of gravity could help and so would adding an extra wheel (bike turns into trike). Both the helmet and the trike, however, are unpopular measures, but, wasn’t that true for the seat belt as well? Also here, the most promising range of measures is in the infrastructure. Infrastructure plays a part in around half of all single vehicle cycling crashes in the Netherlands (mostly in combination with other factors). Over the coming years, removing and improving visibility of obstacles, a better quality of road surface and road shoulder (level and free of slippery materials), sufficient road width, maintenance, adequate measures against slippery road conditions in winter, amongst others, could contribute to the prevention of single-vehicle crashes. On a network level it could be helpful to have different cycling and car routes, i.e. use residential (low-speed!) areas for cycling rather than offering them a separate cycle path alongside a distributor road that inevitably has to cross these busy roads. The quality of road design and road surface (maintenance) is often better on roads that are also used by cars and this favours cycling safety with respect to bicycle only crashes. There is, however, a trade off with preventing the rarer but also more severe conflict between cars and bicycle, for which a separate cycle path is a better solution.
Connectivity (ITS) is a major trend in mobility (PROS, 2013). A distinction should be made between ITS (intelligent transport systems) for the vulnerable (unprotected) road user itself and ITS-applications in motorized (non-PTW) vehicles that prevent or mitigate crashes with URU’s. Both types are dealt with in the EU-project VRUITS (improving the safety and mobility of vulnerable road users through ITS applications). In D4.1 Usability assessment of selected applications, four solutions are prioritized. Only one of these addresses bicycle only crashes, the cyclist digital bicycle rear view mirror, that will detect cars but also other cyclists or PTWs. By nature, the second type is not relevant to single URU crashes. However, the ultimate ITS application is probably the autonomous vehicle, irrespective of its connectivity to other vehicles or infrastructure. An ITF study (2015) on the effects of two types of self-driving (shared or single passenger) vehicles on urban mobility shows a few interesting (implicit) developments for pedestrians, cyclists and especially the aged ones. Easy access to self-driving options will allow aged pedestrians who now have to walk to public transport to be picked up at home. From a health perspective this might not be positive, but the expected decreased exposure will be positive for their road safety. Less debatable is the huge amount of free parking space fleets of self-driving vehicles will create. This public space could be used for massive improvements in walking and cycling infrastructure in cities.
Fairly soon one in four EU citizens will be over 65 (PROS, 2013). Because in most countries one can vote from 18 years onwards, the 65+ share amongst voters will be close to a third and because they have more time (and money) available, therefore, their societal and political power is likely to increase. Many of the suggested effective single URU measures must be taken by local governments (road authorities). This is another reason why sensible road safety policy needs to include single URU crashes prevention.
References
BFU (2015) Status 2015 – Statistics on non-occupational accidents and the level of safety in Switzerland. BFU – Swiss Council for Accident prevention, Berne.
European Commission (2013). On the implementation of objective 6 of the European Commission’s policy orientations on road safety 2011-2020 – First milestone towards an injury strategy. SWD(2013) 94 final, Brussels
European Road Safety Observatory (ERSO). Traffic Safety Basic Facts 2012. Motorcycles and mopeds
Feypell-De la Beaumelle, V., Papadimitriou, E. & Granié, M-A. (2010). Pedestrian safety data. In: Methorst, R. et al. (Eds.) (2010) Pedestrian Quality Needs (PQN) Final Report of the COST Project 358, Walk21, Cheltenham. www.walkeurope.org
Furian, G., Kühnelt-Leiddihn, A. & Bauer, R. (2011) Das Unfallrisiko auf Fuȕwegen in Österreich. KFV, Östereichischer Verkehrssicherheitsfonds, Wien.
Hertog, P. den, Draisma, C., Kemler, E., Klein Wolt, K., Panneman, M. & Methorst, R. (2013) Ongevallen bij ouderen tijdens verplaatsingen buitsenshuis. VeiligheidNL / Rijkswaterstaat, Amsterdam/Delft.
International Transport Forum/OECD (2013). Cycling, Helth and Safety. OECD Publishing/ITF
International Transport Forum/OECD (2015). Urban Mobility System Upgrade How shared self-driving cars could change city traffic. OECD Publishing/ITF
Matthijs Koornstra, David Lynam, Göran Nilsson, Piet Noordzij, Hans-Erik Petterson, Fred Wegman and Peter Wouters. SUNflower: A comparative study of the development of road safety in Sweden, the United Kingdom, and the Netherlands. Leidschendam (2002) Körmer, C. and Smolka, D. (2009). Injuries to Vulnerable Road Users - Including Falls in Pedestrians in the EU - A Data Report. Kuratorium für
Verkehrssicherheit (Austrian Road Safety Board), Bereich Heim, Freizeit und Sport (Division Home, Leisure and Sports), Vienna.
Methorst, R., Essen, M. van, Ormel, W. & Schepers, P. (2010) Letselongevallen van voetgangers en fietsers – Een verrassend beeld! Rijkswaterstaat Dienst Verkeer en Scheepvaart, Delft.
Methorst R. (2010). Evaluation of the pedestrian’s performance and satisfaction. In: Methorst, R., Monterde i Bort, H., Risser, R., Sauter, D., Tight, M. & Walker, J. (Eds.) (2010) Pedestrian Quality Needs (PQN) Final Report of the COST Project 358, Walk21, Cheltenham. www.walkeurope.org; Part B5.9 pp 149-179.
Öberg, G. (2011). Skadade Fotgängare. VTI rapport 705, Linköping.
OECD/ITF (2011) Pedestrian Safety, Urban Space and Health – Research Report. OECD-ITF, Paris.
Österreichischer Verkehrssicherheitsfonds (2012). Road safety in Austria - annual report 2011, bmvit – Federal Ministry for Transport, Innovation and Technology, Vienna.
PROS, Priorities for Road Safety Research in Europe (2013). Deliverable D1.1 Review of societal trends and scenarios influencing the scope and boundary conditions for road safety research.
SWOV. Serious road injuries in the Netherlands. SWOV Factsheet February 2013 SWOV. Cyclists. SWOV Factsheet August 2013
VeiligheidNL (2013) medical costs figures from the Letsel Last Model.
VRUITS, improving the safety and mobility of Vulnerable Road Users through ITS applications (2014), Deliverable D4.1 Usability assessment of selected applications
Wit, M. de & Methorst, R. (2012). Kosten verkeersongevallen in Nederland; Ontwikkelingen 2003-2009. Directoraat-Generaal Rijkswaterstaat, Dienst Verkeer en Scheepvaart DVS, Delft.