MPRA
Munich Personal RePEc Archive
An Analysis of Cambodia’s Trade Flows:
A Gravity Model
Kim, Sokchea
28. August 2006
Online at
http://mpra.ub.uni-muenchen.de/21461/
An Analysis of Cambodia’s Trade Flows: A Gravity Model
Kim Sokchea†
Email: sokcheak@iuj.ac.com Aug. 28, 2006
ABSTRACT
This paper aims at investigating the important factors affecting Cambodia’s trade
flows to major 20 trading countries from 1994 to 2004. The analysis employs a
gravity model with some modifications. Assuming that other factors are constant, the
results indicate that the trade flows significantly depend on the economic sizes of both
the exporting and importing countries and Cambodia appears to trade more with
neighboring countries. In addition, the tests also detect the significant negative impact
of exchange rate volatility on the trade flows as well as aggregate exports; however,
there is little evidence that the depreciation of Cambodia’s currency, the riel, affects
its exports. Nonetheless, the tests using sub-period samples suggest that the positive
impacts of bilateral exchange rate depreciation are found significant in sub-period I
(1994-1998), but not in sub-period II (1999-2004). Finally, the paper also shows
consistent findings that ASEAN membership play little role in boosting trade flows in
the region; however, the results in sub-period II suggest that ASEAN membership
helps improve border trade which suffered from Asian financial crisis.
Keywords: Trade flows, gravity model, exchange rate volatility, aggregate exports,
bilateral exchange rate depreciation, ASEAN, Asian financial crisis.
† I sincerely thank the audience of the 9th socio-cultural research congress conference for helpful comments.
1. Introduction
1.1. Cambodian trade flows
In the South-East Asia is Cambodia, one of the developing countries, which
completely transformed from a centrally planned to a free-market economy in 1993 a few
years after the end of the cold war. Prior to the Paris Peace Accord of 1991, Cambodia
faced an economic slump with high inflation and severe exchange rate depreciation due to
the creation of money to finance budget deficit (IMF, 2004). Since the attainment of
political stability in 1993, Cambodia has carried out several institutional and economic
reforms, one of which has been attempted to open the economy through free-market
mechanism. With great efforts, Cambodia became a full member of the Association of
South-East Asian Nations (ASEAN) in the late 1999, and was admitted to the World
Trade Organization (WTO) in the late 2003.
According to the World Bank’s WDI (World Development Indicators 2005),
Cambodian economic performance has been amongst the best averaging 7.1 percent
during 1993-2004 compared to other developing countries. The real GDP growth reached
the peak of 12.3 percent in 1999, but slowed to 5.2 percent in 2002 due to internal
political instability before the third parliamentary election. However, the economy
recovered rapidly after the election reaching 6.9 and 7.8 percent in 2003 and 2004,
respectively. At the same time, Cambodia’s trade increased from 49 percent of GDP in
1993 to 126 percent of GDP in 2004 (see Figure 1). The upsurge of foreign trade was
obtained by an increase in both exports and imports at an annual rate of about 27 percent
and 15 percent, respectively, for more than a decade.1
Figure 1 shows the trends of trade as percentage of GDP, total exports and total
imports from 1993 to 2004. Although the share of trade as percentage of GDP has
1 The real growth rates and the annual growth rates of import and export are calculated by the author using
drastically risen, trade values with ASEAN countries before and after Cambodia’s
ASEAN membership acquired are comparable. Furthermore, Cambodia has suffered from
a huge trade deficit over a decade. Nonetheless, the deficit was improved during 1997 and
2001 due to a drastic slow-down in imports resulting from the Asian financial crisis in
1997. At the same time, export has picked up at a smooth growth, indicating that
Cambodia’s export markets were not severely affected by the crisis.
Figure 1: Trends of Trade, Export and Import from 1993 to 2004
0 500 1000 1500 2000 2500 3000 3500 4000 1993 1994 1995 1996 1997 1998 1999 2000 2001 2002 2003 2004 Time M il li o n U S $ 0% 20% 40% 60% 80% 100% 120% 140% P e rc e n ta g e o f G D P
Export (Left Scale) Import (Left Scale)
Trade (Right Scale) Trade with ASEAN (Right Scale) Source: IMF’s DOTS (2005) and World Bank’s WDI (2005)
Cambodia has exported to several countries in the world, and a significant change
in export direction has been observed during the 1994-2004 period. Exports to industrial
countries absorbed 90 percent of total exports in 2004 compared to about 15 percent in
1994, whereas exports to developing countries dropped to 10 percent from 84 percent
during the same period (IMF’s DOTS, 2005). The direction of exports has been reversed
to higher income countries.
Additionally, the regional distribution of Cambodian exports is importantly
noticeable. In 2004, Cambodia directed the largest share of exports to the U.S.,
to the EU, and only 9 percent to Asia, of which 7 percent to ASEAN countries (IMF’s
DOTS, 2005). Definitely, garment exports are the largest foreign currency earner, which
accounted for about 80 percent of total exports. And, 70 percent of garment exports was
to the U.S. in 2002.
Figure 2 shows the trends of Cambodia’s total exports to the world, the U.S., the
EU, and ASEAN from 1993 to 2004. Total exports were stable during 1993 and 1996 and
increased at a higher speed ever since. Exports to ASEAN countries recorded the largest
amount up to 1999 until those to the U.S. have taken the first place, while those to the EU
has kept on a gradual rise since 1993. Cambodian exports to ASEAN hit the lowest-ever
value, US$76 million in 2000 and 2001, one year after Cambodia’s full ASEAN
membership was acknowledged. Nonetheless, the amount has gradually gone up to
approximately US$200 million in 2004. This was due to significant increase in
Cambodian exports to Vietnam, especially. Thus, it is questionable whether or not
Cambodia economically benefits from ASEAN membership.
Figure 2: Trends of Total Exports to the World, the U.S., the EU, and ASEAN from 1993 to 2004. 0 500 1000 1500 2000 2500 3000 1993 1994 1995 1996 1997 1998 1999 2000 2001 2002 2003 2004 Time M il li o n U S $
World U.S. EU ASEAN
Source: IMF’s DOTS (2005)
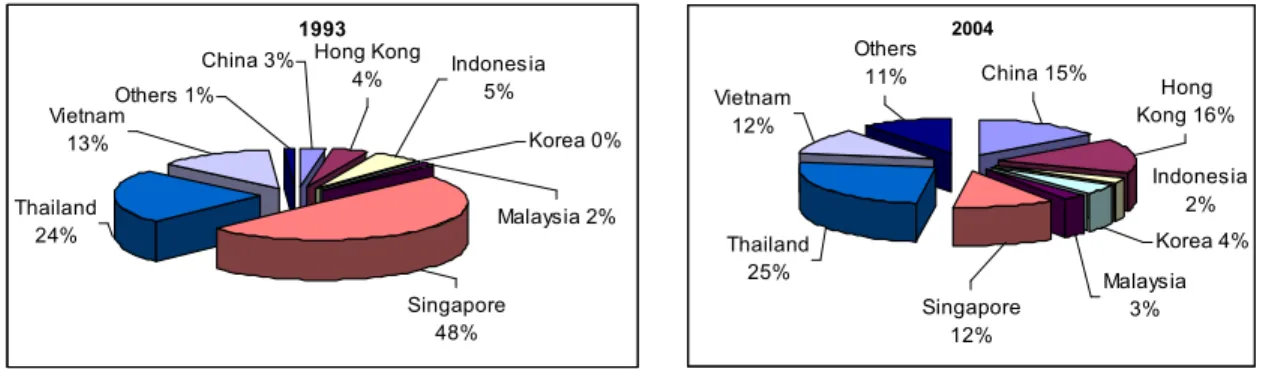
Reversely, Cambodia has imported from developing countries more than from
slightly up from 87 percent in 1993. Figure 3 illustrates the import shares of total
Cambodian imports from major Asian countries in 1993 and 2004. Singapore was the
biggest exporter, who exported about half of the total amount that Cambodia imported
from Asia in 1993; however, Thailand ranked first in 2004, whose exports amounted
roughly US$ 0.8 billion, 25 percent of total Cambodian imports from Asia. In addition,
Cambodian imports from Hong Kong and China significantly increased to 16 and 15
percent in 2004, respectively, from 4 and 3 percent in 1993. Besides Korea, the import
shares from Thailand, Vietnam, Malaysia, and Indonesia remained roughly unchanged.
Figure 3: Cambodian Import Shares from Major Asian Countries in 1993 and 2004 (percentage of total imports from Asia)
1993 Singapore 48% Thailand 24% Vietnam 13% Indonesia 5% Korea 0% Malaysia 2% Hong Kong 4% China 3% Others 1%
Source: IMF’s DOTS (2005)
2004 Korea 4% Singapore 12% Malaysia 3% Indonesia 2% Hong Kong 16% China 15% Others 11% Vietnam 12% Thailand 25% 1.2. Objectives of research
Several economists argue that Cambodian exports mainly count on the garment
sector which makes up 80 percent of total exports. And, this sector may significantly
depend on the quotas and favorable conditions provided by the U.S. and the EU.
However, there is a debate on whether there are various important factors that determine
Cambodia’s trade flows. Since several theoretical and empirical studies have been
flows2, one may ask whether the bilateral exchange rate between Cambodia’s currency
and the trading partners’ currencies matters.3
Against this background, this present paper aims at investigating the significant
factors that determine Cambodia’s trade, especially its exports. The study employs a
gravity model which has been widely recognized as a successful tool to predict the
volume of trade across country pairs by empirical researchers. After the theoretical
foundation derived from the properties of expenditure systems by Anderson (1979),
Evenett and Keller (2002) employ the Heckscher-Ohlin theory and the increasing returns
theory to explain the success of this model. Neak (2005) also employs this model to
investigate the relationship between foreign direct investment (FDI) and Cambodia’s
trade; however, the estimates may be biased due to omitted variable problems and the use
of nominal values of trade and FDI without correcting for price changes.
Specifically, this paper is designed to examine the determinants of Cambodia’s
trade flows to 20 major trading partners (Australia, Belgium, Canada, China, Hong Kong
(China), France, Germany, Ireland, Italy, Japan, Korea, Malaysia, Netherlands,
Singapore, Spain, Switzerland, Thailand, the U.K., the U.S., and Vietnam) for the period
from 1994 to 2004. The paper is to critically analyze the impacts of exchange rate
volatility and exchange rate depreciation on Cambodian exports. The geographic
importance of the trading partners is also taken into account.
The empirical results detect the significant explanatory power of the economic
sizes of exporting and importing countries. In addition, the findings indicate that
Cambodia’s trade depends on the geographic location of the partners. A farther distance
2 For theoretical explanations, see Krugman and Obstfeld (2003). Empirically, De Grauwe (1988), Dell’
Ariccia (1999), and Frankel and Wei (1994) investigate that relationship between trade flows and exchange rate volatility, Cheong (2004) examines the risk of exchange rate fluctuation on imports, and Baak (2004) and Baak, Al-Mahmood, and Vixathep (2003) test the impacts of exchange rate risks on exports.
3 Neak (2005) does not examine the impacts of exchange rate uncertainty on trade due to the dollarization
means higher transportation costs, discouraging trade while the bordered countries seem
to trade more. However, there is little evidence to prove the negative effects of exchange
rate risk on trade as well as the positive relationship between exchange rate depreciation
and exports. At the same time, the ASEAN membership seems not to show satisfactory
results.
The paper is organized as follows: section 2 presents the models employed in this
study. The estimation results are discussed in section 3, and section 4 finally summarizes
the findings as well as policy recommendations.
2. Model specifications and data
2.1. The gravity models
In the present paper, two different regression equations, the traditional gravity
equation and the unilateral exports equation, are estimated using a pooled OLS model and
a random-effects model. In suspicion that the pooled OLS model suffers from omitted
variable bias, the random effects method is employed to capture the unobserved factors
(country-pair specific component) in the models as the data contain a pool of 20
cross-sections over a period of 11 years.4 However, under random effects method, the
unobserved factors are made up in the error term and assumed to be uncorrelated with any
of the independent variables; thus, the Generalized Least Squares (GLS) estimation is
applied.
2.1.1. The traditional gravity model5
The traditional gravity model estimated in this paper is specified as follows:
(
)
cit cit ci ci cit it ct ict cit ASEAN BORD DIST LnVOL LnGDP LnGDP EXP EXP Ln ε α α α α α α α + + + + + + + = + 6 5 4 3 2 1 04 The fixed-effects model is not performed because including the geographic indices, DISTci and BORDci
generates a near singular matrix problem.
5 Different from the models employed by Baak (2004), Dell’ Ariccia (1999), and Frankel and Wei (1994),
where the subscripts, c and i, stand for Cambodia and her trading countries, respectively,
and the subscript, t, denotes time. EXPcit is the real exports from Cambodia to countries i
at time t, while EXPict is the real exports from countries i to Cambodia. GDPct and GDPit
are the real GDP of Cambodia and countries i, respectively. VOLcit denotes the real
exchange rate volatility which is defined as the annual standard error of the log value of
the monthly bilateral real exchange rates. DISTci and BORDci represent geographic indices
which are, respectively, defined as the distance measured between Cambodia and country
i, and a dummy indicating whether Cambodia and country i share a common borderline.6
Finally, ASEANcit is the dummy for ASEAN membership of both Cambodia and country i
at time t.
The dependent variable takes the product of the exports (bilateral trade flows)
between Cambodia and her trading countries. The summation of exports from Cambodia
to her trading partners and exports from her trading partners basically measures the
volume of trade between Cambodia and the partners. The independent variables and the
expected signs of their coefficients are explained in the following section.
2.1.2. The unilateral exports model
The unilateral exports model is mainly to investigate the major effects on
Cambodian exports. Therefore, this model puts the exports from Cambodia to each of the
partners as the dependent variable. By doing so, the depreciation rate of Cambodia’s
currency value against the currency value of the importing countries can be included as
one of the independent variables. The equation also controls for the exports of Cambodia
to North America and Europe.
Accordingly, the model is specified as the following:
6 Countries sharing borders with Cambodia are Vietnam, Thailand, and Laos. However, Laos is not
cit cit ci ci cit cit it ct cit u EURO AMER ASEAN BORD DIST LnVOL DEXR LnGDP LnGDP LnEXP + + + + + + + + + + = 9 8 7 6 5 4 3 2 1 0 β β β β β β β β β β
where DEXRcit is the depreciation rate of Cambodia’s currency value against country i’ s
currency value at time t, and AMER is the dummy for countries belonging to North
America, while EURO is the dummy for European countries. The denotation of other
variables is the same as in section 2.1.1.
The correlations among variables are reported in Appendix A to check
multicolinearity problems.
2.2. The variables
The calculation of these variables follows the work of Baak (2004).
Real exports: The real exports from Cambodia to country i and from country i to
Cambodia is defined as follows:
100 × = t cit cit USGDPD EX EXP and = ×100 t ict ict USGDPD EX EXP
where EXcit and EXict denote, respectively, the annual nominal exports of Cambodia to
country i and of country i to Cambodia; and USGDPDt is the U.S. GDP deflator.
Depreciation rate of real bilateral exchange rate: This variable is computed as
follows:
1
−
−
= LnEXRcit LnEXRcit DEXR ct it cit cit CPI CPI E EXR = ×
where EXRcit is the real annual bilateral exchange rate; Ecit is the nominal annual bilateral
exchange rate; and CPIit and CPIct are the consumer price index of country i and
Real exchange rate volatility: This paper uses the standard deviation of the
natural log value of the real monthly exchange rate as the measure of exchange rate
volatility. The variable is defined as follows:
(
)
∑
= − = 12 1 2 11 1 k ci cikcit LnEXR LnEXR
VOL
where k denotes the month, EXRcik is the monthly bilateral real exchange rate,
andLnEXRciis the annual average of LnEXRcik.
Distance: The distance is calculated using the latitude and the longitude of
Cambodian capital city (Phnom Penh) and the capital cities of the trading partners. This
variable is measured in thousand miles.
Border: The dummy (BORDci) is equal to 1 if Cambodia and country i share a
border, and it is zero, otherwise.
ASEAN membership: If Cambodia and country i belong to ASEAN at time t, the
dummy is 1 and zero, otherwise.
Continent Dummies (AMER and EURO): AMER is 1 if country i belongs to
North America, and zero, otherwise, while EURO is 1 if country i belongs to Europe and
zero, otherwise.
2.3. Data sources
Annual exports data were compiled from IMF’s DOTS (Direction of Trade
Statistics). The data for real GDP (measured by constant 2000 $US), U.S. GDP deflator,
and consumer price indices (2000 = 100) were taken from World Bank’s WDI (World
Development Indicators). Exchange rates and monthly consumer price indices were
between Cambodia’s city (Phnom Penh) to each of her partners’ capital cities were
obtained from GEOBYTES (www.geobytes.com/CityDistanceTool.htm).7
2.4. Expected signs of the coefficients
The real GDPs are used to proxy for the economic sizes of the countries; hence, if
real GDP increases, countries seem to export more or import more. That is, trade between
the countries rises, so the coefficients of real GDPs in both traditional gravity model and
unilateral exports model are expected to be positive. Blanchard (2003) asserts that the real
exchange rate represents the price of foreign goods in terms of domestic goods; thus, the
depreciation of the domestic currency makes domestic goods relatively cheaper, leading
to an increase in exports due to higher foreign demand. So, the variable for the
depreciation rate (DEXRcit) is expected to have a positive coefficient in the unilateral
exports model.
However, the expected sign of the coefficient for bilateral exchange rate volatility
is ambiguous. Although the exchange rate volatility has been treated as a
trade-discouraging risk8 in several empirical studies (Baak, 2004), various researchers have
reached inconclusive findings over the effects of exchange rate volatility on trade growth.
Krugman and Obstfeld (2003) indicate that different findings have been found due to
different measures of trade volume, definitions of the exchange rate volatility, and
choices of estimation period. Baak, Al-Mahmood, Vixathep (2003) and Dell’ Ariccia
(1999) report a negative relationship between exchange rate uncertainty and trade while
De Grauwe (1988) present various models showing both positive and negative
relationship. In conclusion, the impacts of exchange rate volatility on trade or exports also
depend on the choices of regions and model specifications. Thus, the volatility coefficient
can be negative, positive or insignificant in both models.
The distance between the trading partners is used as a proxy for transportation
costs. Higher transportation costs reduce the volume of trade or exports. So, the
coefficient for distance is expected to be negative. In addition, the countries sharing a
border may have more trading opportunities; thus, the expected coefficient sign for
BORDci is positive. Also, because countries belonging to the same economic association
may boost the trade, Cambodia joining ASEAN is expected to increase exports to other
member countries. In other words, the positive sign is expected in both traditional gravity
model and unilateral exports model.
The inclusion of continent dummies is to control for the trading activities of
Cambodia with countries in those specific continents under special conditions. The use of
these dummies also aligns with an attempt to control for Cambodian exports under Most
Favored Nation (MFN) and Generalized System of Preferences (GSP) status. Both
dummy variables are expected to carry positive coefficients.
3. Estimation results
The results of the traditional gravity equation are presented in Table 1 for the
simple pooled OLS model and in Table 2 for the random-effects model. The cross-section
standard error and covariance are calculated using White method to correct for
heteroskedasticity. To clearly examine the trade patterns of Cambodia prior to and after
being admitted to ASEAN, the present paper divides the whole period sample into two
sub-period samples: the pre-ASEAN period from 1994 to 1998 (sub-period I) and
post-ASEAN period from 1999 to 2004 (sub-period II). The division also likely cut the sample
periods at the time of the Asian financial crisis.
The regression results for the simple OLS model support the theoretical
expectations of the gravity model. The estimated coefficients of GDPs (of both Cambodia
8 The higher uncertainty about exchange rate may cause risk-averse producers to focus on domestic markets
and her trading partners), distance, and border have the expected signs and they are
significant and stable across the sub-periods. In particular, the exchange rate volatility is
found to be negatively correlated with the trade volume. This finding supports the general
expectation that the uncertainty of exchange rate is a trade-discouraging risk.
Importantly, the ASEAN coefficient has a significantly positive sign in the second
sub-period sample (from 1999 to 2004) though it is insignificant9 and negative in the
whole period sample. Comparing the magnitude of the coefficients in sub-period I and
sub-period II samples, the impacts of DIST and BORD are weakened in sub-period II
(from 1999 to 2004) when Cambodia gained ASEAN membership. This may result from
the significant influence of ASEAN dummy in the estimation regression.
Table 1: Regression results for the traditional gravity model (Simple pooled OLS model)
Variable (Coefficient) Whole period 1994-2004 Sub-period I 1994-1998 Sub-period II 1999-2004 Constant -46.939 (-7.689)*** -95.796 (-6.743)*** -73.149 (-16.690)*** LnGDP (Cambodia) 2.188 (7.453)*** 4.429 (6.338)*** 3.178 (16.050)*** LnGDP (Partner) 0.618 (33.280)*** 0.641 (16.527)*** 0.714 (75.811)*** LnVOL -0.475 (-5.929)*** -0.557 (-5.603)*** -0.622 (-6.326)*** DIST -0.424 (-8.305)*** -0.566 (-28.111)*** -0.214 (-6.266)*** BORD 1.779 (17.106)*** 1.665 (8.958)*** 1.187 (9.913)*** ASEAN -0.216 (-0.777) 1.271 (11.581)*** R-squared 0.642 0.718 0.658 Adj. R-squared 0.632 0.702 0.640 Observations 213 93 120
Note: Figures in parenthesis are t-statistic. *** denotes significance at 1%.
Heteroskedasticity is corrected (White cross-section standard errors & covariance).
9 Neak (2005) also finds an insignificant relationship between ASEAN and trade in his OLS estimation.
Thanh (2006) finds that joining ASEAN does not increase Vietnam’s trade. Additionally, Lee and Park (2006) point out that ASEAN is of no significance if without South-Korea, Japan and China.
The results of the random-effects model are similar to those of the pooled OLS
model which was presented in Table 1. On the other hand, the impacts of exchange rate
volatility are likely to vary over time although the coefficient is found to be significantly
negative in the whole period sample. The results of the sub-period samples indicate that a
higher volatility of Cambodia’s currency value reduces the trade volume in sub-period I,
but the effects become significantly positive at the 10 percent level in sub-period II. This
may result from the endogenous behavior of the National Bank of Cambodia (NBC)
which was determined to stabilize exchange rate after the Asian financial crisis. Dell’
Ariccia (1999) points out that if this is the case, the endogeneity of exchange rate
volatility would produce biased estimates in the OLS method. Nonetheless, considering
the higher R-squared and adjusted R-squared in the simple OLS model, it is not likely
believed that incorporating the random effects in the estimation may give better estimates.
Table 2: Regression results for the traditional gravity model (Random-effects model) Variable (Coefficient) Whole period 1994-2004 Sub-period I 1994-1998 Sub-period II 1999-2004 Constant -57.275 (-15.804)*** -69.461 (-5.167)*** -63.464 (-28.508)*** LnGDP (Cambodia) 2.731 (15.185)*** 3.255 (4.470)*** 2.894 (26.465)*** LnGDP (Partner) 0.619 (6.778)*** 0.655 (5.473)*** 0.684 (4.945)*** LnVOL -0.109 (-2.546)** -0.194 (-2.094)** 0.058 (1.879)* DIST -0.481 (-3.269)*** -0.569 (-8.680)*** -0.252 (-1.625) BORD 2.067 (3.497)*** 1.654 (3.471)*** 0.866 (1.037) ASEAN -1.183 (-5.424)*** 1.581 (3.601)*** R-squared 0.600 0.637 0.553 Adj. R-squared 0.588 0.616 0.529 Observations 213 93 120
Note: Figures in parenthesis are t-statistic. *** denotes significance at 1%, ** at 5%, and * at 10%. Heteroskedasticity is corrected (White cross-section standard errors & covariance).
One more point noticeable from Table 2 is the negative coefficient of ASEAN
which turns to be significant at the 1 percent level in the whole period sample. This
negative sign does not necessarily mean that joining ASEAN discourages trade. This may
be due to the fact that trade with ASEAN countries during post-ASEAN period is not
significantly larger than during pre-ASEAN period. This was also accompanied with a
dramatic decline of trade with ASEAN from 1997 to 2000 (see Figure I), as the result of
the Asian financial crisis.
Additionally, the coefficient of ASEAN membership is statistically significant at
the 1 percent level while the geographic indices become insignificant factors in
sub-period II. This may due to the significant increase of trade with neighboring ASEAN
countries like Thailand and Vietnam. According to the IMF’s DOTS (2005), among the
three major ASEAN trade partners, Cambodia’s trade with Singapore seemed to remain
constant during 1993 and 2004, whereas that with Thailand and Vietnam showed a
dramatic surge of approximately 170 percent and 350 percent, respectively. Therefore, it
can be concluded that ASEAN membership helps set Cambodia’s trade with ASEAN
back on recovery after the Asian financial crisis although the revival is not significantly
satisfactory. In other words, the effects of ASEAN membership only substitutes for those
of geographic power.
Regardless of the estimation methods, the results provide evidence that
Cambodia’s foreign trade significantly depends on the economic sizes of the countries.
Holding other factors unchanged, trade is likely to increase by about 3 percent with a 1
percent rise in Cambodia’s GDP while only an approximately 0.6 percent increase is
acquired with a 1 percent rise in the partner’s GDP (see the whole period sample of Table
2). It is also indicative that the exchange rate volatility may matters; if not during the
In addition, the geographic power is found to play an important role in determining the
trade flows. That is, Cambodia seems to trade more with the bordered countries and less
with the distant countries. Finally, the results also indicate that the ASEAN membership
seems not to be an advantage, especially with non-neighboring ASEAN countries. Its
effect may only substitute for the effects of the geographic power, sharing a borderline.
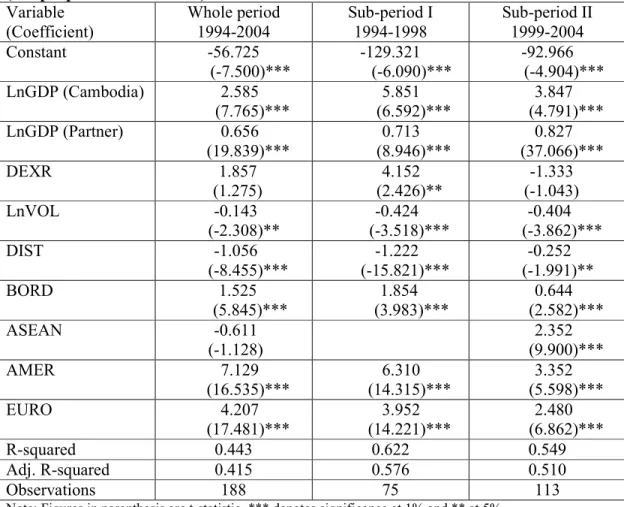
Table 3 and 4 show the estimation results of the unilateral exports models for
pooled OLS and random-effects models, respectively. Similar to the estimations of the
traditional gravity model, the results are reported with White’s heteroskedasticity
correction; and sub-period samples are estimated for the same purpose.
Table 3: Regression results for the unilateral exports model (Simple pooled OLS model)
Variable (Coefficient) Whole period 1994-2004 Sub-period I 1994-1998 Sub-period II 1999-2004 Constant -56.725 (-7.500)*** -129.321 (-6.090)*** -92.966 (-4.904)*** LnGDP (Cambodia) 2.585 (7.765)*** 5.851 (6.592)*** 3.847 (4.791)*** LnGDP (Partner) 0.656 (19.839)*** 0.713 (8.946)*** 0.827 (37.066)*** DEXR 1.857 (1.275) 4.152 (2.426)** -1.333 (-1.043) LnVOL -0.143 (-2.308)** -0.424 (-3.518)*** -0.404 (-3.862)*** DIST -1.056 (-8.455)*** -1.222 (-15.821)*** -0.252 (-1.991)** BORD 1.525 (5.845)*** 1.854 (3.983)*** 0.644 (2.582)*** ASEAN -0.611 (-1.128) 2.352 (9.900)*** AMER 7.129 (16.535)*** 6.310 (14.315)*** 3.352 (5.598)*** EURO 4.207 (17.481)*** 3.952 (14.221)*** 2.480 (6.862)*** R-squared 0.443 0.622 0.549 Adj. R-squared 0.415 0.576 0.510 Observations 188 75 113
Note: Figures in parenthesis are t-statistic. *** denotes significance at 1% and ** at 5%. Heteroskedasticity is corrected (White cross-section standard errors & covariance).
The results of the pooled OLS model for the unilateral exports model provides
consistent signs and significant estimates of the same variables similar to those obtained
in the traditional gravity model. Interestingly, the coefficient of exchange rate
depreciation is found to be insignificant in the whole period and sub-period II, but it is
significantly positive at the 5 percent level in sub-period I. This may imply that the
bilateral depreciation of Cambodian currency boosted Cambodian exports prior to the
Asian financial crisis or ASEAN membership gained while the effect has disappeared
after then. Additionally, the continent dummies are positive and statistically significant at
the 1 percent level, regardless of the sample periods.
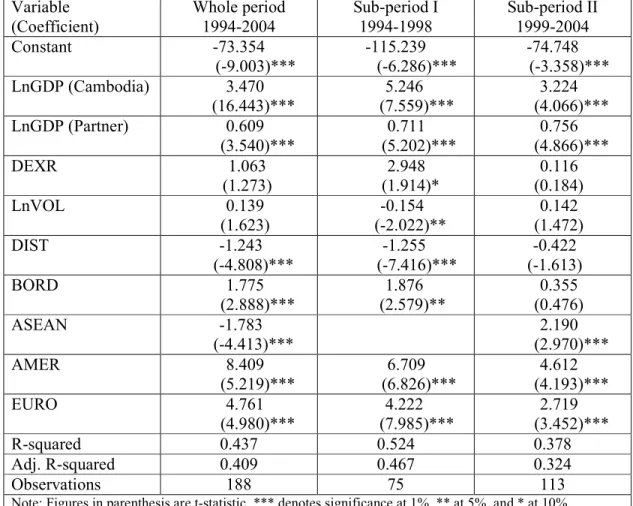
Table 4: Regression results for the unilateral exports model (Random-effects model) Variable (Coefficient) Whole period 1994-2004 Sub-period I 1994-1998 Sub-period II 1999-2004 Constant -73.354 (-9.003)*** -115.239 (-6.286)*** -74.748 (-3.358)*** LnGDP (Cambodia) 3.470 (16.443)*** 5.246 (7.559)*** 3.224 (4.066)*** LnGDP (Partner) 0.609 (3.540)*** 0.711 (5.202)*** 0.756 (4.866)*** DEXR 1.063 (1.273) 2.948 (1.914)* 0.116 (0.184) LnVOL 0.139 (1.623) -0.154 (-2.022)** 0.142 (1.472) DIST -1.243 (-4.808)*** -1.255 (-7.416)*** -0.422 (-1.613) BORD 1.775 (2.888)*** 1.876 (2.579)** 0.355 (0.476) ASEAN -1.783 (-4.413)*** 2.190 (2.970)*** AMER 8.409 (5.219)*** 6.709 (6.826)*** 4.612 (4.193)*** EURO 4.761 (4.980)*** 4.222 (7.985)*** 2.719 (3.452)*** R-squared 0.437 0.524 0.378 Adj. R-squared 0.409 0.467 0.324 Observations 188 75 113
Note: Figures in parenthesis are t-statistic. *** denotes significance at 1%, ** at 5%, and * at 10%. Heteroskedasticity is corrected (White cross-section standard errors & covariance).
Again, regardless of the sample periods, the exchange rate uncertainty is found be
negatively correlated with exports in the OLS estimation; nevertheless, the sign turns
positive and insignificant in the whole period and sub-period II in the random-effects
estimations (see Table 4). Hence, this is further evidence that the effects of exchange rate
volatility may depend on time if random effects method is more efficient. The
significance of geographic power and the sign of ASEAN membership have similar
implications as mentioned in the results for the traditional equation.
As mentioned by Baak (2004), export is one of the components in GDP; hence,
including Cambodia’s GDP as an independent variable may result in the regressions to
suffer from the causality problem. To correct for this problem, the present study lags
Cambodia’s GDP by one year. The results which are reported in Appendix C show that
both methods provide similar results to those in Table 3 and 4, except that the coefficients
of exchange rate volatility and distance become significant at the 10 percent level in the
random-effects model.
4. Conclusions and policy recommendations
To investigate the determinants of Cambodia’s trade flows, this paper has
estimated two equations derived from the gravity model. The dependent variable of the
first equation (traditional gravity model) takes the value of bilateral trade between
Cambodia and each of the trading partners, while the dependent variable of the second
equation (unilateral exports model) takes the value of the Cambodian exports to each of
the trading partners. The empirical estimations use annual data from 1994 to 2004 with a
sample of 20 main trading countries of Cambodia, including Australia, Belgium, Canada,
China, Hong Kong (China), France, Germany, Ireland, Italy, Japan, Korea, Malaysia,
Netherlands, Singapore, Spain, Switzerland, Thailand, the U.K., the U.S., and Vietnam.
pattern prior to ASEAN admission from 1994 to 1998 and after ASEAN admission from
1999 to 2004.
The findings from both equations provided evidence that Cambodia’s foreign
trade significantly counts on the economic sizes of the countries. The impacts of its own
GDP appear to be at least 4 times as great as those of the partners’ GDP. Hence, the
government policies welcoming foreign investors and promoting domestic productions
should be enhanced.
Additionally, as expected in the gravity model, the geographical indices are
powerful in explaining the pattern of Cambodia’s trade. Although ASEAN membership
shows rather curious relationship with trade in the whole period sample, the positive sign
is detected while the effect of sharing a borderline becomes insignificant in sub-period II.
There are still limited economic benefits of ASEAN membership, while negotiations on
lifting tariff and non-tariff barriers are still in little progress. As this is the case, the
government of Cambodia may consider pursuing bilateral trade or multilateral trade
agreements within the region. A hint to the ASEAN ministerial meetings is also that a
single ASEAN market is desperately needed for existence in South-East Asian region.
Essentially, the findings suggested that the depreciation of Cambodia’s currency,
the riel, does not improve exports although the positive relationship was detected before
the Asian financial crisis (or pre-ASEAN membership). Further evidence also suggested
that the impacts of exchange rate volatility are generally negative. Thus, maintaining
stable exchange rate should be more desirable as the depreciation of the riel may
deteriorate the economic development, instead of increasing exports.
As an export-oriented economy in which the trading borders has been open since
the early 1990s, Cambodia is really in need of sound trade policies to promote its exports
beneficiary for policy designing or government’s preparedness in trade negotiations,
disaggregated sectoral analyses are further needed to identify the most favorable sectors.
At the same time, in a dollarized economy like Cambodia where most of the economic
transactions can be carried out in U.S. dollars, the study should also consider the
fluctuation of the importing countries’ currencies against the U.S. dollar instead of
References
Anderson, J. E. (1979). A theoretical foundation for the gravity equation. American Economic Review, 69, 106-116.
Baak, S. J. (2004). Exchange rate volatility and trade among the Asia Pacific countries.
Econometric Society 2004 Far Eastern Meetings 724, Econometric Society.
Baak, S. J., Al-Mahmood, A., & Vixathep, S. (2003). Exchange rate volatility and exports from East Asian countries to Japan and the U.S. International Development Series, 2003-2, International University of Japan.
Blanchard O. (2003). Macroeconomics, 3e. Boston: Pearson Education International.
Cheong, C (2004). Does the risk of exchange rate fluctuation really affect international trade flows between countries? Economics Bulletin, 6, 1−8.
De Grauwe, P. (1988). Exchange rate variability and the slowdown in growth of international trade. IMF Staff Papers, no. 35, 63-84.
Dell’Ariccia, G. (1999). Exchange rate fluctuations and trade flows, evidence from the European Union. IMF Staff Papers, no. 46, 315-331.
Evenett, S. J., & Keller, W. (2002). On theories explaining the success of the gravity equation. Journal of Political Economy, 110, 281-316.
Frankel, J. A., & Wei, S. J. (1994). Yen bloc or dollar bloc? Exchange rate policies of the East Asian economies. In Ito, T and A. O. Krueger, eds., Macroeconomic linkages: savings, exchange rates, and capital flows, NBER-East Asia seminar on economics, vol 3, National Bureau of Economic Research, Cambridge.
International Monetary Fund (2004). Cambodia: Ex post assessment of longer-term program engagement. IMF Country Report No. 04/324.
Krugman, P. R., & Obstfeld, M. (2003). International economics: Theory and policy, 6e. Boston: Addison-Wesley.
Lee, C. S., & Park, S. C. (2006). An examination of the formation of natural trading blocs in East Asia. Asian Economic Papers, 4(1), 90-103.
Neak, S. (2005). FDI and trade in Cambodia: Substitutes or complements? Cambodian Economic Review, 1, 99-114.
Thanh, X. N. (2006). An analysis of Vietnam’s foreign trade: Gravity model approach. MA Thesis, International University of Japan.
2 1 A p p e n d ix A : C o r r e la ti o n s a m o n g v a r ia b le s T a b le A 1 : C o r r e la ti o n s a m o n g v a r ia b le s o f th e t r a d it io n a l g r a v it y m o d e l L n (E X Pci + E X Pic ) L n G D Pc L n G D Pi L n V O L D IS T B O R D A S E A N L n (E X Pci + E X Pic ) 1 .0 0 0 L n G D Pc 0 .3 1 7 1 .0 0 0 L n G D Pi 0 .0 2 7 0 .0 5 5 1 .0 0 0 L n V O L -0 .3 0 7 -0 .0 8 6 0 .0 6 8 1 .0 0 0 D IS T -0 .5 6 3 -0 .0 1 3 0 .5 4 7 0 .2 1 3 1 .0 0 0 B O R D 0 .3 8 8 0 .0 1 0 -0 .4 5 1 -0 .0 3 9 -0 .4 7 2 1 .0 0 0 A S E A N 0 .3 5 5 0 .2 8 0 -0 .4 3 2 -0 .3 2 7 -0 .4 9 6 0 .4 8 0 1 .0 0 0 T a b le A 2 : C o r r e la ti o n s a m o n g v a r ia b le s o f th e u n il a te r a l e x p o r ts m o d e l L n E X P L n G D Pc L n G D Pi D E X R L n V O L D IS T B O R D A S E A N A M E R E U R O L n E X P 1 .0 0 0 L n G D Pc 0 .3 0 7 1 .0 0 0 L n G D Pi 0 .2 1 2 0 .0 4 9 1 .0 0 0 D E X R 0 .0 7 7 0 .1 6 9 0 .0 8 9 1 .0 0 0 L n V O L -0 .1 7 3 -0 .1 7 1 0 .0 5 5 0 .0 7 8 1 .0 0 0 D IS T -0 .0 5 3 -0 .0 1 0 0 .5 5 3 0 .1 8 9 0 .1 8 9 1 .0 0 0 B O R D 0 .2 3 2 0 .0 1 3 -0 .4 5 3 -0 .1 1 4 -0 .0 4 4 -0 .4 6 6 1 .0 0 0 A S E A N 0 .1 4 8 0 .2 6 0 -0 .4 6 7 -0 .1 1 1 -0 .3 5 1 -0 .5 1 9 0 .5 0 6 1 .0 0 0 A M E R 0 .1 8 7 -0 .0 1 4 0 .4 1 3 0 .0 2 3 -0 .1 6 6 0 .5 5 3 -0 .1 1 6 -0 .1 3 2 1 .0 0 0 E U R O -0 .1 0 9 0 .0 0 2 0 .1 0 7 0 .1 7 5 0 .3 2 1 0 .5 6 7 -0 .2 9 2 -0 .3 3 3 -0 .3 0 0 1 .0 0 0
Appendix B: Distance between Phnom Penh and the cities of the trading partners.
Countries Cities Distance (in miles)
Australia Belgium Canada China
Hong Kong, China France Germany Ireland Italy Japan Korea, Republic Malaysia Netherlands Singapore Spain Switzerland Thailand United Kingdom United States Vietnam Canberra Brussels Ottawa Beijing Hong Kong Paris Berlin Dublin Rome Tokyo Seoul Kuala Lumpur Amsterdam Singapore Madrid Bern Bangkok London Washington Hanoi 4345 6060 8509 2083 960 6183 5656 6425 5817 2743 2260 620 6008 713 6654 5989 333 6230 8958 658 Source: www.geobytes.com/CityDistanceTool.htm
Appendix C: Regression results for the unilateral exports model with lag Cambodia’s GDP.
Table C1: Simple pooled OLS model
Variable (Coefficient) Whole period 1994-2004 Sub-period I 1994-1998 Sub-period II 1999-2004 Constant -57.319 (-7.265)*** -122.000 (-6.389)*** -78.286 (-3.713)*** LnGDP(-1) (Cambodia) 2.617 (7.439)*** 5.531 (6.975)*** 3.193 (3.526)*** LnGDP (Partner) 0.657 (19.864)*** 0.713 (8.977)*** 0.829 (37.500)*** DEXR 1.838 (1.234) 4.212 (2.500)** -0.978 (-0.762) LnVOL -0.150 (-2.342)** -0.410 (-3.417)*** -0.395 (-4.016)*** DIST -1.052 (-8.432)*** -1.222 (-15.737)*** -0.263 (-2.070)** BORD 1.521 (5.781)*** 1.850 (3.967)*** 0.641 (2.591)** ASEAN -0.585 (-1.068) 2.347 (9.907)*** AMER 7.100 (16.708)*** 6.316 (14.340)*** 3.411 (5.654)*** EURO 4.185 (17.820)*** 3.954 (14.097)*** 2.498 (6.800)*** R-squared 0.443 0.622 0.543 Adj. R-squared 0.415 0.576 0.503 Observations 188 75 113
Note: Figures in parenthesis are t-statistic. *** denotes significance at 1%, and ** at 5%. Heteroskedasticity is corrected (White cross-section standard errors & covariance).
Table C2: Random-effects model Variable (Coefficient) Whole period 1994-2004 Sub-period I 1994-1998 Sub-period II 1999-2004 Constant -73.285 (-8.160)*** -109.074 (-6.681)*** -63.850 (-2.650)*** LnGDP(-1) (Cambodia) 3.465 (13.706)*** 4.978 (8.224)*** 2.724 (3.049)*** LnGDP (Partner) 0.616 (3.707)*** 0.711 (5.201)*** 0.771 (5.199)*** DEXR 1.059 (1.223) 3.003 (1.983)* 0.385 (0.579) LnVOL 0.128 (1.512) -0.142 (-1.910)* 0.153 (1.716)* DIST -1.237 (-4.805)*** -1.255 (-7.370)*** -0.432 (-1.712)* BORD 1.770 (2.875)*** 1.873 (2.567)** 0.354 (0.489) ASEAN -1.722 (-3.947)*** 2.211 (3.084)*** AMER 8.361 (5.367)*** 6.714 (6.805)*** 4.661 (4.383)*** EURO 4.732 (5.103)*** 4.224 (7.892)*** 2.743 (3.582)*** R-squared 0.431 0.525 0.370 Adj. R-squared 0.402 0.467 0.315 Observations 188 75 113
Note: Figures in parenthesis are t-statistic. *** denotes significance at 1%, ** at 5%, and * at 10%. Heteroskedasticity is corrected (White cross-section standard errors & covariance).