and
unstructured data streams
Nora Alkhamees
A thesis submitted for the degree of Doctor of Philosophy
School of Computer Science and Electronic Engineering
University of Essex
i
Abstract
Data, now more than ever before, are continuously being generated in huge volumes, and at rapid speed. Data may originate from various sources, for instance: sensor readings, financial transactions, social networks, etc.. A data stream is a continuous sequence of data arriving in almost real-time and often at a high speed.
In this thesis, we are interested in benefiting from the availability of such data and developing methods for detecting the occurrence of events from data streams, such as a text stream and a price time-series stream. Hence, we have explored event identification from structured and unstructured data streams in the domain of finance.
We employ the Directional Change (DC) approach to high frequency time-series streams to identify significant price transitions (i.e. events). DC is an event-based approach for summarizing price movements based on a fixed, a-priori threshold. We propose a dynamic threshold definition method, which replaces the fixed threshold and
is appropriate for markets that operate over specific opening and closing times. A
dynamic threshold provides more flexibility and extends the DC approach allowing the identification of price changes in continuously changing environments.
With the proliferation of social media data reporting on all aspects of human activ-ity, being able to automatically identify events is becoming increasingly important. We present a framework for detecting the occurring events on a daily basis, via social net-work streams. We develop and extend a Frequent Pattern Mining method by proposing a dynamic support definition method to replace the fixed support. As the number of text posts streamed each day is not fixed, a dynamic support, can adapt to the nature of data streams and can improve the identification of events.
Finally, we explore whether we can bring together the insights from the time-series stream and the social network stream to understand if events as identified from both streams can be correlated.
Acknowledgements
All praises are to Allah, the almighty, for giving me the opportunity, strength, and endurance to complete my PhD thesis. I am truly grateful to everyone who so generously supported me and inspired me, to everyone who contributed to the work presented in this thesis.
I would like to express my deepest and sincere gratitude to my supervisor Prof Maria Fasli for her continuous support, motivation, and immense knowledge throughout my PhD journey. Her guidance has helped me in all the time of research and writing of this thesis, I have learnt from her how to be focused, dedicated, and an independent person. I could not have imagined having a better supervisor and mentor for my PhD study.
Huge thanks to my amazing sisters Hend and Alhanouf, amazing brothers Fahd and Turki, and amazing nieces Lama and Maha for their unconditional love, encouragements, and endless support. Nawaf my beloved nephew and flatmate, thank you for everything you have done for me.
I would like to thank all my colleagues and friends for their kind support and care. Very special and deep thanks to Arwa Basbrin, Enas Jambi, Fatima Alshahrani, Huda Altisan, Manal Alghannam, Samah Felemban, and Thabat Thabit for being always there for me when I needed them, and for all the great times we spent together. Asma Alzaid and Nouf Bindris thank you for all the long discussions we have been through, and for the lovely weekends we spent together in Colchester, Bristol, and London. My friends and co-workers, Monira Aloud and Nora Almuzaini, thank you for your ongoing support, and for the lovely meetings we always have whenever I am back home. Special thanks to Monira for sharing her PhD experience so willingly with me.
Last but not least, I am so thankful to my parents for simply everything. To my caring father for being the number one believer in me and my abilities, and for supporting me in all my pursuits. For all the discussions and interests he showed to my research just to help me think out loud. To my loving mother for her endless prays, and the boosting voice-notes she constantly sent which always lift me up and pushed me towards hard work. My parents are the most important people in my world, and I dedicate this thesis to them with loads of love.
Contents
1 Introduction 1
1.1 Research Aim and Objectives . . . 2
1.1.1 Event detection from unstructured data streams . . . 3
1.1.2 Event detection from structured data streams . . . 3
1.1.3 Cross-reference across various data streams . . . 4
1.2 Contributions . . . 4 1.3 Thesis Structure . . . 6 1.4 Publications . . . 7 2 Literature Review 9 2.1 Semantic Web . . . 9 2.2 Stream Reasoning . . . 10
2.2.1 Stream Reasoning with Social Networks Data . . . 12
2.3 Topic Detection Methods . . . 16
2.3.1 Document-Pivot . . . 16
2.3.2 Feature-Pivot . . . 17
2.3.3 Probabilistic Topic Model . . . 18
2.4 Event Identification from Twitter . . . 19
2.5 Frequent Pattern Mining . . . 24
2.5.1 Frequent Pattern Mining from Online Data Streams . . . 25
2.5.2 Event Identification from Twitter Stream Using Frequent Pattern Mining (FPM) . . . 27
2.6 Directional Change Approach . . . 31
2.7 Financial Market Data and Twitter . . . 34
2.8 Summary . . . 36
3 Social Network Stream Analysis and Event Identification 38
3.1 Introduction . . . 38
3.2 Developing Methods for Event Identification . . . 40
3.2.1 Dynamic Support Definition Method . . . 41
3.3 Experimental Work . . . 45
3.3.1 Data Collection, Description and Preparation . . . 46
3.3.2 Setting the Dynamic Support Values . . . 48
3.3.3 Applying Frequent Pattern Mining (FPM) . . . 58
3.3.4 Discussion . . . 62
3.3.5 Evaluation . . . 67
3.4 Summary . . . 76
4 Time-Series Stream Analysis and Event Identification 78 4.1 Introduction . . . 78
4.2 Developing Methods for Event Identification . . . 80
4.2.1 Introducing Dynamic Thresholds in the Directional Change . . . . 82
4.3 Experimental Work . . . 85
4.3.1 Data Collection, Description and Preparation . . . 87
4.3.2 Dynamic Threshold Definition . . . 88
4.3.3 Applying the Directional Change Approach (DC) Event Approach 91 4.3.4 Discussion . . . 94
4.4 Summary . . . 102
5 DC Based Trading Strategy with Dynamic Thresholds 104 5.1 Introduction . . . 104
5.2 The Dynamic Threshold-Trading Strategy Rules . . . 106
5.3 Experimental Work . . . 110
5.3.1 Training phase . . . 110
5.3.2 Testing Phase . . . 115
5.3.3 Performance Evaluation Metrics . . . 118
5.4 Summary . . . 121
6 Exploring the Effectiveness of the Dynamic Threshold Trading Strat-egy (DT-TS) Approach on Financial Streams of Variable Frequencies
v
123
6.1 Introduction . . . 123
6.2 Threshold Definition in a Daily Time-Series Stream . . . 124
6.3 Experimental Work . . . 126
6.3.1 Setting the Dynamic Threshold in Daily time-series stream . . . . 126
6.3.2 Applying the DT-TSon Lower Frequency Streams . . . 130
6.4 Discussion . . . 135
6.5 Summary . . . 137
7 Investigating Interrelationships Across Data Streams 140 7.1 Introduction . . . 140
7.2 Measuring the Relationship Through Pearson Correlation Coefficient . . 145
7.3 Finding Possible Inter-links Using Granger Causality . . . 152
7.4 Summary . . . 160
8 Conclusions and Future Work 162 8.1 Summary . . . 162
8.1.1 Objectives . . . 162
8.1.2 Contributions . . . 163
8.2 Future Work . . . 167
Appendix 1: Tweets Collection Using Twitter API 169 Appendix 2: Gold Standard List During the UK General Elections2015 173 Appendix 3: FTSE 100 News Articles from November 2016-May 2017 180 Appendix 4: FTSE 100 News Articles from July 2015-February 2016 184
Glossary 192
2.1 Semantically-Interlinked Online Communities (SIOC) Overview (Image
taken from [1]) . . . 10
2.2 The BOTTARI Ontology (Image taken from [2] page 4) . . . 14
2.3 FP-tree Construction (Algorithm taken from [3] page 58) . . . 25
2.4 The FP-tree Mining (Algorithm taken from [3] page 67) . . . 26
2.5 The Found Hot Topics in [4] (Table taken from [4] page 4) . . . 28
2.6 DC Concepts . . . 32
2.7 Correlation between Calm mood and DJIA prices (Image taken from [5] page 4) . . . 35
3.1 Some Ferguson Public Tweets . . . 39
3.2 Some CNN Ferguson Tweets . . . 39
3.3 Event Detection Abstract Model . . . 41
3.4 Example of Tokenized tweets from UK General Elections 2015 (GE 2015) (each token sepreated by comma) . . . 48
3.5 Event identification from Twitter main steps . . . 49
3.6 Tweet Keys and Values from the GE 2015 Stream . . . 52
3.7 Number of terms exceeding the average and the support compared to total number of terms from GE 2015 . . . 54
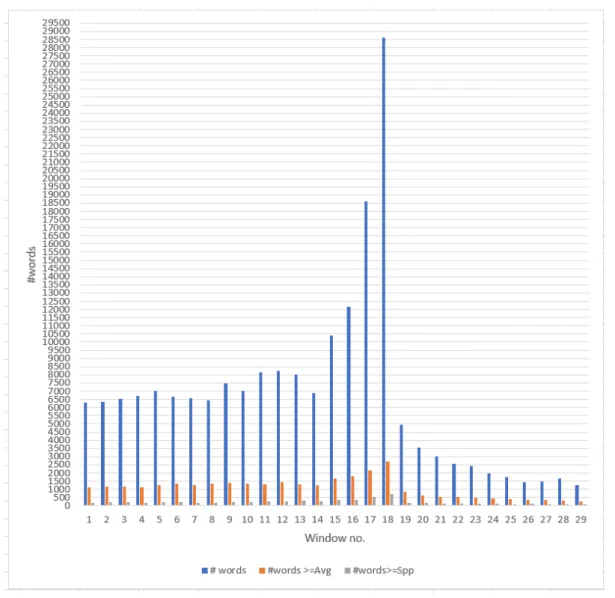
3.8 Number of terms exceeding the average compared to number of terms exceeding the support value from GE 2015 . . . 55
3.9 Greece Crisis Stream Logistic Regression Model . . . 57
3.10 Frequent Patterns Snapshot . . . 60
3.11 Non-relevant Patterns . . . 61
3.12 Snapshots of Some Windows Frequent Patterns . . . 61
4.1 DC Abstract Model . . . 82 vi
vii
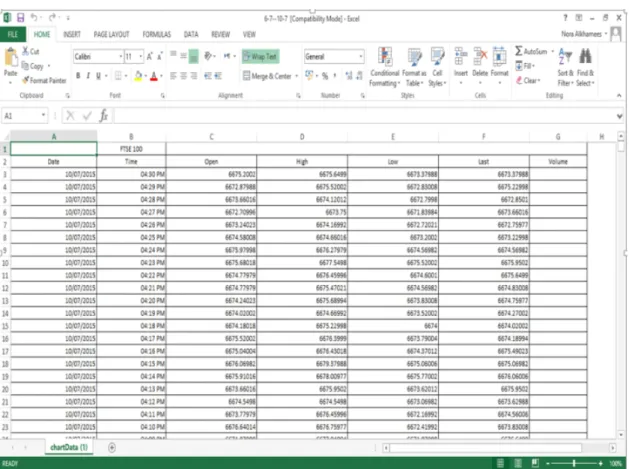
4.2 Excel Sheet Snap Shot for FTSE100 Data . . . 88
4.3 “Something has Happened” Training Dataset . . . 89
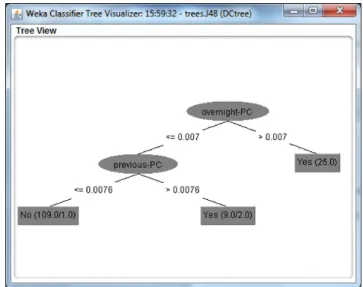
4.4 Something has Happened Decision Tree . . . 90
4.5 DC Detected Events from July 2015-Feb 2016 . . . 92
4.6 After Opening Intense Price Change . . . 93
4.7 DC Detected Events from July 2015-Feb 2016 by the 3% Fixed Thresold 94 4.8 DC Detected Events from July 2015-Feb 2016 by the 4% Fixed Thresold 95 4.9 DC Detected Events from July 2015-Feb 2016 by the 5% Fixed Thresold 96 4.10 DC Detected Events from July 2015-Feb 2016 by the 6% Fixed Thresold 97 4.11 October 2015 DC Detected Events using our dynamic and fixed thresolds 97 4.12 December 2015 DC Detected Events using our dynamic and fixed thresolds 98 4.13 Feb 2016 DC Detected Events using our dynamic and fixed thresolds . . 99
5.1 Detected DC Events from July 2015- March 2016 . . . 111
5.2 The DT-TS Training Dataset for Building the Trading Strategy Decision Tree . . . 112
5.3 Trading Strategy Decision Tree . . . 112
5.4 Detected DC Events from April-Oct 2016 (Testing Period) . . . 116
5.5 Profitability Comparision between Training and Testing sets . . . 116
5.6 Profitability Comparision between Trading Strategies in the Testing set . 118 6.1 The Detected DC Events in Different Threshold Calculation Approaches Using the Daily Prices Stream from July 2015- March 2016 . . . 129
6.2 The Detected DC events using the daily prices stream in the period from July 2015 till end of March 2016 . . . 130
6.3 The Detected DC events using the daily prices stream in the period from April 2016 till end of Oct 2016 . . . 132
6.4 Profitability Comparision between Trading Strategies By the Minute-by-Minute Stream . . . 137
6.5 Profitability Comparision between Trading Strategies By the Daily Stream . . . 138
7.1 The FTSE 100 Daily Prices During the GE2015 Period (vertical red lines indicate the GE 2015investigated period from 1/3/2015-26/5/2015) . . 142
7.3 The Downturn DC event on 29th of April . . . 143
7.4 The Upturn DC event on 8th of May . . . 144
7.5 FTSE 100 During the Greece crisis 2015 (vertical red lines indicate the investigated period) . . . 150
7.6 Trading action taken place on 29/6/2015 as prices go sharply down . . . 151
7.7 The Granger causality GC1 test results for 1-8 lags, where only lags 2 and 3 rejects the null hypothesis in the first regression (framed in red) . 154 7.8 The Granger causality GC2 results for 1-8 lags, where lags 1,2,3 and 4 rejects the null hypothesis in the first regression (framed in red) . . . 156
7.9 The Granger causalityGC3 results for 1-8 lags, where lags 7 and 8 rejects the null hypothesis in the first regression (framed in red) . . . 158
7.10 The Granger causality GC2 results for 1-5 lags in the Greece crisis 2015 period . . . 159
A1.1 Twitter Application . . . 169
A1.2 Add Java Libraries . . . 170
A1.3 Connect to MongoDB . . . 170
A1.4 Run Console . . . 171
A1.5 Tweets in MongoDB . . . 172
List of Tables
2.1 Traditional VS Stream Reasoning . . . 11
3.1 Data collection summary . . . 47
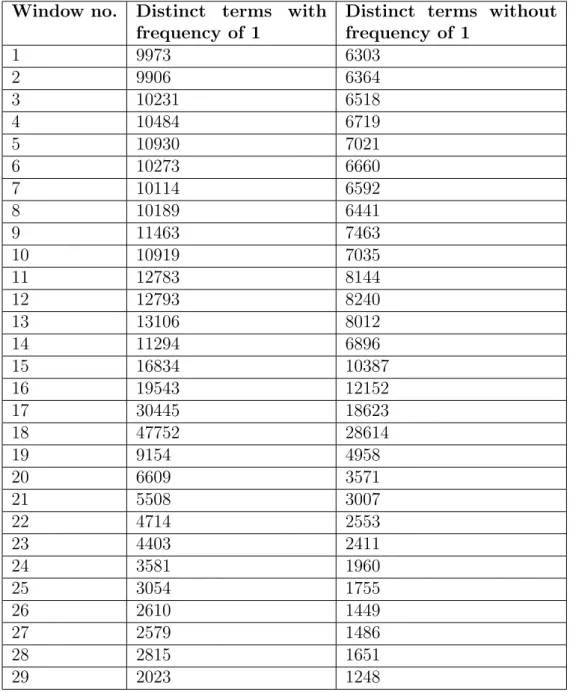
3.2 Number of terms in each window with and without a frequency of 1 from GE 2015 . . . 51
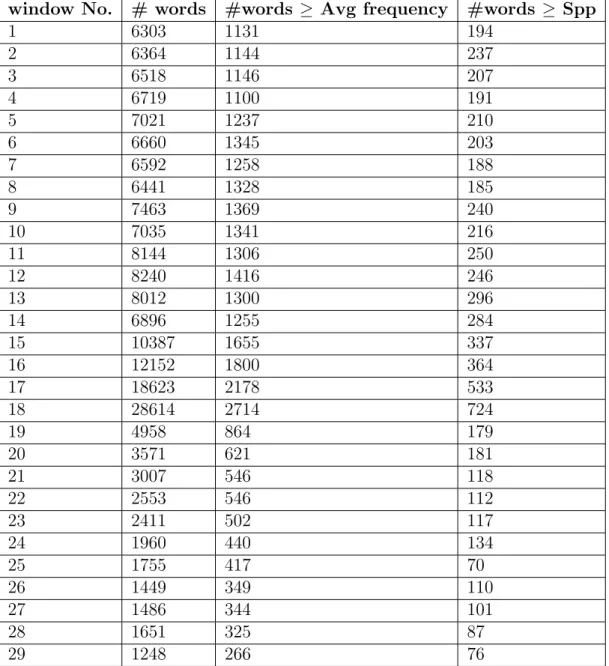
3.3 Number of terms exceeding theAvgi and theSppi for each window-batch in GE 2015stream . . . 53
3.4 Support Values Before the Strict Support Definition was Introduced from GE 2015 . . . 56
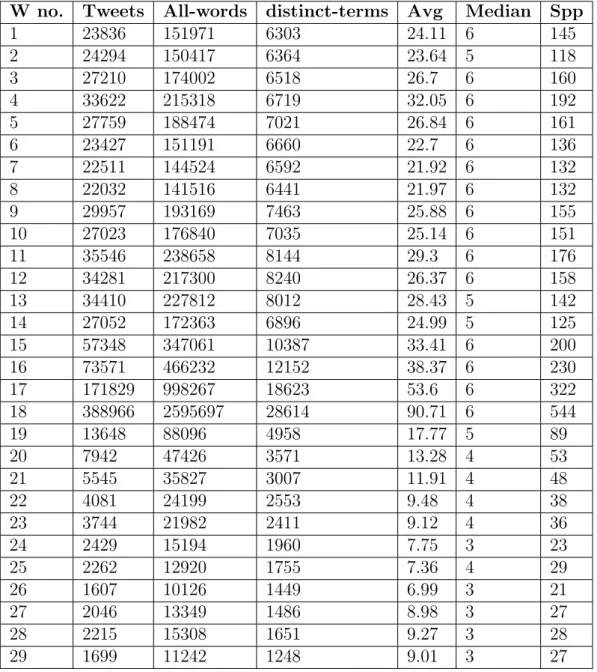
3.5 GE 2015 Stream Data Analysis . . . 57
3.6 logistic regression (LR) Training Dataset from the GE 2015Stream . . 58
3.7 Greece Crisis Stream Data Analysis . . . 59
3.8 Similarity Metrics Comparison . . . 63
3.9 GE 2015 Stream Detected Events and Matching News Headlines . . . . 65
3.10 Greece Crisis stream Identified Events with matching News Headlines . . 66
3.11 Identified Frequent Patterns After Major Announcements . . . 67
3.12 The SFPM Identified Topics . . . 72
3.13 Precision, Recall, and F-measure UsingGE 2015 Stream . . . 73
3.14 Precision, Recall, and F-measure Overview Using GE 2015 Stream . . . 74
3.15 Detected Topics Sample on 29/4/2015 by D-FPM and the SFPM ap-proach Compared to News . . . 75
3.16 Terms selection comparison . . . 76
4.1 Weights w1 and w2 Assigning Attempts . . . 90
4.2 Dynamic and Fixed Thresholds Detected DC Events Analysis . . . 101
5.1 Training Period Analysis Using the Minute-by-Minute Prices Stream . . 114
5.2 Testing Set Analysis Using the Minute-by-Minute Prices Stream . . . 117
5.3 DT-TSPerformance in Period 1 (from July 2015- March 2016), Accord-ing to the Evaluation Metrics . . . 120
5.4 DT-TS Performance in Period 2 (from April 2016- October 2016), Ac-cording to the Evaluation Metrics . . . 121
6.1 The Daily Stream Threshold Calculation Approaches . . . 128
6.2 Daily Stream: July 2015 until End of March 2016 Stream Analysis . . . 133
6.3 Daily Stream: April 2016 until End of Oct 2016 Stream Analysis . . . 134
6.4 Event Detection Source Summary from July 2015-March 2016 . . . 135
6.5 Average profits in the minute-by-minute Stream Using Different Trading Strategies . . . 136
6.6 Average profits in the Daily Stream Using Different Trading Strategies . 138 7.1 Comparison between Proposed Event Detection Methods Applied to So-cial Network (Text) stream and Time-Series (finanSo-cial) stream . . . 141
7.2 The values of X and Y in the GE 2015 period, where X is the number of posted tweets in a day andY is the FTSE 100 daily prices . . . 147
7.3 The values ofXandY in the Greece Crisis period, whereXis the number of posted tweets in a day andY is the FTSE 100 daily prices . . . 148
7.4 The values ofX and Y in the GE 2015 period, Where X is the Number of Tweets and Y is the Number of Detected DC Events . . . 149
7.5 The values of X and Y in the Greece crisis 2015 period, where X is the Number of Tweets and Y is the Number of Detected DC Events . . . . 150
7.6 The values of X and Y in the GE2015 period, Where X is the Number of Detected Events from Twitter Stream and Y is the Number of Detected DC Events . . . 152
A2.1 Golden Standard List . . . 179
A3.1 FTSE 100 News from November 2016 untill May 2017 . . . 183
List of Algorithms
1 Defining DC and OS events (Algorithm source [6]) . . . 33
2 Dynamic Support Definition Method (the D-FPM) . . . 45
3 Define a Dynamic Threshold Value for DC . . . 86
4 The DT-TS Trading Rules . . . 109
Introduction
The amount of data generated, nowadays, is extraordinary. This includes data pro-duced from sensor readings, financial markets, social networks, web logs, click streams, etc.. In general, one cannot reason using such data streams easily, as they are of an unbounded size and their data elements arrive at an irregular rate [7]. Furthermore, it is not possible to backtrack over the past arrived data elements or review and keep track of the entire history. Data streams are infinite continuous data feeds, ordered by time, and generated at high speeds [8].
Data streams can be considered as one of the main sources of what is referred to as Big Data [9]. The concept of Big Data is commonly used to describe huge amounts of heterogeneous data coming from different sources, which can be analysed using special types of tools in order to obtain the advantage and insight of that data. In 2011,
Gartner [10] defined Big Data as: high volume “increasing size of data”, high velocity
“increasing rate at which data is produced”, and high variety “increasing range of data
formats including structured (e.g., relational databases), semi structured (e.g., XML documents) and unstructured data (e.g., emails)”, and in 2012 Gartner with others [11],
expanded the definition to include high Veracity “increasing uncertainty to origins of
data”.
There has been an exponential growth in the generation of unstructured data, and furthermore, the amount of unstructured data has exceeded the amount of structured data [12]. In addition, in 2016 it was estimated that 80% of the world’s generated
data is unstructured1. Sources of unstructured data include: web pages, emails, images,
medical records, mobile content, social media contents, etc.. Unstructured data do not typically have a defined data model due to the heterogeneous sources of the data, and
2
such data may also not be easy to process using available tools [13]. In this context, text mining is an extension of data mining but for text, and is conducted to reveal value from unstructured, textual data [14].
Revealing insights from streams of data is becoming of an increasing interest, ex-amples of such streaming analysis are: using sensors to detect pollution levels [15–17], discover influenza areas [18, 19], and capture the state of a city’s traffic [20–23]. Other examples would be using social networks to spot disasters such as earthquakes [24–26] and to sense the effect of public mood [5, 27, 28].
In this thesis, we are interested in developing and extending event identification methods for structured and unstructured data streams. We want to focus on the meth-ods that deal with the changing nature of the data streams. Instead of considering the dynamic and changing nature of data streams as a challenge and as a barrier to face, in this research, we will try and see this as an advantage and strength, and develop event identification methods that can accommodate and function in such data streams to provide better and more effective analysis. Thus, we seek to adapt to the changing nature of those streams, where the stream volume is extremely high, and the arrival rate of its data elements is unpredictable in advance. Particularly, we want to develop event detection methods for high frequency time-series data streams and social networks data streams (i.e. text streams). We will also try to explore whether the insights derived from the two streams can be correlated and brought together.
1.1
Research Aim and Objectives
In this thesis, we are interested in developing methods and techniques by which to detect the occurrence of events from various types of data streams, typically a text stream and a high frequency time-series data stream. We intend to focus on methods that deal with the changing nature of the data streams. Hence, the main aim is to study current state of the art event detection methods for structured and unstructured data and extend and develop them to deal with streams of data. Guided by the above aim we look to achieve the following core objectives: event detection from unstructured data streams, event detection from structured data streams, and cross-reference across various data streams.
1.1.1
Event detection from unstructured data streams
From a social network stream (Twitter) consisting of unstructured data, we aim to collect text posts relating to a certain major event and seek to develop methods that detect the occurrence of topics/events within that major event. An event in SN is defined in [29] as “an occurrence causing change in the volume of text data that discusses the associated topic at a specific time, and often associated with entities such as people and location”. Twitter is an online social network platform where users can post and interact using messages known as tweets. Twitter is a popular microblogging website, in 2013, twitter was described as the “the SMS of the Internet” [30]. Furthermore, in 2016, it was named as the largest source for breaking news after receiving 40 million tweets in a single day —the US presidential election day in 2016 [31]. Therefore, it was considered as the source of data for our investigated text stream rather than any other microblogging sites.
We intend to develop a method for identifying the occurrence of daily events in a social network text stream (Twitter), using a Frequent Pattern Mining (FPM) [32] method and a dynamic support value instead of a fixed given value. We want to see if the topics which are detected using the proposed dynamic support can better fit with the changing nature of text streams or not.
1.1.2
Event detection from structured data streams
From a price time-series data stream consisting of structured data, we are interested in developing methods to detect events (i.e. significant price fluctuations) once they
occur. We want to study the financial market using a High Frequency Data (HFD)
stream. HFD are referred to as extremely large amount of financial transactions at
daily frequencies or even finer time scale [33].
In financial markets which operate over certain opening and closing times, we aim to develop a method for detecting the occuring events using a Directional Change (DC) [34, 35] approach and a dynamic threshold to replace the fixed given one. In DC, an event is identified in price time-series data streams once a significant price change is spotted (i.e. price change between two points satisfies a given threshold value).
We seek to find out if a dynamic threshold that is daily defined can lead to the more effective detecting of events than a fixed threshold value that is used throughout the
4
whole stream (i.e. does not change).
Furthermore, we wish to explore the application of the dynamic threshold as part of a trading strategy and compare this with other trading strategies that have been developed based on the DC approach such as [36–38]. Hence, we want to find out if a trading strategy based on a dynamic threshold that is defined daily is more profitable than a fixed threshold or not.
1.1.3
Cross-reference across various data streams
Finally, we seek to cross-reference over data streams and identify correlations between the identified events. We want to bring insights from both streams together, and explore the relation between the events identified from them. Hence, we aim to put together the events identified from both streams, process them, and then look for correlation between them.
We intend to draw inferences from the two streams in order to disclose hidden rela-tionships. We will try to identify correlations between the detected events from different data streams (structured and unstructured data streams), and see how and in what way they may affect each other. Thus, we will explore and further investigate the relation-ships between various data streams to see what links can be found, if any.
In addition, we want to find out if there is a correlation between events identified from the social network stream (Twitter), and those obtained from the high frequency time-series data stream. In particular to determine whether regional or global events are more correlated with stock market price changes.
1.2
Contributions
The work presented in this thesis contributes to the development of event identifica-tion methods from streams of data, both structured and unstructured. We have chosen the domain of finance as the domain of application as this is an area that is data rich and structured data can be obtained for study and experimentation. In particular, this thesis develops and extends event detection methods to be able to deal with the dynamic and changing nature of data streams. The main contributions are as follows:
1. In the text data stream (i.e. unstructured stream) analysis and event identifica-tion, we are using the FPM approach on a social network stream (Twitter) in
order to identify the occurring topics/events. Previous work on text streams using the FPM approach to obtain the occurring frequent patterns (i.e. events) require determining the number of terms to be selected in advance [39–41], in other words, they were using a fixed support value. In contrast, we think that in changing and dynamic environments such as text data streams, it is difficult to specify the suit-able number for items (i.e. terms in text streams) to be retrieved in advance. This is because the number of items received is not fixed and may vary from one batch to another.
Thus, we propose a new method to define the support value (i.e. threshold)
dynamically for every window-batch separately, to better cope with the nature of data streams. Using a dynamic defined support value to identify events from text data streams, addresses the problem of having fixed support values (Chapter 3). 2. In relation to the high frequency time-series data stream (i.e. structured data
stream) analysis and event identification, we use the DC event approach to identify
the financial market price fluctuations (i.e. events). An event in theDCapproach
is detected if the price change between two points exceeds/is below the given threshold value. A fixed threshold has always been the case when using the DC approach [6, 35–38, 42–51]
We improve the operational performance of the DC approach by introducing a
novel method for dynamically defining the threshold on a daily basis instead of setting it as a fixed value. Using dynamic threshold values, events of different magnitudes can be detected, which is not applicable with fixed thresholds (Chapter 4).
3. The DC approach has been used to define and use trading strategies in different
markets. One of the issues in designing a strategy is finding the most profitable threshold value [37, 38, 51, 52]. Thus, we introduce a trading strategy (named the DT-TS) based on the DC approach and the dynamic defined threshold value so as to further evaluate the usefulness of the method for defining the daily dynamic threshold (Chapter 5).
4. Finally, we perform a study to explore the relationship between the different data streams, one originating from social networks (unstructured data) and the other
6
between the events identified from both streams and try to cross-reference between them. This is especially important in supporting decision making in domains such as the financial markets (Chapter 7).
1.3
Thesis Structure
This thesis is structured into eight main chapters.
Chapter 2 provides a literature review and discusses the related work, to show what has been done in the area to be studied. It consists of seven main sections, starting with a section on the semantic web, which shows the role and importance of the semantic
web in relation to the data available on the World Wide Web (WWW). This is followed
by the stream reasoning section, where we define a data stream, and compare between traditional reasoning and stream reasoning. In the next section, we present the topic detection methods, which are the document-pivot method, the feature-pivot method, and the probabilistic method. The fourth section reviews some attempts at event iden-tification in relation to Twitter. After that, we describe the FPM method, and illustrate attempts at using the FPM for detecting events occurring on Twitter. In section six we explain the DC approach, which is an approach for summarizing price movements in financial streams. Section seven highlights some work linking and connecting financial market data with Twitter data.
Chapter 3 describes the developed method for detecting events/topics from a social network data stream (text stream). In more details, we show how the FPM method was extended and developed to cope with the nature of data streams by introducing a dynamic support definition method to replace the fixed given one for detecting the oc-curring topics/events. Then we present the experimental work, which starts by showing how the data (i.e. text posts) were collected, then how the dynamic support value was set and how the experiments were carried out to identify topics/events, and finally, we discuss and analyse the findings. We conclude the chapter by evaluating the performance of our topics detection framework and discuss the evaluation results.
Chapter 4, describes the developed method for detecting events (i.e. price tran-sitions) from high frequency time-series data streams. In more details, we show how the DC approach was employed to the price time-series data streams along with de-scribing the dynamic threshold definition method. In addition, a comparison between
the detected DC events using the dynamic threshold and different fixed thresholds is conducted, and finally a discussion and analyses of the findings is presented.
After that, in the fifth chapter, we propose a trading strategy, named the Dynamic Threshold-Trading Strategy (DT-TS), based on the DC approach and the daily dynamic defined threshold. We evaluate the performance of DT-TS against various fixed thresh-old values and different trading strategies. Furthermore, in Chapter 6, we explore the functionality of that trading strategy (i.e. DT-TS) on a lower frequency data stream to see whether it performs equally well in that circumstance. We discuss and analyse the performance of both data streams (the high and lower frequency data streams).
In Chapter 7, we explore whether we can bring insights from the two streams together (the text stream and the price time-series data stream) and correlate over them. We apply the Correlation Coefficient test and the Granger Causality method in order to put together and draw inferences across events detected from both streams.
Finally, in Chapter 8, the thesis concludes with a summary and some conclusions regarding the work presented and the findings, and the planned future work is outlined.
1.4
Publications
The following publications were produced as a result of the work undertaken as part of this PhD project:
1. N. Alkhamees and M. Fasli, “Event detection from time-series streams using di-rectional change and dynamic thresholds,” 2017 IEEE International Conference on Big Data (Big Data), Boston, MA, 2017, pp. 1882-1891. doi: 10.1109/Big-Data.2017.8258133
2. N. Alkhamees and M. Fasli, “An exploration of the directional change based trad-ing strategy with dynamic thresholds on variable frequency data streams,” 2017 International Conference on the Frontiers and Advances in Data Science (FADS), Xi’an, 2017, pp. 108-113. doi: 10.1109/FADS.2017.8253207
3. N. Alkhamees and M. Fasli, “A Directional Change Based Trading Strategy with Dynamic Thresholds,” 2017 IEEE International Conference on Data Science and Advanced Analytics (DSAA), Tokyo, 2017, pp. 283-292. doi: 10.1109/DSAA.2017.48
8
4. N. Alkhamees and M. Fasli, “Event detection from social network streams using frequent pattern mining with dynamic support values,” 2016 IEEE International Conference on Big Data (Big Data), Washington, DC, 2016, pp. 1670-1679. doi: 10.1109/BigData.2016.7840781
Literature Review
While attempting to develop methods for event detection from various types of data streams, in this chapter we present a background and a literature review of related topics. The literature review chapter covers seven main topics, in sequence: the Semantic Web; stream reasoning; topic detection methods; event identification from Twitter; Frequent Pattern Mining (FPM); the Directional Change approach; and finally, linking financial market data and Twitter data.
2.1
Semantic Web
The development of the Semantic Web is promising to revolutionise the World Wide
Web (WWW) and its use by providing content which can be ‘understood’ by computers.
This has opened the door more widely to the possibility of taking full advantage of everything that is available on the web. In [53], the Semantic Web is defined as an extension of the current Web in which information is given well-defined meanings, to better enabling computers and people to work in cooperation.
Generally, to be able to reason with data from the Web, there must be a data model to represent the data and an ontology to be followed which allows communication with that data. An ontology is a defined abstract model of a domain from a particular point of view/perspective, it describes the objects (terms) and their relations and can be used for providing a common understanding of the underlying domain of application. It is the key to machine-processable data on the Semantic Web [54].
The Resource Description Framework (RDF) [55] is a data model and is the
foun-dation upon which the Semantic Web has been built. It is used for data representation
10
and exchange on the Web. An RDF graph contains subject- predicate- object triples.
The Web Ontology Language (OWL) [56] is the language defined for representing
ontologies in the Semantic Web; it was developed by the World Wide Web Consortium (W3C) Web Ontology Working Group. It is used to process and analyse the contents
of the Web, not just to present it. An OWLontology can be stored or exchanged when
specified using theRDFor Extensible Markup Language (XML) syntaxes, respectively.
An OWL ontology consists of a head, a class and properties.
The Semmantically-Interlinked Online Communities (SIOC) [1] is an ontology
de-signed for use on the Web to describe user communities (message boards, wikis, and
blogs); it depends on RDF and the OWL ontology, and was developed by the Science
Foundation, Ireland. An overview ofSIOCis shown in Figure 2.1. Later in this chapter,
we will show some efforts using the SIOC ontology with Twitter data.
Figure 2.1: SIOC Overview (Image taken from [1])
Several studies including, but not limited to, [57–62] show that by using ontologies one can “reason” and understand the meaning of web pages, processes and analyse them more effectively.
2.2
Stream Reasoning
A data stream is a continuous sequence or flow of data over time produced in real-time or near real-real-time and often at high velocities [8]. Data streams produce a huge amount of dynamic data, and this can come from different sources: sensors, website click streams, tick prices, social networks, etc. In addition this data is either implicitly ordered by arrival time or explicitly by timestamp [63].
Examples of such streams are produced by real-time traffic monitoring systems where sensors are distributed among a city to capture information about traffic jams and road congestion, such in [20, 21, 64, 65]. This is of interest not only to citizens (in order to avoid congested roads), but it is also of interest to city managers, who can reason with those streams to better manage and further plan the city. In addition, the streams are of interest to event planners who also can reason using these streams – to sense the impact of current events as well as to choose better venues for future events. Another example of a data stream is that of share prices streamed at high frequency [66–68].
HFD are referred to as observations taken at fine time intervals. In finance, HFD
refers to observations taken daily or at even finer time scales [33].
Due to the compelling need to reason using such streams in time or near real-time, stream reasoning was first explored by Della Valle et al. in 2009 in [7]. They commented that stream reasoning was “an unexplored, yet high impact, research area”; such reasoning is applied in real-time to noisy data streams, so as to support deci-sion making. Table 2.1 shows a comparison between traditional reasoning and stream reasoning, showing how the reasoning is performed and when it starts and terminates.
Traditional Reasoning Stream Reasoning
Analysis applied to all available data. Hard to apply to all data; hence only
applied to parts of it. Processing starts when a query is fired
and ends when answer is found or all data has been scanned.
Continuous processing is required; it does not end.
Table 2.1: Traditional VS Stream Reasoning
Stream processing systems can be categorised as Data Stream Management System
(DSMS), which were developed by the database community, or as the Complex Event
Processing (CEP) systems, which was developed by the event based research community
[69].
TheDSMS[70] inherits the relational data model and its expressive query language
is adapted from the Data Base Management System (DBMS). The Continuous Query
Language (CQL) is used with DSMS; here queries run continuously, and can be
ex-pressed using the SPARQL language [71]. In DBMS, data are saved in tables and users
can submit queries to retrieve it. On the other hand, in DSMS users submit queries
which are run continuously as new data arrives. The Large Knowledge Collider project
func-12
tionality, and was built as part of the EU 7th framework project LarKC. Developers can implement their plugins and deploy them to the LarKC platform [72].
The CEP system is commonly used in event driven environments where a time
element must be associated with streams; its main principle is continuous processing carried out to detect the occurrence of events [73]. Instead of queries, rules are defined which specify what constitutes the occurrence of an event; this is done via an Event
Processing Language (EPL) or can be expressed using the TESLA language [74]. Esper
is a system for complex event processing, it is open source and available in the Java and C# programming languages; it was developed by EsperTech in 2006 [75]. Next, we show some efforts using stream reasoning systems with social networks data streams.
2.2.1
Stream Reasoning with Social Networks Data
In [76], the authors used the data available on social networks in order to find out about the impact of city-scale events. They were interested in finding out about the popularity of events happening in a city. They presented a Streaming Linked Data (SLD) framework to collect data streams, analyse them, and finally to show the results
they obtained on a dashboard. They used RDF as their data model andSIOC as the
ontology to represent their data; for this study, they considered the London Olympic
Games 2012 and the Milano Design Week (MDW) 2013 as the two social city scale
events to be focused on.
For the London 2012 Olympic Games they wanted to detect events which were taking place in one of the three main Olympic venues: the Olympic Stadium, the Aquatic Centre, or the Water Polo Arena. To validate the events that they found mentioned in the data streams, they used the Olympic Games calendar. They were able to use a stream of three million tweets produced in the period between the 25th July and the 13th August 2012, across London. A continuously active C-SPARQL query which counted the number of tweets posted from an area every 15 minutes was “fired”. It looked for bursts, taking the view that bursts are signals that an event is occurring, and it used a sliding window which “slid” every 1 minute. A burst was said to have occurred if the number of tweets from a location within a 15 minute period was greater than the average number of tweets collected in the last 2 hours + double the standard deviation. Moreover, if a burst was found from public transportation near the venue, and then was found in areas outside the venue, and finally was found in the venue itself, then it was
posited that an event had been found.
For the MDW 2013, the authors of [76] wanted to detect events and analyse the
crowd’s opinions and sentiments concerning these events. During that week they col-lected tweets in real-time; they looked for all tweets posted from Milan city as well as tweets posted from world-wide locations that mentioned any of the 300 words in the
keyword list related to MDW 2013; they collected a total of 107,044,478 tweets. The
posts in the RDF streams were each associated with a value ranging from [-1, 1]; this
value represented the sentiment of each tweet. Sentiment measurement was performed using a dictionary based sentiment classifier. A query was run every 15 minutes to count tweets and isolate the ones with a positive impression score in the range [0.3,1] and also tweets with a negative impression score in the range [-1,-0.3]. The in-between scores indicate neutrality. The total number of tweets broken down into positive, negative and neutral rating were calculated every 15 minutes.
From both of the cases discussed these researchers were able to detect the popularity of events from the numbers of tweets posted from particular locations. Many tweets were missed because users did not enable the location property – although they were, perhaps, actually at the event venue. Also, this research was limited in terms of reasoning because it only considers the number of tweets posted from a location and ignores the tweet text. If the tweet text had been included in the reasoning, this would perhaps have provided even better event popularity sensing because then only tweets related to the event in question would have been included.
Another study, [2], was conducted to gain insights from people’s opinions posted on social media; in this case, this was done in order to rate restaurants and coffee shops in the Insadong district, Seoul, Korea. The authors built an application offering
recom-mendations related to Point Of Interest (POI)s across a particular district of Seoul city,
based on public opinion as discovered from social media. They used two types of data:
the social media streams (Twitter); and static descriptions of POIs collected from the
websites and portals of 319 restaurants, resulting in a geo referenced knowledge base providing 44 attributes for each restaurant (name, image, address, specialities, etc.). From Twitter they collected 200 million tweets sourced over three years (4 Feb 2008 to 23 November 2010). The vast majority of tweets from that district were not related to its restaurants; indeed it was found that only 109390 tweets were concerned with about 245 restaurants. They designed the BOTTARI ontology (see Figure 2.2) which
14
extends the SIOC ontology by defining TwitterUser as a special case of UserAccount
and Tweet as special case of Post. The most distinct thing about the BOTTARI ontol-ogy is the addition of the talksAbout property: this can indicate a user talking about
something positively, negatively or neutrally. The stream reasoning resulted in RDF
streams which indicated positive, negative, and neutral ratings for each restaurant. The reasoning activity was based on using the LarKC platform and depended on the BOT-TARI ontology. To calculate the number of recommendations, four C-SPARQL queries
were applied: the first one counts the number of positive ratings for each POI, daily;
the second aggregates the result of query 1 for a whole week; the third computes the aggregation from query 2 for a month; and finally the fourth further aggregates query 3 for a whole year.
Figure 2.2: The BOTTARI Ontology (Image taken from [2] page 4)
In this research, the reasoning which was applied depended on the BOTTARI ontol-ogy definition which was developed especially for it, and as they were looking only for tweets related to Insadong restaurants, the number of tweets examined was small and so the streaming did not flood the system at all times. This means that the reasoning was not put under the kind of pressure that is usual in this type of investigation and the queries which were run did not experience the volume of tweets which could have degraded the aggregation task.
A study in [77], sought to discover the popularity of particular social events which occurred in a city. In relation to this, the researchers proposed an event-tweet pair coefficient as a metric for measuring event popularity. The dataset that was used for
the experiment consisted of two parts. First, a data-set collected from websites and portals reporting on social events occurring across London which contained, for each event, the title, the description, the date and time, the performer, the location, and the type of event. The second part of the dataset was the collection of tweets posted on Twitter from the 6th March to the 11th April 2013. The total number of the social events collected was 10033 and the total number of streamed tweets was over 4 million.
Streaming, in this research, was performed by applying CEP principles. The event
stream processing was performed using the Esper [75] software package. For each event in the social event list, they aimed to detect all tweets posted between the beginning and the end time of that event. Moreover, for every event-tweet pair an Association Coefficient method (AC) was performed (see Equation 2.1) to calculate the degree of association between the event and the tweet.
AC = 0.5∗P + 0.25∗W + 0.125∗L+ 0.125∗B (2.1)
whereP, B, and L are Boolean variables (equal to either 0 or 1). In more detail: if
the event’s performer is mentioned in the tweet’s text, then P = 1 , otherwiseP = 0; if
the event location is mentioned in the tweet’s text, then L= 1 ,L= 0 otherwise; and if
a brief description of the performer is mentioned in the tweet’s text, then B = 1, if not
then B = 0. The value of W on the other hand is equal to the number of words of the
event title which also appear in the tweet’s text, divided by the total number of words in the event title. The weights assigned to the metrics were based on common sense.
The period examined for this experiment was short, less than five weeks; we believe that given this, the study and its results cannot necessarily be generalized and serve as a foundation for future research into detecting events from Twitter. Also the processing used is only feasible when dealing with certain kinds of events (e.g., social events) which are known to be happening in advance, because in order to detect events the methods depend on the availability of the social event data-set.
Another, recent, study on social data analytics proposed the Social Set Analysis
(SSA) approach, which is more tied to the sociology of associations, the mathematics
of set theory, and advanced visual analytics [78]. The concepts were demonstrated by showing the way in which people’s actions on social media reflect real world events. More precisely, these researchers related user interaction on a social network (Facebook) to
16
real world events (before events, during events, and after events). This was presented via a Social Set Visualizer, which is an interactive visual analytics dashboard.
The garment industry in Bangladesh was chosen as a case study. They started by looking for events which were associated with garment factory accidents in Bangladesh; after this, news reports relevant to these, published via the traditional news media, were manually collected. Subsequently, using the SODATO tool [79], they retrieved the Facebook wall archives of the companies which were most frequently mentioned in these media reports (Benetton, Calvin Klein, Carrefour, H&M, JC Penny, Mango, Primark, Walmart, Zara, PVH, and E.C. Ingles). Once this was done, they designed and developed a “Social Set Visualizer” dashboard in order, mainly, to visualize a time-line of Bangladeshi garment factory accidents and Facebook Wall Activities.
In general, most research which has been applied to reasoning using social networks streams has mainly focused on post volumes rather than the text of the posts. However, we believe that the post text is also important and can provide further insights; at the same time, looking at the texts of posts could help in eliminating unrelated posts. Social media are filled with spam, advertisements, bot accounts that publish large volumes of posts, and internet memes [80]. As a result, in our study we will try to consider both the contents of the posts and the volume of the posts when reasoning to identify events.
2.3
Topic Detection Methods
Topic detection methods are generally classified under three major categories [81]: document-pivot methods, feature-pivot methods, and probabilistic topic methods.
2.3.1
Document-Pivot
In document-pivot methods, a topic is represented as a set of related documents. Typically such methods compute a similarity measure between either pairs of documents or between each document and a cluster. If the similarity measure exceeds a certain threshold value, then the document is added to the cluster, and if not, a new cluster is created.
Document-pivot approaches mainly differ in the ways in which they calculate the similarity between a pair of documents or between a document and a cluster. For instance, in [82] the similarity calculations were based on the Term Frequency-Inverse
Document Frequency (TF-IDF) weighting scheme. In general, theTF-IDF[83] scheme counts the frequency of a word (i.e. term) in a specific document compared to the inverse proportion of that word over the entire document corpus. It is used to evaluate how important a word is to a document in a corpus. Given a document corpus or collection
D, a word w, and an individual document d∈D. TheTF-IDFcalculation is shown in
Equation 2.2, where fw,d is the number of times w appears in d, |D| is the size of the
corpus, and fw,D is the number of documents in whichw appears in corpus D [83, 84].
wd=fw,d∗log(|D|/fw,D) (2.2)
So in [82], the similarity was calculated by comparing the TF-IDF score of the
incoming tweet with the TF-IDF score of the first tweet in each cluster, along with
the TF-IDFscore for the most common words in that cluster. This comparison results
in either the adding of that tweet to the best matching cluster or to the creation of a new cluster. Petrovic et al. in [85] aimed at detecting the first document discussing a
topic in a large corpus, which is called the First Story Detection (FSD) approach [86].
Conventionally the FSD identifies a new story if the incoming document’s similarity
with other clusters is lower than a certain threshold.
In [85], they proposed a modification of the FSD approach which involves the use
of Locality Sensitive Hashing (LSH), which is able to find the best
matching/most-similar document (the nearest neighbour in a vector space) in a faster way. Another approach, proposed in [87], uses a graphical model named Location-Time Constrained
Topic (LTT), which identifies the content, time and location of each social post. As a
result, a post is represented as a probability distribution and the similarity between two posts is calculated based on the distance between their distributions.
As stated in [88], a general issue with document-pivot approaches, when used with social media streams, is that not all documents (i.e. posts) are related to relevant topics (e.g., memes and spam are generally not). In addition, document-pivot methods are not always scalable with respect to large amounts of data, as this requires batch processing.
2.3.2
Feature-Pivot
The feature-pivot approach mainly focuses on grouping terms based on their occur-rence as representing a topic. It is a two-step approach, starting with selecting targeted
18
terms based on their frequency or burstiness, then clustering terms based on some inter-term similarities.
Feature-pivot approaches mainly differ with respect to the term selection criteria. For instance, in [89], term selection was based on an “energy” measure for each term. The term’s “energy” was calculated from both the term’s frequency and the importance of the user who made the post. Depending on its “energy”, a term was clustered using a graph based algorithm; the results of this process were used to detect events. In [90], the term selection was based on “bursty” terms (i.e. terms with a frequency higher than usual). Then bursty keywords were grouped using a greedy search to discover the emerging trends. Finally a trend analysis was applied in order to find keywords that were not necessarily bursty.
An alternative, segment based, term selection procedure was adopted in [91]. It was based on bursty segments (multi-words segments) rather than bursty single terms. Another approach, used in [92], is Event Detection with Clustering of Wavelet-based Signals (EDCoW), which selects terms by applying a wavelet analysis based on the frequency of terms then clusters the selected terms based on a modularity-based graph partitioning technique for representing an event.
The Frequent Pattern Mining (FPM) method, [32], has been used in feature-pivot
approaches to measure the co-occurrence of n terms instead of the co-occurrence of
pairs of terms [93]. Some studies which use FPM to detect topics are: [4, 39–41] (these approaches will be discussed further in the coming sections). In this thesis, we present a dynamic way to create a term selection criteria for a text stream; this dynamic method is based on the size of a sliding window and the frequency of the terms within it.
2.3.3
Probabilistic Topic Model
The probabilistic topic model treats the topic detection issue as a probability infer-ence problem. A topic is represented as a distribution between both terms and docu-ments.
A survey of probabilistic topic models in [94] showed that the most well-known
prob-abilistic topic model is the Latent Dirichlet Allocation (LDA) [95], whereby documents
are represented as mixtures of latent topics. The learning and interpretation inLDA is
performed, quite naturally, using variational Bayes [96] and other approaches including
and in [99], with application to Twitter. Another probabilistic topic model is Proba-bilistic Latent Semantic Indexing (PLSI) [100].
2.4
Event Identification from Twitter
In the current social network era almost everyone has now become a virtual broad-caster sharing an incredible number of messages, especially in this age of smart phones and the availability of mobile networks. Furthermore, the 2011 McKinsey survey [101] on the ages of social network users showed a 7% increase in the number of users within the age range 25-34, and a 22% increase in the number of users within the age range 35-45, even more surprising is the increase in ages 55-65 has been 90%. Although not all data generated through social networks is useful, we can benefit from the availabil-ity of the data in social networks across many areas and domains including, health, government and business.
Social networks are defined in [102] as web based sites that offer users the opportunity to build their own (public or private) profiles, in order to share posts and navigate though different connections belonging to other users. Twitter is a social networking service; it was launched in July 2006. A member in Twitter can post messages (tweets), follow accounts they are interested in, and other users can follow them in return — with their permission, if they have a private account, or without, if they have a public one. On your time line, you can view the tweets posted by you and the people you follow in real time. A tweet is a 140 character (in Nov 2017, the limit was doubled) message that a user creates to share what is happening, their opinions, and so on. In a tweet, you can include a hashtag (this # symbol proceeding a word or topic) to show that this tweet belongs to or discusses a certain topic. If you click that hashtag you will see all the tweets posted containing that hashtag. Also in a tweet, you can mention a specific user by using the symbol @username. Moreover you have the options to re-tweet or like a tweet which appears on your time line. The Twitter website is www.twitter.com.
For [86], an event is defined as a real world occurrence of something when it is associated with a real-world time-period and place. More specifically, the kind of event we are concerned with, in the context of social media in [103], is defined as the occurrence of something in the real world, which in turns initiates a discussion related to that event by different users just after it has occurred, or sometimes, in anticipation of its
20
occurrence. Another definition is found in [29], wherein an event is defined as “An occurrence causing change in the volume of text data that discusses the associated topic at a specific time. This occurrence is characterized by topic and time, and often associated with entities such as people and location”. Event identification is the process of looking for such events.
From the investigations conducted in [104, 105], it can be seen that Twitter can, essentially, be adopted as a medium for event detection. In more detail, Petrovic et al. in [104] compared Twitter with traditional newswires. They found that major events were covered by both newswires and by Twitter. However Twitter took the lead when it came to reporting on small or local events along with sports, political or business events. In [105], the authors examined how Facebook, Google Plus and Twitter report breaking news. They found that all the social media streams report similar events; however Twitter takes the lead in providing timely news, as compared to other Social Media streams.
One of the earliest attempts at detecting references to target events (such as an
earthquake) in Twitter streams in real-time was in [25]. These authors considered
Twitter users to be sensors who feel the occurrence of an earthquake, and the posted tweets as sensor readings. So they produced an algorithm to monitor tweets and to detect posts related to a target event. To classify tweets as either positive (referring to the target event) or negative (not related to the target event) they built a classifying
model, using the Support Vector Machine (SVM) algorithm, and trained it on a set
of tweets containing both positive and negative examples — so that it could, later, automatically classify tweets. For each tweet they assigned values to the attributes A, B, and C (see below), and then from these calculated the probability that the tweet referred to the target event.
A= the number of words in the tweet and the position of query words. B= the word id determined for each word in a tweet.
C= words before and after query word.
They performed an experiment on a Twitter stream sourced from Japan. The pur-pose was to find target events using the Twitter stream search API; this was applied
every second with the following query words {earthquake, shaking}. For each retrieved
tweet they found A, B, and C (as above); then they calculated the probability of the
2.3. Where n0(1−e−λ(t+1))/(1−e−λ) is the number of sensors at time t, and λ= 0.34.
P occur(t) = 1−Pn0(1−e−λ(t+1))/(1−e−λ)
f (2.3)
If (P occur(t))>0.95, then it was considered that an earthquake event had been de-tected via the Twitter stream, and so an email was sent to registered users. As a result of this work, email notifications were sent faster, and before the Japan Metrological Agency
(JMA) could do so — that is from the body responsible for broadcasting earthquake
events in Japan.
TwitterMonitor, in [90], was another contribution to this field. This is a system that performs trend detection on Twitter streams. It identifies the emerging topics (i.e., the trends) via a three step approach. This starts with finding the bursty keywords, then it proceeds to the discovery of emerging trends; this is performed (second step) by grouping the related bursty keywords via a greedy search strategy. Lastly a trend analysis is performed whereby tweets related to the detected trend are linked together in order to discover further keywords associated with that trend (that are not necessarily bursty). For each trend a chart is produced showing its popularity, and this is updated for as long as the trend is popular.
Another study is [91], proposed a segment-based event detection system for tweets. Basically tweet-segments are used instead of unigrams for the purpose of detecting events; this requires that a tweet-segment may consist of one or more tweet words. Then event-segments are formed by finding bursty tweet-segments; these are identified by applying a Gaussian distribution based on a predefined fixed time-window along with a consideration of the user frequency, which means looking at the number of users tweeting about a certain segment. Candidate events are found by using a clustering
algorithm to group event-related segments. Finally Wikipedia 1 is used as a knowledge
base to filter the detected events.
TwiCal was a system created by the authors of [106] which extracted events from Twitter and categorized them into an open calendar. It extracted a 4-tuple representa-tion of events from Twitter, which comprised the attributes: named entity, event phrase, calendar date, and event type.
These authors started by targeting tweets which mentioned temporal keywords (to-day, tomorrow, next week, month names, etc.), and in this way collected 100 million
22
tweets in a corpus. From the collected tweets they extracted named entities using
Nat-ural Language Processing (NLP) tools specially trained on tweets [107]. After that, to
find event phrases, which could potentially occur using various different parts of speech,
they applied their Part Of Speech Tagging (POS) tagger which was built using
dictio-naries of event terms gathered from WordNet [108]. Finally, the extracting of temporal expressions was achieved using TempEx [109] which takes as input a reference date such as for instance “next Friday”, “tomorrow”, or “August 21”, plus some text, and also an indication of the part of speech of the latter — from their tagger. Classifying and rank-ing the extracted events was performed accordrank-ing to the frequency of tweets appearrank-ing with the same named entity and date (the higher the frequency, the more significant the event). In addition, events had to be tied to unique days, which means not appearing in most calendar days, this was done to avoid insignificant events.
A subsequent work which also extracted events was the work by Zhou et al. [110]. These authors wanted to improve the TwiCal [106] process, which extracts events by looking for representations of named entities, event phrases, calendar dates, event types, and locations. Each of these items of data was stored as part of a tuple.
The four-value tuple adopted was (y,d,k,l), where y stands for named entity, d for
date, l for location, and k for event related keywords. First they performed a
pre-processing step to assign values to these elements within the tuples. Hence, to recognize
time expressions in order to fulfil the d tuple, they used SU-Time [111] method which
is a temporal expression recognizer. This takes, as input, text such as “next week”, or “tomorrow” plus the text’s posting date and then outputs a more expressive date.
Extracting named entities (theytuple value) from tweets was based on news articles
published at (roughly) the same time that the tweets under examination were posted. Using the Stanford named entity recognizer [112], they looked for named entities in news articles. They decided to do this because tweets suffer from spelling mistakes and abbreviations, besides a study carried out by Petrovic et. al. in [104] found that events mentioned in tweets are also found in news articles at around the same time period. So they created a dictionary containing the recognized named entities from news articles,
and used that dictionary to extract location named entities l and non-location named
entities y from tweets. Finally, to find event related keywordsk they used a POS tagger
trained on tweets by [113], in which only words tagged as noun, verb, or adjective are taken account of. Stemming was applied to these words as well, and words appearing
less than three times were removed.
The output of the pre-processing step (y,d,k,l) was used to find events via their
proposed Latent Event Model (LEM). In the LEM model, an event is represented as a joint distribution of named entities, dates, locations and keywords. This representation encourages events sharing the same named entities and keywords, and appearing at the same time and location to be combined as the same event. They applied an experiment on a data set containing 2468 tweets already associated with 21 events in advance, from [104]. With their method of extracting events, they outperformed TwiCal [106], which they considered their benchmark, by over 7%.
A study by [114] was dedicated to identifying the content which was most relevant
to events from Twitter in real-time. Their aim was to use the TF-IDF algorithm on
documents, rather than on single tweets, in order to construct vectors. As theTF-IDF
performs better on long paragraphs rather than short, noisy sentences (i.e. tweets). They wanted to benefit from the use of hashtags (#) in tweets to identify events and the content relevant to events. Thus, they used the Twitter stream API to retrieve tweets and these tweets were then sliced according to their time of posting into frames. In every frame, all hashtags which appeared more than five times were considered potentially relevant hashtags, afterwards a hashtag based document was created for every such hashtag.
Next, they used the Twitter Search API to retrieve all the tweets which included at least one potentially relevant hashtag within a certain time period. All tweets related to any one of these hashtags are placed in a document corresponding to the hashtag. Subsequently, they stemmed every document and then analysed it by removing stop words, repeated characters, twitter notations, and URLs. The remaining words were tokenized on a unigram basis using Mahout. These tokens were the document based vectors and were then used to find event relevant content. The union of all these vectors created the hashtag-based vector.
A more recent attempt at event detection, described in [115], identifies bursty topics from Twitter using a sketch-based topic detection model. Bursty topics are detected via a two-step method: first, a “sketch” data-set maintaining the total number of all tweets, the occurrence of each word and the occurrence of each word pair was constructed. Bursty topics were identified using the sketch data-set. Second, to cope with scalability but maintain topic quality, a hashing reduction technique was applied.
24
A recent and detailed survey on research into event detection from Twitter streams can be found in [103].
2.5
Frequent Pattern Mining
Frequent patterns are sets of items or transactions that occur in a dataset with a
fre-quency of no less than a predefined threshold value, which is referred to as theminimum
support [93]. In general, Frequent Pattern Mining (FPM) searches for repeatedly
occur-ring relationships in a given dataset. Theminimum support is a predefined value that is
related to the frequency of occurrence of patterns. A pattern is said to be frequent if its support (occurrence frequency) is no less than the predefined minimum support value. An itemset or a transaction is formed of a collection of one or more items. An example of an itemset that may appear frequently in a supermarket database is milk, bread, eggs, where the items are milk, bread, and eggs. Frequent patterns have played an essential role in finding correlations, mining associations, and many more data analysis tasks.
FPMwas first proposed for market basket analysis research by Agrawal et al. [116].
In that application, it was used to analyse customer shopping baskets in order to find
associations between the items that they had bought. The FPM method introduces
three basic frequent itemset mining methodologies: [32] a-priori [117], FP-Growth [118], and Eclat [119].
FP-Growth is a frequent itemset mining method which requires fewer numbers of database scans than the other techniques, necessitates no candidate generation, and works in a divide-and-conquer way. It is suitable for situations where there are very large numbers of database transactions and also for situations where there are relatively long patterns [3].
Generally, FP-Growth is a 2-step strategy, starting with the construction of a com-pact tree (the FP-tree) that is then mined to find frequent patterns (the mining is step 2): thus eliminating the need to mine the whole dataset. Specifically, step 1 starts by scanning the given dataset to find frequent items (only items satisfying the minimum support value criterion are retained), along with sorting the set of items or transactions in a descending order according to their support count. Then the FP-tree is built from a single root node, and such that there is a tree branch for each transaction in the dataset (this requires a 2nd dataset scan). Figure 2.3 shows the FP-tree construction process
in more detail, wherein the dataset is only scanned twice in order to build the FP-tree. Step 2 consists of mining the constructed FP-tree to find the set of frequent patterns evident in the given dataset via the FP-tree (Figure 2.4 shows the overall picture re-garding step 2). From the FP-tree, the mining starts with the least frequent item as the initial suffix of a pattern, and construct its conditional FP-tree. The conditional FP-tree consists of the set of prefix paths in the FP-tree co-occurring with that suffix. This results in the size of the dataset needing to be searched in order to find frequent patterns being reduced, only the conditional FP-tree need to be examined in order to find the frequent items related to the specific suffix. Recursively the same process is applied for each item until the most frequent item is reached. Concatenating the suffix pattern with the frequent patterns generated from its conditional FP-tree leads to the generation of frequent patterns.
Figure 2.3: FP-tree Construction (Algorithm taken from [3] page 58)
2.5.1
Frequent Pattern Mining from Online Data Streams
Online data streams share a number of features which are currently considered rea-soning challenges. These data streams are of unknown size, their data arrival rate is irregular, and only a single scan, with no backtracking, is possible [120]. Examples of such streams are readings from sensors, Internet and web traffic, stock exchange data, etc. The traditional methods for data mining frequent itemsets in a static DB require a
26
Figure 2.4: The FP-tree Mining (Algorithm taken from [3] page 67)
number of DB scans. However this is not applicable to online data streams due to mem-ory and computational constraints. Therefore traditional methods cannot be applied directly to data streams.
It is impossible to consider the whole data stream in a single scan, only a subset of it can be looked at. According to [121] mining frequent itemsets from data streams methods fall into one of the following categories: landmark [122], tilted-time window (fading) [123], or sliding window [124].
A landmark model considers all data from a specified point in time “a landmark” to the present time. Usually the start point is the beginning of the stream; and it treats all data equally within that period. A fading model works in the same way as the landmark model except it assigns different weights to different items of data. New data transactions are given higher weights than older ones, on the basis that it considers the latest data to be the most important. Finally the sliding window model uses a sliding window that slides over the data stream to find frequent itemsets. This window can either be a transaction based window, consisting of a fixed number of transactions, or a time based window of a fixed length of time.
Finding frequent itemsets in a datastream using the frequent pattern mining either depends on the complete arrival of transactions to form a batch (i.e. all transaction
![Figure 2.2: The BOTTARI Ontology (Image taken from [2] page 4)](https://thumb-us.123doks.com/thumbv2/123dok_us/1453073.2694472/26.892.166.782.467.802/figure-bottari-ontology-image-taken-page.webp)