MARTIN, K., LIRET, A., WIRATUNGA, N., OWUSU, G. and KERN, M. 2019. Developing a catalogue of explainability
methods to support expert and non-expert users.
In Bramer, M. and Petridis, M. (eds.) Artificial intelligence XXXVI:
proceedings of the 39th British Computer Society's Specialist Group on Artificial Intelligence (SGAI) International
conference on artificial intelligence (AI 2019), 17-19 December 2019, Cambridge, UK. Lecture notes in computer
science, 11927. Cham: Springer [online], pages 309-324. Available from: https://
doi.org/10.1007/978-3-030-34885-4_24
Developing a catalogue of explainability
methods
to support expert and non-expert users.
MARTIN, K., LIRET, A., WIRATUNGA, N., OWUSU, G., KERN, M.
2019
This document was downloaded from
https://openair.rgu.ac.uk
Developing a Catalogue of Explainability Methods to
Support Expert and Non-Expert Users
Kyle Martin1[0000−0003−0941−3111], Anne Liret2[0000−0003−0620−7240], and
Nirmalie Wiratunga1[0000−0003−4040−2496], Gilbert Owusu3, Mathias Kern3
1
Robert Gordon University, Aberdeen, Scotland
{k.martin, n.wiratunga}@rgu.ac.uk
2 BT France, Paris, France
3
British Telecommunications, London, United Kingdom
{gilbert.owusu, mathias.kern}@bt.com
Abstract. Organisations face growing legal requirements and ethical responsi-bilities to ensure that decisions made by their intelligent systems are explainable. However, provisioning of an explanation is often application dependent, caus-ing an extended design phase and delayed deployment. In this paper we present an explainability framework formed of a catalogue of explanation methods, al-lowing integration to a range of projects within a telecommunications organisa-tion. These methods are split into low-level explanations, high-level explanations and co-created explanations. We motivate and evaluate this framework using the specific case-study of explaining the conclusions of field engineering experts to non-technical planning staff. Feedback from an iterative co-creation process and a qualitative evaluation is indicative that this is a valuable development tool for use in future company projects.
Keywords: Machine Learning · Similarity Modeling · Explainability · Informa-tion Retrieval
1
Introduction
Growing social and ethical responsibilities are being faced by organisations to ensure that decisions made by their intelligent systems are explainable. These responsibilities are supported by European legislation which dictates ’an individual’s right to an expla-nation’ and ensures that organisations are held accountable for the decisions made by these systems [4]. Furthermore, there is a need at an operational level for users to better understand the systems they are using to achieve superior working performance, nurture trust and ultimately increase productivity [11,15]. In a real-world case, the quality and benefits of explanation depend on how timely and comprehensively they are produced. However, explanations are typically crafted to respond to specific user needs and specific applications [1,2,11]. This practice is both time-consuming and inefficient. We believe that there are overlaps between the requirements of an explanation for different applications. In particular, we believe that responding to user needs can be effectively achieved by co-creating and co-maintaining explanations between the developer and
British Telecommunications plc 2017 Feedback Monitoring DB Application Retraining Classification Update Explanation Review External Knowledge Sources DB
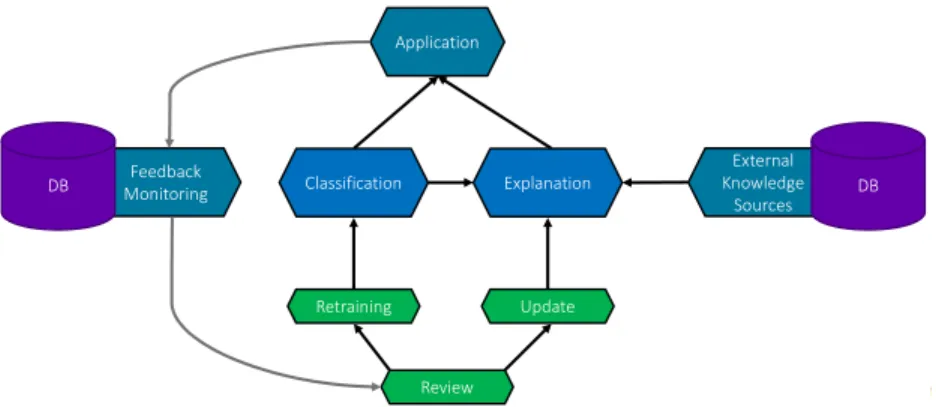
Fig. 1: A flow diagram of the developed system, displaying its linked components.
the user. We are therefore motivated to create a general purpose explanation framework which can interface with a broad variety of projects across an organisation to reduce the cost of provisioning an explanation for individual applications.
We present a framework formed of three components; a classification engine, an explanainability engine and a feedback loop to ensure iterative refinement (see Fig-ure 1). The classification engine is completely modular, and can be switched with other learned models as necessary. The explanation engine operates upon the classification engine’s output (as well as some external knowledge bases), incorporating a catalogue of explainability techniques to provide transparency around system decision-making and improve user understanding of the source data. Three progressive levels of expla-nation content have been developed: low-level explaexpla-nations which provide key insights on the data; high-level explanations which generate relevant sentence summaries; and co-created explanations, where user needs are combined with extra knowledge (either from external source of information or from user detailed feedback). The purpose of this approach is to target an increasing quality of explainability support.
We demonstrate the capabilities of this explanation framework with the real-world use case of improving the transfer of information between telecommunication field en-gineers and desk-based planning agents. In this use case, the treatment of complex orders (such as fibre access installation) requires decomposition into a chain of tasks, together described as an ’order journey’. Each individual task can involve various exter-nal dependencies (e.g. traffic management, hoist, digging) and be subject to hazards or delays. Throughout the journey, planning agents must decide the next action to progress the order on the basis of notes reported by technical engineers. However, understand-ing these notes can be challengunderstand-ing for non-experts in telecommunication engineerunderstand-ing. Therefore, to support planning agents we have developed a recommender system to identify the most appropriate scenario for a given query note. This recommender acted as the classification engine to test our framework, and allowed the opportunity to co-create various explanation methods with a real user base. Though we have adopted a specific use case for this model, one can imagine that the explanation engine could be integrated with any classifier model in future.
The contributions of this paper are as follows. Firstly, we (1) outline the develop-ment of a modular explainability framework and detail several of its sample modules. We (2) implement a live version of this catalogue to answer the real-world problem of supporting desk-based planning agents. Lastly, we (3) perform a qualitative evaluation to understand user opinion on the quality of provided explanations.
The paper is structured in the following manner. In Section 2 we provide some de-tails on related work. In Section 3 we motivate the need for our framework through the use case of improving the transfer of information between technical field engineers and desk-based agents. In Section 4 we provide details about our explainability framework and give examples for each of the categories of low-level, high-level and co-created explanations. In Section 5 we detail the user interface of the web service application and provide images of example usage. In Section 6 we provide details of a qualitative evaluation on explanation quality. Lastly, in Section 7 we offer some conclusions.
2
Related Work
At an individual level, a user’s need for an explanation is often characterised by a dis-crepancy between the formal objectives of the learned model and its practical applica-tion [9]. In practice this can occur when the expectaapplica-tions of a system’s user group do not match up with one another, or are not aligned with the system’s output. A common cause for this is when individuals’ capabilities and expertise are not considered [18]. Understanding the relationship between the needs of a technical expert and the needs of a non-technical user is of fundamental importance for the success of a deployed indus-trial application [16]. It is often the misalignment of objectives between these two par-ties, or the inability to effectively transfer information between them, that leads to costly errors. In domains such as field service provisioning for telecommunication organisa-tions where the technical experts heavily rely upon their non-technical counterparts for administrative and logistical purposes, it is vital that a clear and understandable flow of information is maintained between the two groups.
In [14] the authors suggest that users of an intelligent application can be divided into three groups (novice users, domain experts and AI experts), each with distinct expla-nation needs. While AI experts are usually satisfied by global explaexpla-nations describing how the learned model operates, novice and non-AI knowledgeable domain experts are more likely to require local explanations contextualised by specific input-output exam-ples. However, there remains a wide gap between these latter groups in regards to their contextual domain knowledge. This motivated us to develop a catalogue of explana-tions with progressing levels of contextualisation and user involvement, allowing users to utilise the most suitable combination of explanation mechanisms to meet their needs. Importantly, the framework should be accessible and easily navigated via a clear structure. The authors in [19] propose five goals that an explainable system should be able to achieve: it should be (1) transparent; (2) able to justify its decisions; (3) sup-port the user in their ability to conceptualise necessary features; and (4) ensure that the approach adopted by the system is relevant to the problem. These aspects should (5) support the user in their ability to learn both about the system and the problem
do-main [19]. Aligning explanation mechanisms with their goal clarifies what information is being provisioned, directing the user towards explanation that best meets their needs.
3
Use-Case - Explaining Engineering Notes to Desk-Based Agents
The personnel within complex services provisioning for telecommunication organisa-tions can be broadly divided into two categories; the specialist-skilled workforce who fulfill the required technical work (such as field engineers) and those who support them in their capacity to do so (such as planning agents). In regards to this former category, we highlight the telecommunications field engineering force whom develop expertise in network equipment installation and repair. Field engineers are allocated tasks to ensure continuous service delivery. In this domain, a task typically represents a time-sensitive activity on a piece of equipment (such as maintenance, installation or decommission-ing) or interacting with and responding to customer inquiries (both home and business). As part of work force auditing, field engineers record information about the tasks they have completed in text documents called ”notes”. These notes form a knowledge-base of experiential content and are comprised of rich, heterogeneous information.
From the other perspective, one of the responsibilities of planning agents is to incor-porate knowledge sourced from task update notes to identify and regulate suitable task intervention or assistance. We describe this process as anticipating the next ’scenario’ for a given task. Though these agents develop aptitude in understanding some aspects of telecommunication engineering, they are not experts nor do they benefit from the expe-rience or training that technical experts receive. The result is an increased likelihood of human-error and decreased efficiency when they interpret engineer notes to anticipate the appropriate scenario, particularly in cases where the notes are complex.
A recommender system offers means to support the desk-based agents in their work and pave the way for potential automation of this task in future. However, such a system would need to prove its trustworthiness for real-world application through transparent and explainable decision-making. The goal of the system is therefore to identify the appropriate scenario for a desk-based agent given an engineering note and explain why that scenario was selected.
3.1 The Dataset
We extracted 46 days worth of engineering note data, spread between the months of May, August, September and October. In total, we extracted approximately 6,800 task notes over 33 unique scenario types (classes). We then removed any class which con-tained less than 5 examples. It also became clear that a certain scenario, ”No New Action Required” (NNR), was fully reliant on external information and not on the con-tents of the note. This was because the NNR class was only relevant if a scenario had already been organised for a given task. Based upon feedback gained from co-creation with the user group, we decided to remove this class until the external data source was available. The resulting dataset contained 5,343 notes spread between 29 classes. There was notable class imbalance, with the rarest class containing only 20 notes while the most populated class contained 1,200.
3.2 Evaluation of Classification Engine
We performed an exploratory evaluation to understand the effectiveness of different representation learners and classifiers on the above dataset by creating a classifica-tion task where notes were classified according to one of 29 scenarios. The dataset was divided into distinct training and test sets using 5-fold cross-validation. We con-sidered both a distributional (term-frequency/inverse-document-frequency) and a dis-tributed (Document-2-Vector) method of learning representations. We also considered three classification methods - k-Nearest Neighbour (kNN), Logistic Regression (LR) and a Multi-Layer Perceptron (MLP). We used accuracy in a classification task as a proxy measurement for representation goodness.
Term frequency-inverse document frequency (tf-idf) is a statistical measure to de-velop representations for documents in a corpus based upon the terms they contain. The value for each term is calculated by dividing the frequency of its usage within a document over the number of documents which contain the term within the corpus and controlled by a normalising factor [17]. Therefore, each feature of a document vector is a value which represents an individual word from the corpus vocabulary and so vectors can be very sparse. Document-2-Vector (Doc2Vec) [8] is an extension of the Word2Vec algorithm [12]. In Word2Vec, the representation for each word is learned by training a small neural network on word co-occurence. The neural network learns a representation for each word such that words with similar context will have a similar representation. The result is a representation of each word which is indicative of how it relates to every other word in the vocabulary (which gives an idea of what concepts the word belongs to). In its simplest form (and the one we use in this work) Doc2Vec is merely an average of the word embeddings to give a representation for a document.
Linear regression is a statistical approach where the classifier learns a predictor function to model the relationship between a document and each of its features. When this function is averaged across a large set of documents it tends to generalise well to unseen examples. We can then apply this function to get a label for query documents. K-NN classifies a query document based upon a (potentially weighted) vote of thek
most similar examples from a set of documents. The valuekis an integer to threshold the number of neighbours to consider during the voting process. Weighted variations of k-NN ensure that the most similar documents will have more weight during voting. An MLP is a neural network trained by providing a large number of labelled examples to learn a set of weights and biases which approximate the relationship between each document and its label. Once sufficient accuracy is achieved through training, these weights and biases can be applied to a query document to establish the probability of the document belonging to each label which was provided during training. We take the label with the maximum probability as our classification.
The hyperparameters for both representation learners and all three classifiers were optimised using a gridsearch. In the case of tf-idf, this meant data was pre-processed by removing stop words and stemming words to their root form. We then considered the 300 most common unigrams (n-gram range of 1) to build a representation. Finally, this output was normalised using cosine normalisation. For Doc2Vec, a window size of 10 was used to identify semantically related words and generated a representation of 300 features. In regards to our classifiers; for kNN this meant we used the 5 nearest
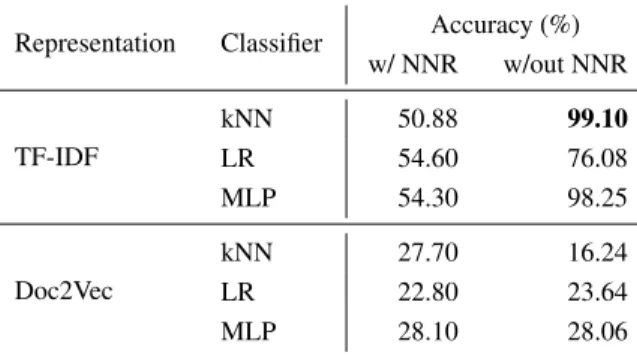
Table 1: Classifier performance on tf-idf and Doc2Vec representations with/without NNR class.
Representation Classifier Accuracy (%) w/ NNR w/out NNR TF-IDF kNN 50.88 99.10 LR 54.60 76.08 MLP 54.30 98.25 Doc2Vec kNN 27.70 16.24 LR 22.80 23.64 MLP 28.10 28.06
neighbours and the voting mechanism was weighted by distance and for LR, we used L2 penalties with no class weighting and a maximum of 100 iterations. Lastly, our MLP classifier was formed of a single layer containing 100 neurons. This was trained for 200 epochs using ReLU activations and a categorical cross-entropy loss function supported by the Adam optimizer [7].
3.3 Results and Discussion
The results of the experimentation can be seen in Table 1. Tf-idf offered superior per-formance on this problem when compared to Doc2Vec, both when including the NNR class and when not. This is for two reasons. Firstly, Doc2Vec (like other neural network based approaches) commonly requires a large training set to function very effectively. Pre-training of a Doc2Vec model is also not valid here, due to the high usage of unique technical vocabulary in the notes. This also informs the second reason for the better classification performance achieved by representations learned via tf-idf. The likely scenario for a given note is highly reliant on the technical vocabulary which is used to describe the work performed as part of the task. In light of this we also tried a simple rule-based token-matching approach, but its performance did not match either of the above methods. This suggests that the additional information that tf-idf offers about term rarity (in the form of its idf portion) is important.
Removing the NNR class offers a much improved performance for the classifiers using representations gained from tf-idf. As above, this is likely due to the focused technical vocabulary of the notes, a mixture of which would be used throughout the NNR class. This is misleading, as the vocabulary used within a note is irrelevant to whether it should be classified NNR or not. Hence the decision to remove the NNR class from our dataset. That said, it is interesting to note that (with the exception of kNN) removing the NNR class did not overly affect the classification accuracy gained from the Doc2Vec representations. We take this as further support that a much larger volume of text would be needed to ensure that Doc2Vec could function effectively on this problem. This is supported by the improved performance of kNN on Doc2Vec representations when the NNR class was present. Direct similarity comparisons are
more likely to suffer than approaches that perform further feature engineering, when the learned representations are non-optimal.
As a result of this evaluation, we elected to use representations learned from tf-idf and classified according to kNN as the classification engine for our use case.
3.4 Co-Creation of Explanation Methods
The use case also offered a platform for co-creation to identify what the users con-sidered important aspects of explanation. Meetings with the end user group or their managerial representatives occurred weekly throughout development of the framework. There were two important findings that were identified throughout these meetings. Firstly, the desired explanations were to be counterfactual, supporting findings in [13]. Co-creation participants were particularly interested to understand why a certain sce-nario was recommended before another, and what made a given note unique among similar notes. Secondly, and most surprisingly, was that participants believed explana-tion should highlight informaexplana-tion important to human decision-making even if it was not relevant to the system’s classification process. It was agreed among most of the con-tributing participants that this was important to establish trust in the system. Though initially this caused debate about the remit of the framework, we ultimately established the scope of our explanation; since the framework should be generalisable to every level of expertise within the business, if additional information was required to make sense of the classification or source data, then this should be offered. This meant that it was relevant to consider the provision of supporting information for example.
4
The Explanation Engine
In this paper we present a framework of explainability mechanisms that support a clas-sification engine by explaining its output. The idea is that combining different mecha-nisms will ensure generalisablility of the framework. We divide mechamecha-nisms into three categories:
– Low-level explanations methodsallow the user to visualise key information that provide insight to system decision-making and support interpretation.
– High-level explanation methodsaugment one or more low-level explanations with contextual information to enable more comprehensive explanation.
– Co-created explanation methodsrely on user interaction to better emulate the subjectivity of personal recommendations.
We provide an example of a module from each category below. Furthermore, as inspired by [19], we highlight each goal that a specific module is designed to achieve.
Though the use case we have selected for discussion in this paper is confined to the use of textual data, the goal of the framework is to be data agnostic. The idea is that this will provide a resource for developers within the telecommunication organisation to easily and quickly integrate with their projects. Effective cataloguing (i.e. allowing searching by explanation type, the explanation goal it supports and data type) is key to provisioning a maintainable and accessible framework.
4.1 Low-Level Explanations
Low-level explanation methods describe key information directly extracted from the data itself or generated as part of the decision-making process. In the literature these are described as analytic explanations [14].
Confidence Measures We can establish the confidence of our predictions with the traditional method of using similarity as a proxy [2]. If similarity is sufficiently high, we can be confident that our classification is correct. We base our confidence on the similarity of the nearest neighbour from a given label (which is the method that we have used in deployment). Confidence measures can be seen as a form of justifying the decision which has been made by the system.
Word Scoring and Overlap Inspired by work in [11], where the authors found that it was important for users to understand the differences between a query and its neigh-bours, we designed this module to promote understanding of the impact that note vo-cabulary has on system decision-making. The overlap component identifies key terms which appear both in the query and within the neighbour set of a particular label. This enables the user to quickly visualise key similarities or differences between the notes and inform about complementary terms from similar notes in the corpus. The word scoring module then measures the activation of terms to highlight the influence of each term’s local similarity on selection of a given neighbour note.
This method can be extended to cover phrases or distributed approaches [1]. Word scoring and identification of overlapping terms is a method of improving the user’s ability to understand the underlying concepts of system decision-making and improve interpretability of the process.
4.2 High-Level Explanations
While low-level explanations identify key information about the query or recommenda-tion, they are potentially inaccessible to non-expert users. In these scenarios, it would be helpful to give the information context by incorporating relevant background knowl-edge. High-level explanations cover verbal and visual explanations [14], which are gen-erated by building on insights from low-level (analytic) explanations. In this work, we use the example of generating summaries to contextualise similarities and differences between notes based on the output of the ’word overlap and scoring’ component.
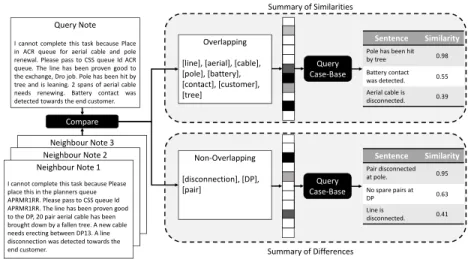
Summarisation of Similarities/Differences We consider a method of extractive sum-marisation to create a verbal explanation of similarities and differences between a query note and its neighbour set. First introduced in [10] as a means to create abstracts for journal papers, extractive summarisation is reliant upon the identification, extraction and combination of content representative sentences to summarise a document. It is ap-plicable in domains where documents share unique technical vocabulary, such as law reports [6] or research papers with similar focus [3]. Our method of summarisation builds upon those mentioned. Given a query and a neighbour note (or set thereof), we
I cannot complete this task because Place in ACR queue for aerial cable and pole renewal. Please pass to CSS queue Id ACR queue. The line has been proven good to the exchange, Dro job. Pole has been hit by tree and is leaning. 2 spans of aerial cable needs renewing. Battery contact was detected towards the end customer.
Query Note
Neighbour Note 3 Neighbour Note 2 Neighbour Note 1
I cannot complete this task because Please place this in the planners queue APRMR1RR. Please pass to CSS queue Id APRMR1RR. The line has been proven good to the DP, 20 pair aerial cable has been brought down by a fallen tree. A new cable needs erecting between DP13. A line disconnection was detected towards the end customer.
Compare
Overlapping [line], [aerial], [cable], [pole], [battery], [contact], [customer], [tree] Non-Overlapping [disconnection], [DP], [pair] Sentence Similarity Pair disconnected at pole. 0.95 No spare pairs at DP 0.63 Line is disconnected. 0.41 Query Case-Base … Query Case-Base … Sentence Similarity
Pole has been hit by tree 0.98 Battery contact was detected. 0.55 Aerial cable is disconnected. 0.39 Summary of Differences Summary of Similarities
Fig. 2: Summarisation of similarities/differences between a query note and a set of neighbours.
are interested in summarising the similarities or differences. This means we are gen-erating a summary from a list of overlapping and non-overlapping terms, as opposed to generating a summary from a full document. Essentially, we are augmenting the technical vocabulary which is highlighted by the low-level ’word overlap and scoring’ mechanism and giving context to that information with free text.
From the notes, we generate a case-base of sentences which will act as summaries. Each note is divided into multiple sentences by slicing at natural end points (such as the end of a sentence, or beginning of a new topic). We transform these sentences in the same way as our full dataset, which in the case of the above problem means that their word contents have been stemmed, stop words removed and transformed using tf-idf. When the classification model is queried, we identify overlapping (or non-overlapping) words between the query and its return set. We transform this list with our representation learner to create a vector which is used to query our summarisation case-base and find the most similar sentence to act as a summary of similarities (or differences). This process is demonstrated in Figure 2. Words can be weighted using their idf score to emphasise rare terms and we can integrate aspects of query expansion from information retrieval research and augment queries with further information using local context.
This summarisation method produces a sentence in the engineers own words. This is useful for two reasons. Firstly, when engineers use the system it can be reassuring and trust building for them to see the difference clearly in their own words. Secondly, in the instances where non-experts are using the system, the summary of similarities and differences can expose them to language that engineers use in a controlled envi-ronment and supported by the other low-level explanation methods. This can improve learning about the original source data. However, autonomously evaluating the quality of explanations gained in this manner is difficult. Though we can empirically measure whether the retrieved sentence is sufficiently similar to (or different from) the query, it is difficult to identify whether the retrieved sentence is a meaningful summary
with-out qualitative examination. As such, as part of our future work we are investigating methods of autonomous explanation quality measurement.
4.3 Co-Creation of Explanations
Co-created explanation methods offer a means to ensure that explanations are always relevant to user needs. As with many other specialist areas, the field of telecommunica-tion engineering is dynamic and any model or vocabulary learned is unlikely to remain stable for any significant length of time. This problem is often described as concept drift [20]. There must be some concept of updating both classification and explanation engines to correspond to the evolving needs of the user and the organisation as a whole. We explore this further in our example module below.
Provision of Supporting Information As is often the case when non-expert users are exposed to a technical vocabulary they are unfamiliar with, desk-based agents are forced to use the context of a given term (or phrase) to infer its meaning if they do not understand it. This can pose an issue in instances where the meaning is incorrectly inferred, or when its importance to the next scenario is misunderstood. Thus there is a need to provision supporting information that can assist a desk-based agent’s under-standing of the query task. In our target use-case, this takes the form of highlighting terms that present potential hazards for a task.
Hazard terms are identified from the notes by consulting an external knowledge base which we have extracted from 2 documents summarising UK and EU government health and safety guidelines for telecommunication and underground work. If a term (or phrase) is identified as a hazard, we can highlight it within the application. Hazards can be scored by severity, meaning that we can differentiate the danger by presenting a simple LOW, MEDIUM, HIGH score. Maintaining the knowledge base and ensur-ing it meets the needs of the organisation is then a co-operative exercise between the developer and the user. It is the developer’s responsibility to ensure that the original knowledge base is up to date (e.g. by keeping up with the latest health and safety regu-lation) to lessen the data collection burden on users. Users are expected to add missing hazard terms to the knowledge base as they appear through daily use, such that they are known for future. Conversely, if users feel that a term should not be identified as a hazard, we can prevent the term from being highlighted as a hazard for that user group in future. In such a way the knowledge base is personalised to the needs of specific user groups. An example of where this is relevant is in the case of ’optical fibre cabling’. Optical fibre cabling is highlighted as a hazard in both guideline documents due to the potential for permanent eye damage if suitable protection is not worn when installing a main line. In practice this is only relevant to one engineering worktype (underground), whereas others (such as consumer delivery) are routinely installing home optical fibre cabling, which has significantly reduced risk.
5
The Application
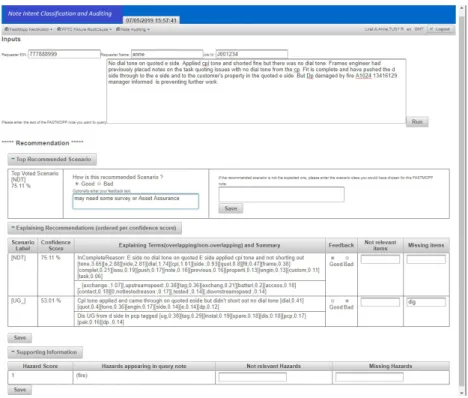
We have deployed a prototype of the described framework applied to our use case and accessible on the company intranet as a web application (see Figure 3). When a query
Fig. 3: Example of the system in action.
is entered, the application uses the classification engine to make recommendation from the known 29 scenario labels and guide task intervention. For example, in Figure 3 the system has recommended the scenario NDT (No Dial Tone), which will be translated into the followup action ’further equipment tests’. In response to a recommendation, users may feedback on whether it is ’good’ or ’bad’ and optionally enter feedback text and a corrected label. The user can access an ordered list of other potential scenarios by selecting ’Recommending Other Scenarios (ordered per confidence score)’.
The application uses the explainability framework to explain the ordered list of rec-ommendations. We compare the query to each label by aggregating the explanations for each note within the kNN neighbourhood that possesses that label. The confidence of the recommendation of each scenario is based upon the similarity of the nearest neigh-bour with that label, while direct note comparisons (e.g. the word scoring and over-lap) are aggregated using a distance-weighted average. The focus of this explanation is therefore linked to identifying the most suitable scenario to be recommended. This allows the system to demonstrate the similarities and differences between a query and each label by displaying the identified overlapping and non-overlapping terms ordered by their score. A sentence summary (generated by the method defined in Section 4.2) then contextualises this information. There is also a mechanism for the user to feedback on the explanation to improve further query note explanation mechanisms. Finally, sup-porting information is highlighted for the label and each query.
6
Evaluation of Explanation Framework
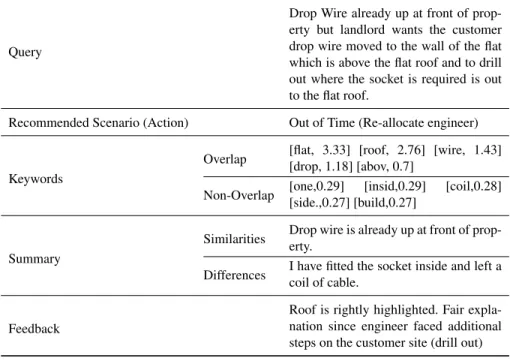
Evaluating the quality of explanations is traditionally difficult due to their inherent sub-jectivity. The needs of different user groups can be very different, which is reflected in their expectations of what an explanation should offer. With this in mind, we evalu-ate the quality of explanations using qualitative feedback from telecommunication field engineers. Technical experts were selected to identify whether explanations emulated their decision process, as was requested during co-creation. We retrieved qualitative feedback on explanation quality from individual engineer comments verbally commu-nicated during a beta test of the software. In total we observed 23 interactions between users and the system. All users provided a simple positive/negative score on whether the provided explanation was useful, and 17 also provided qualitative feedback. An example of feedback (and the explanation case it refers to) can be seen in Table 2.
In this paper we measure the effectiveness of our explanation by applying the model suggested in [5]. The model divides evaluation of an explainable systems into five dif-ferent headings: user satisfaction (e.g. the clarity and utility of the explanation); mental model (e.g. the ability to understand individual decisions and identify strengths and weaknesses of the model); task performance (e.g. whether user ability to complete the task is improved by using the system); trust assessment (e.g. whether the system is trustable); and correctability (e.g. the user can rectify incorrect decisions). We examine each of these aspects in turn. As the model is live as a prototype, we cannot measure its impact on task performance, but we plan to do so in future.
6.1 Results and Discussion
User satisfaction with the system seems reasonably high. Of the 23 interactions with the system, 15 (65%) users left positive feedback regarding the explanation quality. Word matching and scoring was the most popular explanation mechanism, with almost every observed engineer discussing the selected words (both formally as recorded comments and informally with the researcher). Though summaries were observed, they were not discussed in the same level of detail. This is indicative that domain experts require less contextualisation from an explanation to understand it, likely because they can infer their own context. In future work, it will be interesting to compare the explanation needs of engineers (technical experts) against planning agents (non-experts) to identify different usage of the growing framework.
One disadvantage of this was that although engineers understood that the model was reliant on task note vocabulary, there was a tendency to misunderstand the learned model as simple token matching. As such, engineers often criticised the lack of key-words identified for certain notes, even when they had little or no impact on model decisions. In one example, an engineer stated that ’leaning’ and ’tree’ should be high-lighted as key words, even though the word leaning is too generic to be represented by the vocabulary. This is indicative that engineers were able to understand some aspects of system decision-making (e.g. that it was vocabulary-based), but unable to mentally model the entire system. In future work, we aim to improve this.
In almost all cases (7 of 8 or 87.5%) where negative feedback was provided, the explanation was associated with an incorrect classification. This suggests that when a
Table 2: Example of qualitative feedback on explanation quality from field engineers.
Query
Drop Wire already up at front of prop-erty but landlord wants the customer drop wire moved to the wall of the flat which is above the flat roof and to drill out where the socket is required is out to the flat roof.
Recommended Scenario (Action) Out of Time (Re-allocate engineer)
Keywords
Overlap [flat, 3.33] [roof, 2.76] [wire, 1.43] [drop, 1.18] [abov, 0.7]
Non-Overlap [one,0.29] [insid,0.29] [coil,0.28] [side.,0.27] [build,0.27]
Summary
Similarities Drop wire is already up at front of prop-erty.
Differences I have fitted the socket inside and left a coil of cable.
Feedback
Roof is rightly highlighted. Fair expla-nation since engineer faced additional steps on the customer site (drill out)
user discovers an error in the system decision-making, they are also likely to find a fault in its explanation of that decision. Our model offers a means for users to submit corrections, which was well received by testers. Of the 23 interactions with the system, 15 (65%) made use of the feedback system to highlight missing or non-relevant words and phrases. Several users commented that they felt more comfortable with the system due to this feedback component. This suggests that correctability of an explanation is an important consideration when users are deciding whether to trust the system.
7
Conclusions
We have described the development of a framework to promote explainability of ma-chine learning methods within a telecommunication organisation. We have motivated and explored the application of this framework to the specific use case of explaining technical engineer notes to non-technical planning personnel. An evaluation of this framework indicates that it meets the criteria for user satisfaction, trust assessment and correctability, but improvements are needed to facilitate mental modelling. In future work, we aim to address this and improve framework coverage of different explana-tions. In addition, we plan to extend the framework to incorporate explanations which acknowledge sequential and co-occurring scenarios, as these are necessary concepts for full automation. We also aim to apply this framework to further use cases, enabling us to better understand the explanation needs of users from different work types and experience levels.
References
1. Arras, L., Horn, F., Montavon, G., M¨uller, K.R., Samek, W.: ”what is relevant in a text doc-ument?”: An interpretable machine learning approach. PLOS ONE12(8), 1–23 (08 2017). https://doi.org/10.1371/journal.pone.0181142
2. Cheetham, W.: Case-based reasoning with confidence. In: Blanzieri, E., Portinale, L. (eds.) Advances in Case-Based Reasoning. pp. 15–25. Springer Berlin Heidelberg, Berlin, Heidel-berg (2000)
3. Collins, E., Augenstein, I., Riedel, S.: A supervised approach to extractive summarisation of scientific papers. arXiv preprint arXiv:1706.03946 (2017)
4. European Parliament and Council: Regulation (eu) 2016/679 of the european parliament and of the council of 27 april 2016 on the protection of natural persons with regard to the processing of personal data and on the free movement of such data, and repealing directive 95/46/ec (general data protection regulation)
5. Gunning, D.: Explainable artificial intelligence (xai). Defense Advanced Research Projects Agency (DARPA), nd Web (2017)
6. Hachey, B., Grover, C.: Extractive summarisation of legal texts. Artificial Intelligence and Law14(4), 305–345 (2006)
7. Kingma, D.P., Ba, J.: Adam: A method for stochastic optimization. arXiv preprint arXiv:1412.6980 (2014)
8. Le, Q., Mikolov, T.: Distributed representations of sentences and documents. In: Proceedings of the 31st International Conference on International Conference on Machine Learning -Volume 32. pp. II–1188–II–1196. ICML’14, JMLR.org (2014)
9. Lipton, Z.C.: The mythos of model interpretability. arXiv preprint arXiv:1606.03490 (2016) 10. Luhn, H.P.: The automatic creation of literature abstracts. IBM Journal of research and
de-velopment2(2), 159–165 (1958)
11. Massie, S., Craw, S., Wiratunga, W.: Visualisation of case-base reasoning for explanation. In: Proceedings of the ECCBR 2004 Workshops. pp. 135–144 (2004)
12. Mikolov, T., Chen, K., Corrado, G., Dean, J.: Efficient estimation of word representations in vector space. CoRRabs/1301.3781(2013)
13. Miller, T.: Explanation in artificial intelligence: Insights from the social sciences. Artificial Intelligence (2018)
14. Mohseni, S., Zarei, N., Ragan, E.D.: A survey of evaluation methods and measures for inter-pretable machine learning. arXiv preprint arXiv:1811.11839 (2018)
15. Muhammad, K., Lawlor, A., Smyth, B.: On the pros and cons of explanation-based ranking. In: Aha, D.W., Lieber, J. (eds.) Case-Based Reasoning Research and Development. pp. 227 – 241. Springer International Publishing, Cham (2017)
16. Nordin, I.: Expert and non-expert knowledge in medical practice. Medicine, Health Care and Philosophy3(3), 295–302 (Oct 2000). https://doi.org/10.1023/A:1026446214010
17. Ramos, J.: Using tf-idf to determine word relevance in document queries. In: Proceedings of the first instructional conference on machine learning. pp. 133 – 142 (2003)
18. Ras, G., van Gerven, M., Haselager, P.: Explanation Methods in Deep Learning: Users, Val-ues, Concerns and Challenges, pp. 19–36. Springer International Publishing, Cham (2018). https://doi.org/10.1007/978-3-319-98131-42
19. Sørmo, F., Cassens, J., Aamodt, A.: Explanation in case-based reasoning - perspectives and goals. Artificial Intelligence Review24(2), 109 – 143 (2005)
20. Tsymbal, A.: The problem of concept drift: definitions and related work. Computer Science Department, Trinity College Dublin106(2), 58 (2004)