Date of publication xxxx 00, 0000, date of current version xxxx 00, 0000. Digital Object Identifier 10.1109/ACCESS.2017.DOI
Network Representation Learning
Guided by Partial Community Structure
HANLIN SUN1,2, WEI JIE3, ZHONGMIN WANG1,2, HAI WANG4, and SUGANG MA1,2
1
School of Computer Science and Technology, Xi’an University of Posts and Telecommunications, Xi’an, China (e-mail: [email protected], [email protected], [email protected])
2Shaanxi Key Laboratory of Network Data Analysis and Intelligent Processing, Xi’an University of Posts and Telecommunications, Xi’an, China 3School of Computing and Engineering, University of West London, London, UK (email: [email protected])
4School of Engineering and Applied Science, Aston University, Birmingham, UK (email: [email protected])
Corresponding author: HANLIN SUN (e-mail: [email protected]).
This work was partially supported by the National Natural Science Foundation of China [No. 61702414]; the International Science and Technology Cooperation Project of Shaanxi Province, China [No.2019KW-008]; the Key Industry Innovation Chain Project of Shaanxi Province, China [No.2019ZDLGY07-08].
ABSTRACT Network Representation Learning (NRL) is an effective way to analyze large scale networks (graphs). In general, it maps network nodes, edges, subgraphs, etc. onto independent vectors in a low dimension space, thus facilitating network analysis tasks. As community structure is one of the most prominent mesoscopic structure properties of real networks, it is necessary to preserve community structure of networks during NRL. In this paper, the concept ofk-step partial community structureis defined and twoPartial Community structure Guided Network Embedding(PCGNE) methods, based on two popular NRL algorithms (DeepWalk and node2vec respectively), for node representation learning are proposed. The idea behind this is that it is easier and more cost-effective to find a higher quality 1-step partial community structure than a higher quality whole community structure for networks; the extracted partial community information is then used to guide random walks in DeepWalk or node2vec. As a result, the learned node representations could preserve community structure property of networks more effectively. The two proposed algorithms and six state-of-the-art NRL algorithms were examined throughmulti-label classificationand(inner community) link predictionon eight synthesized networks: one where community structure property could be controlled, and one real world network. The results suggested that the two PCGNE methods could improve the performance of their own based algorithm significantly and were competitive for node representation learning. Especially, comparing against used baseline algorithms, PCGNE methods could capture overlapping community structure much better, and thus could achieve better performance for multi-label classification on networks that have more overlapping nodes and/or larger overlapping memberships.
INDEX TERMS network embedding, network representation learning, partial community structure, community structure, multi-label classification, link prediction.
I. INTRODUCTION
Network (graph) is a direct and natural way for data orga-nization. Information network data is ubiquitous nowadays. Many real world systems, such as the Internet, Webs, on-line social networks, traffic networks and so forth, can be modeled as information networks first and then be analyzed. Traditionally, an information network (simply referred as network in following) is represented as a matrix, e.g. adja-cent matrix, Laplacian matrix, similarity matrix, and so on. This way of representation has drawbacks of being high-dimension and sparse for large-scale networks. Moreover,
network analyzing methods usually need iterative computing and thus are computation intensive, since network nodes are strongly correlated. These strong correlations among nodes also render troubles for the design of parallel algorithms. All in all, analysis of large-scale networks that are common today faces great challenges due to the use of matrices for network representation.
Network Representation Learning (NRL) - also referred as Network Embedding (NE) - provides a reasonable and promising way for large-scale network analyzing. The idea of NRL is to project nodes, edges, subgraphs, or even a
whole graph onto representations of some type in a low-dimension space with consideration of network structure and additional information related nodes and edges. The most widely used representation type is a densely and continu-ous vector, of which the dimension is much smaller than the corresponding representation in matrix. In addition, the resulted representations in low-dimension space by NRL are independent and thus ready for use as inputs of a large number of off-the-shelf machine learning algorithms when they are proper for analyzing tasks. Plenty of NRL algorithms have been proposed [1]–[6]. Among these algorithms, node representation learning that maps each node into a low-dimension vector is studied the most. From the idea how to capture network structure property, most of these methods could be categorized into five types, includingmatrix factor-izing model,probability based model,similarity based model, neural network model and generative adversary network model. In the matrix factorizing model, eigen vectors of a network matrix (like a Laplacian matrix) are taken as the low-dimension representations of nodes [7]–[9]. In the probability model, random walks on a network are collected to capture co-occurance probability of node pairs within a designated context window, then node representations are learned from these walks by the Skip-Gram model, that is widely used for natural language processing [10]–[14]. LINE [15] is a typical similarity model algorithm. It directly computes the first and the second order similarities between node pairs, and uses optimizing method, like asynchronous stochastic gradient descending, to learn node representations that could preserve such similarity relationships. Qiuet al. [16] investigated the relationships between maxtrix factorization and several NRL algorithms, including DeepWalk [10], node2vec [11] and LINE, and showed that these algorithms could be unified into the matrix factorization framework. In the neural network model, a neural network of some type (such as the autoen-coder and the recurrent neural network), that could capture nonlinear relationships among nodes, is trained to learn low-dimension node representations [17], [18]. ANE [19], NetRA [20] and GraphGAN [21] are three examples of Generative Adversary Network (GAN) [22] model. They design a game-theoretical minmax game to combine the generative and discriminative thinking to learn node representations. We will also focus on node representation learning in this paper.
It is straightforward that the performance of a network analysis based on learned representations is highly dependent on whether the learned representations in low-dimension space are able to preserve structure features of the origi-nal network well. Most NRL methods focus only on local or micro topology properties, such as neighbors, two-step neighbors, and so forth. Recently, works in [23]–[28] started to explicitly consider preserving community structure in net-work representation learning in realizing that community is a prominent mesoscopic structure of networks and has an important effect on network analysis. Simply, a community is a group of nodes that have more connections among them, but have relative less connections with the rest of the network;
thus in community semantics, members of a community are more similar. Therefore, in embedded low-dimension space, representations of nodes belonging to a community should be closer.
In this paper, we proposed two NRL algorithms that could preserve network community structure well in learned node representations. The basic idea is to first extract information on community structure using community detection methods, and then use the obtained information to enhance node rep-resentation learning. The idea of our algorithms is different from most current works that unify community model and node representation learning model together (more details of these works will be discussed in section II). In summary, the main contributions of this work are as follows:
(1) We defined the concepts ofk-step partial community and k-step partial community structure, and then proposed twoPartial Community structure Guiding Node Embedding (PCGNE) methods, PCGNE-DW and PCGNE-N2V that base on DeepWalk and node2vec, respectively. The two meth-ods extract the information of a 1-step partial community structure for a network firstly, and then use the information to guide random walks in DeepWalk or node2vec for node representation learning. Specifically, by giving next walk a prior probability to 1-step neighbors sharing at least one partial community, the random walks could be prone to being trapped within communities; therefore the community structure could be implicitly preserved in collected walks and thus in representations learned from these walks.
(2) We quantitatively showed the impact of community structure on node representations using examples of multi-label classification, thus proving the necessity of explicitly preserving network community structure in network repre-sentation learning.
(3) We conducted extensive tests for the two proposed methods and six other state-of-the-art network representation learning algorithms on synthesized and real networks. The results of experiments showed that our two algorithms could preserve the property of network community structure, espe-cially overlapping community structure, well.
(4) We found that the use of these real world networks, including BlogCatalog, Flickr, Protein-Protein Interactions (PPI), and so on for NRL algorithm verification through multi-label classification should be cautioned, since their node labels did not properly encode their network topology, namely node labels are not consistent with their connection relationships. Such networks were widely used in previous NRL works, that learned node representations purely from network topology, for performance verification.
The rest of this paper is arranged as follows: section II introduces some node representation learning methods re-lated to ours or considering community structure preserving. Section III quantitatively shows the impact of community structure on node representations using examples of multi-label classification. Section IV describes details of the pro-posed PCGNE-DW and PCGNE-N2V, whileas section V presents the results of extensive experiments on synthesized
and real networks. Finally, section VI concludes the paper.
II. RELATED WORKS
In this section, we briefly introduce DeepWalk and node2vec which we have based our methods on, and NRL algorithms that explicitly consider to preserve community structure fea-tures.
Perozziet al. proposed DeepWalk [10], the first algorithm that can handle node representation learning of large scale networks. It builds upon the observation that the distribution of node pair appearance in random walks collected from a network within a fixed window is power-law, and such a distribution is considerably similar to the distribution of word co-occurances in the natural language corpus. Therefore, DeepWalk imitates word representation learning to learn node representations: treats a node as a word and a short random walk as a special sentence and then solves node rep-resentations using the Skip-Gram model. In fact, DeepWalk tries to keep neighborhood properties of nodes.
Grover et al. presented node2vec [11] which also learns node representations by maximizing the likelihood of pre-serving node neighborhoods. It designs a biased random walk by introducing two controlling parameters,returning pand in-outqthat control how fast the next walk explores or leaves the neighborhood of a starting node, respectively. By setting both parameters as 1.0, where the next walk from current node is to a randomly selected neighbor, node2vec becomes DeepWalk.
Recently, a few studies have considered to preserve com-munity features during node representation learning after noting the importance of community structure on network analysis. Wang et al. combined two nonnegative matrix factorizing (NMF) models that are for node representation learning and community structure detecting, and proposed M-NMF (Modularized NMF) [23]. It optimizes both models at the same time, therefore being able to maintain network community properties in final node representations. How-ever, M-NMF adopts a modularity matrix to encode network community structure and assumes that a node can be assigned to only one community (i.e. a disjoint community structure), which is generally not true for real networks. Moreover, M-NMF needed to designate the number of communities, which is usually not known in practice and hard to estimate.
Based on the thought that communities regularize commu-nication pathways for information propagation on networks, Zhanget al. proposed COSINE (COmmunity-preserving So-cial Network Embedding from Information diffusion cas-cades) [24]. Using the Gaussian Mixture Model (GMM) to model communities in a mapped low-dimension space, COSINE faces the same problems as M-NMF. The authors claimed that by replacing GMM with thehierarchical mix-ture models with Dirichlet priors, COSINE can overcome both the problems.
Cavallariet al. introduced the ComE (Community Embed-ding) framework [25]. From ComE’s perspective, the three tasks of community detection, community embedding, i.e.
attempting to learn a low-dimension representation for each community, and node embedding are closely related and should form a closed loop procedure. ComE first employs DeepWalk to create initial node representations and then up-dates node representations, community representations and community assignments of nodes iteratively. It takes Mul-tivariate Gaussian Distribution (MGD) as the model for community representations, and supposes that node repre-sentations are generated from such community distributions. MGD representation has the strength of clearly showing dis-tribution features of community members in low-dimension space. Though ComE supports overlapping community struc-ture, i.e. a node can join in multiple communities, it requires the number of communities as input as well.
Tu et al. held a similar view and proposed a unified framework named CNRL (Community-enhanced Network Representation Learning) [26]. CNRL extends the idea of DeepWalk by modeling a community as a topic in natural language. It uses a vector in the same size as node repre-sentations as the representation for a community, and hires Gibbs Sampling of Latent Dirichlet Allocation to find com-munity assignments for nodes. They developed two commu-nity enhanced node representation learning methods, CNRL-DW and CNRL-N2V that base on DeepWalk and node2vec, respectively. The problem faced by CNRL is the same as for ComE.
Jia et al. proposed CommunityGAN [27] to learn node representations and detect overlapping communities simul-taneously. It uses the theory of GAN as well. However, a node representation by CommunityGAN indicates the mem-bership strength of the node to communities; therefore, it requires the dimension of learned node representation must be same with the number of communities. It is better to view CommunityGAN as a community structure detecting method rather than a general node representation learning one.
Different from the way of aforementioned methods -jointly modeling community structure and node representa-tions in a unified framework - CARE (Community Aware Random walk for network Embedding) [28], which is based on DeepWalk as well, sets up a new way for integrating com-munity features into node representations. It firstly detects a community structure for a network using Louvain, a popular community detection method, and then uses the obtained communities to guide DeepWalk random walks. Specifically, it makes use of community information by increasing co-occurances of node pairs belonging to a same community, i.e. with a prior probability, it randomly chooses a node from communities to which the current node belongs as the next walk. However, the benefit of using such an aggressive way of integrating highly depends on whether a proper commu-nity structure could be found. Unfortunately, finding a high quality community structure for large scale networks is not easy.
In short, most preliminary researches that try to take com-munity features into account as learning node representations assume some type model for community structure, and solve
community representations (and community detection) and node representations jointly. However, a prior set model may not capture features of real communities well. Besides, they need the number of communities, that can not be determined easily, as input. Our methods follow the way of CARE in considering community structure, but extract community information in a less cost approach and integrate community structure to random walks implicitly.
III. IMPACT OF COMMUNITY STRUCTURE ON NRL
We quantitatively test the impact of community structure on node representation learning using CARE on networks having ground truth community structure. Specifically, we take three synthesized networks created by LFR [29] as examples. They are denoted as µ = 0.3,on = 30%, and
om = 6, respectively, by their key parameter of LFR. The network µ = 0.3 has no overlapping nodes. The network
on = 30% has 30% of nodes as overlapping nodes with community membership 3, whileas the om = 6 has 20% overlapping nodes with community membership 6. Each network contains 10,000 nodes. More details about these synthesized networks can be found in section V-C1.
We adopt themulti-label classification(MLC) from node representations task to show the impact of explicitly consid-ering community structure in NRL. First, node representa-tions of the three networks are learned using CARE aided by their true community structures (denoted as CARE-RCOM). Then 70% of nodes and their labels are randomly selected as training data, and labels of the rest 30% nodes are predicted using the libsvm [30]. We assigned the community identifiers of each node as its labels. Note that overlapping nodes have multiple labels. Such a label assignment is reasonable since the labels could correctly encode the structure of the network, namely nodes with a same label have more connections among them, which is exactly what we would like to preserve in NRL. M icro-F1andM acro-F1 are used as evaluation metrics. Refer to section V-A for more information about experiment settings and metrics. We compare the two metrics obtained by CARE with those by DeepWalk to show to what extent the improvement could be. Table 1 shows the results. As can be seen from the first two rows, if the true community structure could be known in some way, both metrics, especially of networkon = 30% andom= 6, can be improved significantly.
The way that CARE integrates community information is aggressive, however. It adds in node representations the community semantics that nodes within a same community have more similarity, even if they are not directly connected by an edge. As a result, if the community information used is correct, this way could greatly increase the similarities of node pairs within a community; but if the information is wrong, such a way would cause huge negative impact. For example, if we replace the true community structures with those detected by OSLOM [31] in CARE (denoted as CARE-DCOM), the results do not show obvious improvements any more than those of DeepWalk, except network om = 6
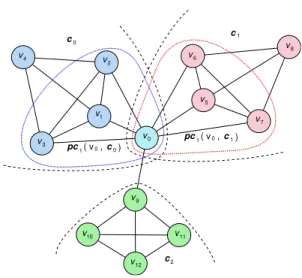
c0 c1 c2 pc( v0,c0) v1 v2 v3 v4 v9 v5 v6 v7 v8 v10 v11 v12 v0 1 pc1( v0,c1)
FIGURE 1. Examples of1-step partial community. This figure shows the partial 2-step neighborhood of nodev0in a network. Different node colors (exceptv0) mean different community assignments. Nodev0belongs to two communities,c0andc1. Therefore,v0has two1-step partial communities,
pc1(v0,c0)andpc1(v0,c1)which are encircled by blue and red dot lines and consist ofv0and its1-step neighbors in the two corresponding communities, i.e. {v0,v1,v2,v3} and {v0,v5,v6,v7}, respectively.
(Table 1). The reason is that the detected community structure contains nodes wrongly assigned to some communities, and such nodes introduce too much wrong community semantics. Here we adopt OSLOM since it has been proved to be an effective algorithm for overlapping community detection and is better than Louvain used in original CARE [32]. We ran OSLOM 10 times and selected the best community structure according to the overlapping modularity score [33]. Thereby, the key problem for CARE is how to find an accurate com-munity structure as much as possible for networks.
Detecting a high quality community structure for net-works, especially for large scale netnet-works, is a challeng-ing task. However, findchalleng-ing community boundaries, namely finding that if a node stays in a same community with its neighbors based on the neighborhood topology structure of the node, is a relatively easier and less cost task. Owning to this premise, we introduce the concept of k-step partial community structure.
Definition 1: Given a networkG = (V,E)whereV is the node set andEis the edge set; supposeCis a community structure of G. For a node v ∈ V, denote the community (communities) that v belongs to as comsj(v) ⊆ C. A k-step partial communityof v that relates to a community
c ∈ comsj(v), denoted aspck(v,c), is a node group that
containsvitself and its less than or equal tok-step neighbors that also stay inc, i.e.
pck(v,c) ={v∪u|u∈ngk(v)∧u∈c} (1)
wherengk(v)is the less than or equal tok-step neighbors of v.
Fig. 1 demonstrates examples of the simplest1-step partial community.
TABLE 1. Impacts of Community Structure on MLC Micro-F1 Macro-F1 Alg. µ= 0.3 on= 30% om= 6 µ= 0.3 on= 30% om= 6 DeepWalk 0.9988 0.8014 0.6628 0.9992 0.8714 0.8072 CARE-RCOM 1.0000 0.9995 0.9770 1.0000 0.9995 0.9689 CARE-DCOM 1.0000 0.8035 0.6898 1.0000 0.8724 0.8100 PCGNE-RCOM 1.0000 0.8888 0.7379 1.0000 0.9311 0.8460
Definition 2: Ak-step partial community structure of a networkG, denoted aspcsk(G), is the collection of allk
-step partial communities of its member nodes, i.e.
pcsk(G) =∪v∈V ∪c∈comsj(v){pck(v,c)}. (2)
It should be noted that although a community structure of a given network is involved in the partial community definition, it is not necessary to find a complete community structure first and then to extract the related partial communities. The involved community structure here is used just to clarify which nodes in neighborhood are included in a partial com-munity of the node. We could design an algorithm to find a partial community structure for a network directly.
A partial community structure of a network could be used as an approach for its local topology property description. In particular, a 1-step partial community structure provides community boundaries from viewpoints of nodes. Based on the concept of1-step partial community, we proposePartial Community Guided Network Embedding(PCGNE) for node representation learning. It captures community structure fea-tures of a network by random walks defined as follows:
next_node=
usual_walk ifr < β
partial_community_guided_walk else , (3) where ris a random number uniformly drawn from range [0,1]before each walk andβ is a designated threshold. The
usual_walk stands for taking next walk as DeepWalk or node2vec doing, whileaspartial_community_guided_walk
means randomly selecting a neighbor that shares at least one 1-step partial community with the current node as the next walk. In the following text, partial community has the same meaning as1-step partial community, except for clear speci-fication. By giving neighbors sharing communities a priority, that is adjusted byβ, the generated walks are likely trapped within communities; therefore, a community structure of the network could be implicitly preserved. Table 1 also lists the results of PCGNE that takes DeepWalk as usual walk and uses the true community structures for partial community guided walks (denoted as PCGNE-RCOM). It can be seen that both metrics are improved greatly comparing against those of DeepWalk, though not as much as the improvements gained by CARE-RCOM.
In practice, we do not need to find an exact partial com-munity structure for a network in PCGNE, but just group neighbors of each node into two classes: those sharing at least one partial community with the given node and those sharing none. Such a grouping reduces the cost of PCGNE further.
TABLE 2. Notations of PCGNE
notation explanation G network V nodes ofG E edges ofG C a community structure ofG N node number ofG v a node deg(v) degree ofv ngk(v) k-step neighbors ofv
comsj(v) communitiesvjoins in
c a community
cn(v,c) connection number ofvtoc
cs(v,c) connection strength ofvtoc
cc(v,c) clustering coefficient ofv’s neighbors inc
cnmax(v) max connection number ofvto joining communities
csmax(v) max connection strength ofvto joining communities
Ci an initialized community structure ofG
pck(v,c) ak-step partial community ofvrelated toc
pcsk(G) ak-step partial community structure ofG
comsn(v) distinct joining communities ofv’s neighbors
ngsc(v) neighbors sharing at least one1-step partial community withv
α community joining threshold
β walking within community threshold
numE number of evolving iteration
numP number of post processing iteration
numW number of walks per node
numN number of negative sampling
dim embedding dimension
len walk length
size context window size
p return parameter for node2vec walking
q in-out parameter for node2vec walking
embs node embedding ofG
In the following text, finding a partial community structure means grouping of neighbors for each node of a network.
IV. PARTIAL COMMUNITY STRUCTURE GUIDED NRL
In this section, we detail the two proposed PCGNE algo-rithms. Roughly, they consist of two stages: 1) finding a partial community structure for a network; and 2) guiding random walks using the found partial community structure and then learning node representations from the collected walks. Notations used in PCGNE are listed in Table 2.
A. CONNECTION STRENGTH OF A NODE TO A COMMUNITY
The key of PCGNE is also to find an accurate partial commu-nity structure as much as possible. The first question arose is how we could determine whether a node belongs to a community or not? We use the concept ofconnection strength that quantitates how strong a nodevbelongs to a community
cas in our previous work [34]. It is defined as: cs(v,c) = cn(v,c) deg(v) [1−cc(v,c)] (4) where cn(v,c) is the connection number that v has with communityc,deg(v)indicates the degree ofv, andcc(v,c) stands for theclustering coefficientofv’s neighbors assigned toc. Note that a connection strength could be computed only for a node having at least three connections to a community, since a meaningful clustering coefficient exists under such a restriction.
B. PARTIAL COMMUNITY STRUCTURE DETECTION
The procedure of detecting a partial community structure for a network is described in Algorithm 1. Its outline is similar to our previous work of overlapping community detection [34], but is much simpler since here we only need to differentiate whether a neighbor of a given node is sharing at least one partial community with the node. Thereby, we do not need to consider mergence of communities during evolving. First, it calls the algorithm ”InitCom” (Algorithm 2) to find an initial community for each node of the processed network. Then for each node, the algorithm iteratively evolves its partial communities in order to join in communities of its neighbors. The joining criteria are that: 1) if the ratio between the connection strength of the node to a candidate neighbor community and the maximum connection strength of the node exceeds a given threshold α, the node joins in this neighbor community; 2) if the connection number of the node to a candidate neighbor community is 2 and the maximum connection number of the node is not greater than 3, the node joins in this neighbor community. At the end of each itera-tion, the algorithm ”PostProcCom” (Algorithm 3) is called to rectify wrong community joining due to the sequential order of node processing. Finally, the grouped neighbors of each node could be easily derived from the found node community assignments, according to whether they share at least one partial community with the node.
Algorithm 2 details the procedure of partial community structure initializing. It finds an initial community for each node as follows: 1) collecting joining communities of the node’s neighbors and trying to find such a neighbor com-munity that if the node joins in, it is still a k-clique; 2) if there is no such community, trying to find if the node has two uninitialized neighbors with which the node could form a 3-clique; 3) if the first two do not meet, then the node is initialized as a singleton community, i.e. a community by itself. A k-clique is a completely connected graph of k
nodes; thereby, all of its members are surely belonging to one community.
As a result of the sequential node processing order in each evolving iteration, there are some nodes whose community assignments may be incorrect. To alleviate the effects of such nodes, we execute a post processing procedure, that is presented in Algorithm 3, after each iteration to rectify these wrong assignments. Its criteria are almost the opposites
Algorithm 1: DetectPartCom
Input: networkG, community joining thresholdα, evolving iterationnumE, post-processing iterationnumP
Output: 1-step partial community structurepcs1(G)
1: pcs1(G)= InitCom(G); /* call Algorithm 2 */
2: foritr= 1tonumEdo 3: permute nodes ofG;
4: foreachvin permuted nodesdo
5: collectcomsn(v)frompcs1(G);
6: foreachcincomsn(v)do
7: computecn(v,c);
8: ifcn(v,c)≥3then
9: computecs(v,c);
10: end if
11: end for
12: findcnmax(v)andcsmax(v)
13: foreachcincomsn(v)do
14: if(cn(v,c)≥3andcs(v,c)/csmax(v)≥α)or
(cn(v,c) == 2andcnmax(v)≤3)then 15: updatepcs1(G)by addingvtoc;
16: else
17: update pcs1(G) by removing v from c if existing; 18: end if 19: end for 20: end for 21: pcs1(G) = PostProcCom(G, pcs1(G),α,numP); /* call Algorithm 3 */
22: ifpcs1(G)does not changethen
23: break;
24: end if
25: end for
26: return pcs1(G)
of community joining in Algorithm 1. Additionally, a node does not join in a community with which it has only one connection.
Due to the random node processing order in community initializing and evolving, this partial community structure detecting algorithm is unstable, namely rerunnings could result in different communities even on a same network. In PCGNE, we rerun ”DetectPartCom” several times and combine all results to get a final partial community structure. As a result, if a neighbor of a node is found sharing a partial community with the node in any run, they are regarded as sharing a community.
C. PCGNE
As we get a partial community structure of a network, we could use it to guide random walks as in (3) and then learn node representations on collected walks by Skip-Gram. Algorithm 4 outlines PCGNE. We use both the random walk manners in DeepWalk and node2vec as the usual walk, and denote the two as PCGNE-DW and PCGNE-N2V, re-spectively. Specifically, the codes from line 2 to 23 collect
Algorithm 2: InitCom
Input: networkG
Output: an initialized community structureCi 1: permute nodes ofG
2: foreachvin permuted nodesdo
3: ifvhas been initializedthen
4: continue;
5: end if
6: collectcomsn(v)from initialized neighbors; 7: foreachcincomsn(v)do
8: ifcis ak-clique aftervjoins inthen
9: updateCiby addingvtoc; 10: tagvas initialized;
11: break;
12: end if
13: end for
14: ifv has NOT been initializedandvforms a 3-clique with two uninitialized neighborsthen
15: create a new community c containing the three nodes;
16: addctoCi;
17: tag the three nodes as initialized;
18: end if
19: ifvhas NOT been initializedthen
20: create a new communityccontaining onlyv;
21: addctoCi;
22: tagvas initialized;
23: end if
24: end for
25: return Ci
partial community aware random walks. At each walk step, a next node is firstly selected according to the DeepWalk or node2vec manner (line 9); and then, it may be replaced by a random neighbor that shares at least one partial community with the current node with a prior probability1−β(line 11-18). The code in line 25 achieves node embedding learning.
D. COMPLEXITY ANALYSIS
After obtaining a partial community structure, the random walk collecting and then representation learning of PCGNE are similar as in DeepWalk or node2vec. The complexity of random walk has only very slightly increase, due to the par-tial community aware next walk reselection. Here, we focus on the complexity of partial community structure detecting.
Denote the node number of the processed network asN. The first step of detection is to find an initial community for each node. According to the finding criteria in Algorithm 2, the complexity of initializing step is very close toO(N) since the numbers of neighbors and joining communities of each node are generally dramatically less than N. The second step is partial community structure evolving and post-processing. The evolving operations include, for each node, collecting joining partial communities of its1-step neighbors, computing connection strength to each of such a partial
Algorithm 3: PostProcCom
Input: networkG, partial community structurepcs1(G), community joining thresholdα, post processing iteration
numP
Output: rectified partial community structure
1: foritr= 1tonumP do 2: permute nodes inG;
3: foreachvin permuted nodesdo 4: collectcomsj(v)frompcs1(G);
5: foreachcincomsj(v)do
6: computecn(v,c);
7: ifcn(v,c)≥3then
8: computecs(v,c);
9: end if
10: end for
11: findcnmax(v)andcsmax(v);
12: foreachcincomsj(v)do
13: if(cn(v,c) ≥ 3 andcs(v,c)/ csmax(v)< α)
or (cn(v,c) == 2 and cnmax(v) > 3) or
cn(v,c)≤1then
14: updatepcs1(G)by removingvfromc;
15: end if 16: end for 17: end for
18: ifpcs1(G)does not changethen
19: break;
20: end if
21: end for
22: return pcs1(G)
community, and deciding joining in each one or not. Given that the number of neighbors and joining communities of each node are usually greatly less than N, the complexity of one iteration evolution is also close to O(N). The op-erations of post-processing are much similar as evolving, and thus its complexity. As a result, considering that the evolving and post-processing iterations are usually small, the total complexity of partial community structure detecting is approximate toO(N).
V. EVALUATION
In this section, we examine the performance of the two PCGNE methods and compare them against six state-of-the-art network representation learning algorithms, including DeepWalk [10], node2vec [11], LINE [15], GraRep [7], ComE [25] and CNRL [26]. Both ComE and CNRL ex-plicitly consider to maintain community structure properties of networks. For CNRL, we do not adopt the ”Statistic-based assignment” strategy, that achieves node community assignments using the Gibbs sampling method of Latent Dirichlet Allocation, due to its heavy computation. Instead, we use the ”Embedding-based assignment” strategy, which hires embeddings of nodes and communities to estimate node community assignments, owning to its computing efficiency. We run all involved algorithms on LFR synthesized networks
Algorithm 4: PCGNE
Input: network G, partial community structure pcs1(G), threshold of walking within communitiesβ, embedding dimensiondim, walk lengthlen, walks per nodenumW,
context window size size, negative sampling number
numN [, returnp, in-outq(for node2vec walk)]
Output: node embeddingembs
1: /* collect walks*/
2: walks= [ ];
3: foritr= 1tonumW do 4: permute nodes ofG;
5: foreachvin permuted nodesdo
6: node_walk= [v];
7: forstep= 1tolendo
8: setcur_nodeas the last node ofnode_walk;
9: setnext_nodeas DeepWalk (or node2vec) do-ing;
10: collectngsc(cur_node)frompcs1(G);
11: ifngsc(cur_node)is not nonethen
12: randomly extract a numberrfrom range[0,1];
13: /* partial community guided walk */
14: ifr≥βthen
15: randomly select a neighbor from
ngsc(cur_node);
16: updatenext_nodeas the selected neighbor;
17: end if
18: end if
19: appendnext_nodetonode_walk;
20: end for
21: appendnode_walktowalks;
22: end for
23: end for
24: /* learn embedding */
25: embs= SkipGram(walks,dim,size,numN); 26: return embs
and a real network in order to get their low dimension node representations, and then conduct multi-label classification andlink predictionbased on obtained representations.
A. METRICS FOR MULTI-LABEL CLASSIFICATION
In multi-label classification tests, we split a processed net-work into two parts, training part and test part. We first train a classifier according to the training nodes and their labels, and then use the classifier to predict labels for the test nodes. The classifier hired here is libsvm [30], in which the linear kernel function is used and other parameters are set as defaults.
The metrics for evaluating multi-label classification are
M icro-F1 and M acro-F1. M icro-F1 is computed from
each label prediction instance of each node, whileas
M acro-F1is the averaged F1 scores of each label
predic-tion. Specifically, they are defined as:
M icro-F1 = 2·P recision·Recall
P recision+Recall (5) where P recision= P l∈LT rueP ositive(l) P
l∈L[T rueP ositive(l) +F alseP ositive(l)] (6) and Recall= P l∈LT rueP ositive(l) P
l∈L[T rueP ositive(l) +F alseN egative(l)] ; (7) M acro-F1 = P l∈LM icro-F1(l) |L| . (8)
In above equations, T rueP ositive(l), F alseP ositive(l)
andF alseN egative(l)are the number of true positives, false
positives and false negatives of the instances predicted as labell, respectively.Lis the overall label set.M icro-F1(l) is theM icro-F1measurement for the labell.
B. METRICS OF LINK PREDICTION
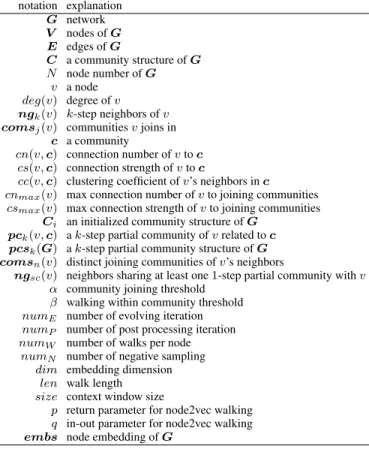
Link prediction is to estimate if a node pair should form an edge between them. We will use the words link and edge interchangeably in following. Intuitively, if two nodes have stronger relationship, e.g. having more common neighbors, they are more likely to form a new edge. In embedding space, the smaller the distance between two node vectors, the more likely the two corresponding nodes will form an edge. Here, by taking community semantics into consideration, we categorize the relationships of node pairs into four classes: 1) node pair having an edge between them and sharing at least one community; 2) node pair having an edge but belonging to different communities; 3) node pair having no edge but sharing at least one community; and 4) node pair without an edge and locating in different communities. We denote the four relationships as e-incom, e-crcom, ne-incom, and ne-crcom, respectively. Fig. 2 shows the four type relation-ships on a toy network. Generally,e-incomnode pairs have the strongest relationship due to both edge connection and community semantics, whileas the ne-crcom ones have the weakest. The relationship strength ofe-crcomandne-incom node pairs depend on the semantics of edge connection and community.
From the view of community semantics, the likelihood of forming an edge within a community is higher than that of crossing communities. Therefore we will randomly remove a small portion ofe-incomedges, and evaluate the prediction of these edges in link prediction tests. The community structure of networks should not be changed after such removal to guarantee that these test links are stille-incomedges. Thus, we remove only 5% edges within communities from tested networks, and further ensure that no more than one edge leading from a node will be removed. In experiments, the actual number of removed edges depend on the community structure of the processed network, and may be less than 5% of total edges.
The most used metric for link prediction is AU C (Area Under the receiver operating characteristic Curve). We follow
FIGURE 2. Examples of node pair relationships. The toy network has 7 nodes that form 2 communities, i.e. {v1, v2, v3, v4} and {v5, v6, v7}, denoted by different node colors, and 9 edges that are in bold line . One example of both ne-incomandne-crcomedge that do NOT exist in the network are shown in dotted line.
theAU Cdefinition for discrete data in [35]; thereby, a mech-anism for ranking continuous node pair distances should be designed. Moreover, in order to fairly compare the ranks of distances obtained by different NRL algorithms - which have their own scales - distances should be normalized at first. The designed distance ranking mechanism is as follows:
(1) sort distances of bothe-incomande-crcomnode pairs, and take the first 95% aseffective distances;
(2) use the largest effective distance as the normalizer to normalize all involved distances, including distances of e-incom and e-crcom node pairs and distances of sampled negative node pairs (ne-incomandne-crcomnode pairs);
(3) divide the normalized effective distance range, from 0 to 1, to several equal parts (ten in this paper) and add an extra part at right end for those normalized distance that are greater than 1;
(4) assign each normalized involved distance a rank ac-cording to the range part it falls into.
In such a mechanism, a part represents the possibility that two nodes will form an edge if the distance between them falls into this part. The left most part has the most likelihood (highest rank), whileas the right most part has the least likelihood (lowest rank). To eliminate effects of extreme distances, we select the normalizer as the largest one of the first 95% effective distances. Extreme distances take only a small portion but distribute widely; therefore, they may affect the distribution of effective distances that we reference to evaluate edge forming likelihood. Then AU C can be computed as:
AU C= num1+ 0.5×num2
num (9)
TABLE 3. LFR parameter settings of synthesized networks
Parameter Description Experiment Setting
N number of nodes 10,000
k averaged node degree 15
maxk maximum node degree 50
minc minimum community size 20
maxc maximum community size 1000
t1 minus exponent for −2
degree distribution
t2 minus exponent for −1
community size distribution
µ mixing ratio 0.3, 0.4, or 0.5
withon=0 andom=0
on number of 10%, 20%, or 30% ofN
overlapping nodes withµ=0.3 andom=3
om number of community 3, 6, or 9 with
memberships of overlapping µ=0.3 andon=20% ofN
nodes
where num stands for the number of total observations,
num1 is the times that a predicted edge has a higher rank than a random chosen none existing edge, andnum2is the times they have a same rank. The value ofAU Cranges from 0 to 1. Usually, it falls into [0.5,1.0]. The more it exceeds 0.5, the better the prediction. We follow the fast computing method ofAU Cin [35].
C. EVALUATION ON SYNTHESIZED NETWORKS
We generate synthesized networks using LFR model [29], which is widely used for community detection evaluation. The community structure properties of generated networks could be controlled by model parameters, therefore it allows us to systematically investigate effect of community structure on learning of node representations.
1) LFR settings
We vary three LFR model parameters that are mixing ratio
µ, overlapping densityon, and overlapping diversityom, to control community structure properties. The mixing ratioµ
controls the average ratio of external degree of a community to its total degree. The smaller the µ, the better the quality of community structure. The overlapping density onis the number of overlapping nodes, whileas overlapping diversity
omspecifies the number of community memberships of over-lapping nodes. The parameter settings in our experiments are shown in Table 3. We varyµ,onandomto generate networks with simple, complex, or none community structure. Note that the parameters of networkon = 20% andom = 3are same, so we simply use a same network for both settings in later experiments.
However, as we check the community structures of these synthesized networks usingconnection number, we find that for network with large onor om, there are a small portion of nodes breaking the property of a strong community, that have more connections within a community but relatively less connection with outside nodes. Therefore, we rectify community structures of these networks as follows:
(1) a node leaves a joining community with which it has
zero or one connection. We note that some overlapping nodes have just one connection to all their joining communities. In such a situation, it is reasonable to assign the node to each community or to none. We take the latter because one connection is a trivial structure.
(2) a node joins in a not joining community with which the number of connections of the node is equal to or larger than the minimum connection number of the node with its already joining communities. Such a situation occurs mainly as the connection number of new joining is 2.
Both of the leaving and joining actions are executed iter-atively until no node changes its community assignments, or up to a given number of times. Leaving actions are carried out first. The original community memberships of overlapping nodes are specified by om and are same for all nodes, whereas they could be different after rectifying. The distri-butions of amended community memberships except one are shown in Fig. 3. As can be seen, community memberships could be spread in a wide range, thus making community structures more complicated. The blue bars stand for theom
specified community membership. It should also be kept in mind that after rectification, some nodes may form singleton communities.
2) Results of Multi-Label Classification
We label each node of synthesized networks according to its community identifier(s); therefore, nodes with a same label will have more connections among them, namely node labels are consistent with network topology. Similar to previous works, we randomly sample 50% to 90% nodes and their labels as training data to train a libsvm [30] classifier, and then use the classifier to predict labels of the rest nodes. Additionally, for networks having overlapping nodes, we ensure that the same ratio of overlapping nodes are sampled as training nodes. We further make sure that none singleton community node is sampled. They are left as test nodes, but their labels cannot be predicted correctly.
Following parameter settings of previous works, the di-mension of node representation is set as 128 for all algo-rithms; for those using random walks to capture network structure features, the length of walk is 40 and the walk number starting from each node is 80; and both the context window size and the negative sample number of Skip-Gram are 5. For ComE and the two CNRL algorithms, the required community number is set as the actual number of commu-nities, excluding singleton communities. Both of the ComE trade-off parametersαandβ are set as 0.1 according to the analysis in that paper. The max transition probability order of GraRep is 4. As finding a partial community structure in PCGNE, the rerunning number of ”DetectPartCom” is 5. For the parameter returningpand in-outqof node2vec and algorithms based on it, as well as the community joining thresholdαand walking within communities thresholdβof PCGNE methods, we run the algorithm with each candidate parameter combination three times and select the one that results the maximumM icro-F1.
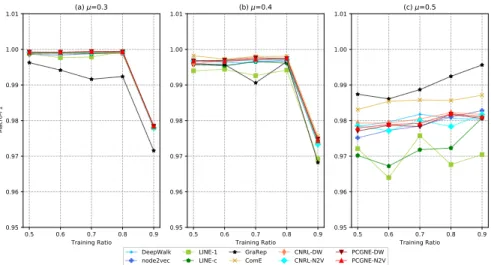
We execute each algorithm on each network 10 times and compute averageM icro-F1 andM acro-F1 scores. Fig. 4 and 5 present the average scores for networks with mixing parameter µ varying. LINE-1 denotes using only the first order similarity in LINE, whileas LINE-c means using both the first and second order similarities. Keep in mind that there are no overlapping nodes in µnetworks. We first examine
M icro-F1and thenM acro-F1, as can be seen:
(1) when µ is 0.3, where the community structure is clear, all algorithms are able to make good label predictions.
M icro-F1scores are very close to 1.0.
(2) asµincreases to 0.4, where the community structure becomes blur, all scores deteriorate a little bit. In general, GraRep is mildly better than ComE, which is slightly better than others. DeepWalk, node2vec and the four based on them are a little superior to the two LINE algorithms.
(3) as µgrows to 0.5, where no community structure is supposed to exist, GraRep and ComE are the top two again, and are appreciably better than others. The six based on random walks perform slightly better than the two LINE under this situation as well.
(4) from M acro-F1scores, we can observe similar phe-nomenons except GraRep becomes worse as µ = 0.3 and 0.4.
Fig. 6 and 7 show the averageM icro-F1andM acro-F1 scores of networks having overlapping node number on
changing, respectively. It could be found that:
(1) ason= 10%, where the community structure becomes more complicated but still is clear, GraRep performs best again and our two PCGNE algorithms become the second best. Both of them bring obvious improvements to their basement, DeepWalk or node2vec. ComE, that models a community as a multivariate Gaussian distribution, is the third best. However, the two CNRL methods, that are based on DeepWalk and node2vec as well and model a community as a topic in natural language processing, become the worst. They are even worse than their own based algorithm.
(2) asonbecomes20%, the ranking order of these algo-rithms almost remains the same, except node2vec exceeds DeepWalk and CNRL-DW precedes LINE-c.
(3) as on grows further to 30%, where there are more overlapping nodes, PCGNE-DW and PCGNE-N2V become the best two, but GraRep degrades greatly to the second worst. The ranking order of the rests remains similar.
(4) clearly LINE-1 that takes into account only the first order similarity performs better than LINE-c that considers both the first and second order similarities.
(5) fromM acro-F1, it can be seen that our PCGNE-DW and PCGNE-N2V are the two best. Additionally, LINE-1 surpasses ComE in general, that is inverse to the result by
M icro-F1. Other details are omitted for simplicity.
Fig. 8 and 9 display the average M icro-F1 and
M acro-F1 scores for networks with overlapping
member-ship om varying, respectively. Remember that the network
om = 3is the same one ason= 20%. We replot the figure here for easy comparison asomchanging. We can see that:
0 10 20 30 40 0 250 500 750 1000 1250 1500 1750 Frequencies
(a) on=10%, om=3
0 10 20 30 40 0 250 500 750 1000 1250 1500 1750 (b) on=20%, om=3 0 10 20 30 40 0 250 500 750 1000 1250 1500 1750 (c) on=30%, om=3 0 10 20 30 40 0 200 400 600 800 1000 1200 1400 Frequencies (d) om=3, on=20% 0 10 20 30 40
overlapping community membership 0 200 400 600 800 1000 1200
1400 (e) om=6, on=20%
0 10 20 30 40 0 200 400 600 800 1000 1200 1400 (f) om=9, on=20%
FIGURE 3. Distributions of amended overlapping community memberships of synthesized networks.
0.5 0.6 0.7 0.8 0.9 Training Ratio 0.95 0.96 0.97 0.98 0.99 1.00 1.01 Micro-F1 (a) μ=0.3 0.5 0.6 0.7 0.8 0.9 Training Ratio 0.95 0.96 0.97 0.98 0.99 1.00 1.01 (b) μ=0.4 DeepWalk
node2vec LINELINE-c-1 GraRepComE CNRL-DWCNRL-N2V PCGNE-DWPCGNE-N2V
0.5 0.6 0.7 0.8 0.9 Training Ratio 0.95 0.96 0.97 0.98 0.99 1.00 1.01 (c) μ=0.5
FIGURE 4. M icro−F1scores of networks withµchanging, none overlapping structure.
(1) as om is 6, where the overlapping memberships of overlapping nodes become high, all scores deteriorate. Our PCGNE-DW and PCGNE-N2V are the best two, and node2vec becomes the second best in general. Once again, the two CNRL are the two worst in all examined algorithms. (2) asomincreases to 9, scores further deteriorate whileas the ranking order trend remains similar.
(3) forM acro-F1scores, PCGNE-DW and PCGNE-N2V are the best two once more. In addition, as om increases, DeepWalk and node2vec perform better, whileas GraRep degrades.
We also compare the results of DW and PCGNE-N2V with those of CARE that uses OSLOM detected com-munity structures as walk guidance (CARE-DCOM) for
net-workon = 30%andom = 6. Table 4 shows the average
M icro-F1andM acro-F1scores. As can be seen, our two
partial community structure aided algorithms perform better. As having been explained, the reason lies in that CARE inte-grates community information aggressively, and thus wrong community assignments could induce heavy negative effects on NRL results.
From the aforementioned experiments, we can draw the conclusions that:
(1) both PCGNE-DW and PCGNE-N2V can greatly im-prove their based algorithm, DeepWalk and node2vec, re-spectively.
(2) when the community structure of a network is simple and clear, even there is no community structure, GraRep
0.5 0.6 0.7 0.8 0.9 Training Ratio 0.95 0.96 0.97 0.98 0.99 1.00 1.01 Macro-F1 (a) μ=0.3 0.5 0.6 0.7 0.8 0.9 Training Ratio 0.95 0.96 0.97 0.98 0.99 1.00 1.01 (b) μ=0.4 DeepWalk node2vec LINE-1
LINE-c GraRepComE CNRL-DWCNRL-N2V PCGNE-DWPCGNE-N2V
0.5 0.6 0.7 0.8 0.9 Training Ratio 0.95 0.96 0.97 0.98 0.99 1.00 1.01 (c) μ=0.5
FIGURE 5. M acro−F1scores of networks withµchanging, none overlapping structure.
0.5 0.6 0.7 0.8 0.9 Training Ratio 0.88 0.90 0.92 0.94 0.96 Micro -F1 (a) on=10% 0.5 0.6 0.7 0.8 0.9 Training Ratio 0.80 0.82 0.84 0.86 0.88 0.90 (b) on=20% DeepWalk
node2vec LINE-1LINE-c GraRepComE CNRL-DWCNRL-N2V PCGNE-DWPCGNE-N2V
0.5 0.6 0.7 0.8 0.9 Training Ratio 0.76 0.78 0.80 0.82 0.84 (c) on=30%
FIGURE 6. M icro−F1scores of networks withonchanging,µ= 0.3,om= 3.
0.5 0.6 0.7 0.8 0.9 Training Ratio 0.90 0.92 0.94 0.96 0.98 1.00 Macro -F1 (a) on=10% 0.5 0.6 0.7 0.8 0.9 Training Ratio 0.86 0.88 0.90 0.92 0.94 (b) on=20% DeepWalk
node2vec LINE-1LINE-c GraRepComE CNRL-DWCNRL-N2V PCGNE-DWPCGNE-N2V
0.5 0.6 0.7 0.8 0.9 Training Ratio 0.82 0.84 0.86 0.88 0.90 0.92 (c) on=30%
0.5 0.6 0.7 0.8 0.9 Training Ratio 0.80 0.82 0.84 0.86 0.88 0.90 Micro-F1 (a) om=3 0.5 0.6 0.7 0.8 0.9 Training Ratio 0.50 0.55 0.60 0.65 0.70 0.75 (b) om=6 DeepWalk
node2vec LINE-1LINE-c GraRepComE CNRL-DWCNRL-N2V PCGNE-DWPCGNE-N2V
0.5 0.6 0.7 0.8 0.9 Training Ratio 0.2 0.3 0.4 0.5 0.6 0.7 (c) om=9
FIGURE 8. M icro−F1scores of networks withomchanging,µ= 0.3,on= 20%.
0.5 0.6 0.7 0.8 0.9 Training Ratio 0.86 0.88 0.90 0.92 0.94 Macro-F1 (a) om=3 0.5 0.6 0.7 0.8 0.9 Training Ratio 0.650 0.675 0.700 0.725 0.750 0.775 0.800 0.825 0.850 (b) om=6 DeepWalk
node2vec LINE-1LINE-c GraRepComE CNRL-DWCNRL-N2V PCGNE-DWPCGNE-N2V
0.5 0.6 0.7 0.8 0.9 Training Ratio 0.60 0.65 0.70 0.75 0.80 0.85 (c) om=9
FIGURE 9. M acro−F1scores of networks withomchanging,µ= 0.3,on= 20%.
TABLE 4. F1Scores of Detected Community Information Aided Algorithms
M icro-F1 M acro-F1
Alg. on= 30% om= 6 on= 30% om= 6
CARE-DCOM 0.8035 0.6898 0.8724 0.8100
PCGNE-DW 0.8244 0.7043 0.9084 0.8338
PCGNE-N2V 0.8241 0.7070 0.9098 0.8331
and ComE could produce better embedding results for multi-label classification. However, the computing cost of GraRep is heavy due to its matrix multiplication, therefore it is not a good choice for large scale network embedding. ComE needs the number of communities as input, but it is not easy to estimate in practice. Our two PCGNE algorithms perform quite well under such situations.
(3) as community structure becomes complicated, namely more overlapping nodes and higher overlapping member-ships, our two partial community structure aided algorithms
have more chance to result better node representations that maintain community structure properties.
3) Results of Link Prediction
The manner of parameter settings of involved algorithms for link prediction are same as in multi-label classification task. We run each algorithm on each edge removed network 10 times and compute averageAU Cscores for inner community link prediction from learned node representations.
Fig. 10, 11, and 12 display these averageAU Cscores. At a first glance, it can be noticed that GraRep has the best scores except as µ = 0.3, of which the score is still comparable. We believe this is mainly because GraRep takes 4 order node pair relationships into consideration, thus making similarities of node pairs more accurate. The cost, however, is time consuming matrix computation. For similar reasons, LINE-c that LINE-considers both first and seLINE-cond order similarities is superior to LINE-1 that only takes the first order similarity.
0.40 0.45 0.50 0.55 0.60 0.65 0.70 0.75 0.80 0.85 AUC (a) μ=0.3 0.40 0.45 0.50 0.55 0.60 0.65 0.70 0.75 0.80 0.85 (b) μ=0.4 GraRep
DeepWalk CNRL-DWPCGNE-DW node2vecCNRL-N2V PCGNE-N2VLINE-1 LINE-cComE 0.40 0.45 0.50 0.55 0.60 0.65 0.70 0.75 0.80 0.85 (c) μ=0.5
FIGURE 10. AU Cscores of networks withµchanging, none overlapping structure.
0.4 0.5 0.6 0.7 0.8 0.9 AUC (a) on=10% 0.4 0.5 0.6 0.7 0.8 0.9 (b) on=20% GraRep
DeepWalk CNRL-DWPCGNE-DW node2vecCNRL-N2V PCGNE-N2VLINE-1 LINE-cComE 0.4 0.5 0.6 0.7 0.8 0.9 (c) on=30%
FIGURE 11. AU Cscores of networks withonchanging,µ= 0.3andom= 3.
0.4 0.5 0.6 0.7 0.8 0.9 AUC (a) om=3 0.4 0.5 0.6 0.7 0.8 0.9 (b) om=6 GraRep
DeepWalk CNRL-DWPCGNE-DW node2vecCNRL-N2V PCGNE-N2VLINE-1 LINE-cComE 0.4 0.5 0.6 0.7 0.8 0.9 (c) om=9
It is also easy to find that CNRL-DW and PCGNE-DW improve DeepWalk, and that CNRL-N2V and PCGNE-N2V improve node2vec significantly - even as µ = 0.5 where none community structure is supposed to exist. As we check the community structure of network µ = 0.5, we find that node pairs ofe-incomedges have more common neighbors than those of e-crcom edges, i.e. to some extent, nodes of a community are still more densely connected comparing with nodes locating in different communities. Therefore the four DeepWalk and node2vec based algorithms that take community structure into consideration could achieve better performance.
Though both two CNRL algorithms are not good at multi-label classification, they perform slightly better than the corresponding PCGNE method in a lot of cases at link prediction, including network on = 10%,20%,30% and
om = 3,6 for DeepWalk based and networkµ = 0.3,0.5,
on = 10%,20%,30%, andom = 3,6for node2vec based. This could be explained by the property of PCGNE algo-rithms, since they are able to capture overlapping structure well, thus making communities sharing overlapping nodes become closer in mapped space. As a result, distances of some ne-crcom node pairs decrease, and thus the negative samples used in AU C computation will become worse. However, our PCGNE algorithms, especially PCGNE-DW, are comparable to CNRL ones on most networks for inner community link prediction. Particularly, PCGNE-DW is the best (except GraRep) on µ networks where there are no overlapping communities.
The impacts of overlapping nodes on PCGNE methods for link prediction could be eliminated if a mirror node for each overlapping node is added into each community that the node belongs to, and connections between the (mirror) node and its neighbors in the same community are kept. As a result, with no overlapping node existing any more, our PCGNE-DW will perform quite well. Under such a setting, multiple embedded representations for an overlapping node, as many as the number of its community memberships, will be learned, and a proper one could be selected for link prediction. Such an improvement could benefit multi-label classification task, too. We leave this as a future task.
It can also be noted that node2vec becomes the worst one here. Theoretically, if both pand qare set as 1.0, random walks of node2vec and DeepWalk are equivalent in statistics; therefore, node2vec should not be inferior to DeepWalk if the representation learning procedure from walks are same. In experiments, we use the codes of DeepWalk and node2vec by their authors. The difference between them is the former employs the ’Hierarchical Softmax’ strategy in node repre-sentation learning, whileas the later hires the ’Negative Sam-pling’. We believe the reason for node2vec being worse than DeepWalk is the adoption of different learning strategies.
As shown, although ComE is relatively good at multi-label classification, it is not at inner community link prediction.
D. EVALUATION ON A REAL NETWORK
In previous NRL works, the evaluation of algorithms by multi-label classification is mainly on real world networks of which nodes are labeled, including Citeseer [36], Protein-Protein Interactions (PPI) 1, BlogCatalog [37], Flickr [37], and so on. Taking the labels of each node as its commu-nity identifiers, we check the commucommu-nity structures of these networks using the index connection number. We find that node labels of these networks are not consistent with their topology structures. Specifically, there exists a large number of nodes that have zero connection with some of their joining communities (referred as wrong assignments), and an even larger number of nodes that have large enough connections to some labels, but do not join in the corresponding commu-nities (referred asmissing assignments). These phenomenons are reasonable because labels of such a network are assigned according to strategies that cannot assure community prop-erty. Take BlogCatelog as an example, of which each node is a user of theBlogCatelog serviceand each edge indicates friendship between two users. A label of a node stands for one topic that the user is interested in. Though two users who are friends are likely to share a common topic of interest, they do not have to. Similarly, two users may have a same interest topic even they are not friends yet. Therefore, we believe it is not appropriate to evaluate node representation learning algorithms, that solve representations merely from network topology, by multi-label classification task on such networks.
Fortunately, there is one exception, Cora2, which is a social network of research paper citation relationships. It contains 2,708 nodes (papers) and 5,278 edges (citations). Each node has just one label that represents the class of the paper. There are 7 classes in total. Although labels are assigned to papers based on feature words they contain, the network connection structure is quite consistent with label assignments. Taking all label assignments as the total number, the wrong assign-ments and missing assignassign-ments take up only 6% and 9%, respectively. Therefore, we use Cora for evaluating involved algorithms by multi-label classification and inner community link prediction in this paper.
Fig. 13 illustrates the averageM icro-F1andM acro-F1 scores of multi-label classification test. As can be seen, gen-erally ComE is the best, whileas our two PCGNE algorithms are the second best. However, GraRep, which is good at node representation learning on synthesized networks with simple community structure, does not get better results here. The reason may lie in that the wrong and missing label assign-ments of Cora cause great negative effects on the predicted labels, though GraRep could obtain more accurate node pair relationships from node connection structure.
Fig. 14 displays the averageAU Cscores of inner commu-nity link prediction. We can find that PCGNE-DW, node2vec, PCGNE-N2V, LINE-c and ComE give out comparable best
1http://snap.stanford.edu/node2vec/POS.mat 2https://linqs.soe.ucsc.edu/data
0.5 0.6 0.7 0.8 0.9 Training Ratio 0.675 0.700 0.725 0.750 0.775 0.800 0.825 0.850 Micro-F1 (a) Micro-F1 0.5 0.6 0.7 0.8 0.9 Training Ratio 0.675 0.700 0.725 0.750 0.775 0.800 0.825 0.850 Macro-F1 (b) Macro-F1 DeepWalk
node2vec LINE-1LINE-c GraRepComE CNRL-DWCNRL-N2V PCGNE-DWPCGNE-N2V
FIGURE 13. M icro−F1andM acro−F1scores of Cora.
0.5 0.6 0.7 0.8 0.9 1.0 AUC GraRep DeepWalk CNRL-DW PCGNE-DW node2vec CNRL-N2V PCGNE-N2V LINE-1 LINE-c ComE
FIGURE 14. AU Cscores of Cora.
results. Surprisingly, both of node2vec and ComE that per-form badly on synthesized networks, achieve quite good results on Cora. We check the connection structure of syn-thesized networks and Cora and find that the ratio of test edge node pairs of Cora that have at least one common neighbor is at least 20% higher than these ratios of syn-thesized networks, of which the highest ratio is 42%. Such common neighbors can greatly benefit algorithms based on random walks. We believe here the performance of node2vec is dominated by such many common neighbors of test edge node pairs, instead of learning strategy of Skip-Gram as on synthesized networks. In contrast, GraRep, that is good at inner community link prediction on synthesized networks, becomes the worst on Cora. This may also be due to the wrong and missing label assignments of Cora since they affect the samplings of test edges and thus the predicting results.
From all conducted experiments, we could conclude that our two PCGNE algorithms are able to capture overlapping community structure property of networks well, and gener-ally can improve their basement, DeepWalk or node2vec, greatly for multi-label classification and inner-community
link prediction tasks. At least, by setting proper parameters, they will not degrade the performance of their basement.
VI. CONCLUSION
In this paper, we first quantitatively showed the potential effect of community structure on node representation learn-ing, then we defined the concept ofk-step partial community structurefor a network. Based on the1-step partial commu-nity structure, two node representation learning algorithms, PCGNE-DW and PCGNE-N2V that are based on DeepWalk and node2vec, respectively, were proposed. The two algo-rithms use a found 1-step partial community structure of a network to guide random walks that could implicitly capture community structure features of the network. Therefore, node representations learned from such walks could preserve net-work topology properties better. Since it is easier to find a high quality partial community structure for a network than to find a high quality complete community structure, our two methods do not import too much extra computation to the based methods. Extensive experiments on eight synthesized networks and one real network were conducted. The results suggested that the two partial community structure aided algorithms could improve their based algorithm significantly, especially on networks with complicated overlapping com-munity structure, and are competitive for node representation learning comparing with six other state-of-the-art network embedding algorithms.
In future, we will improve our PCGNE algorithms accord-ing to the overlappaccord-ing node removaccord-ing strategy by addaccord-ing mirrors for overlapping nodes, as described in section V-C3. We also would like to develop parallel PCGNE algorithms to further speed up large scale network representation learning, since partial community structure detection, random walk collection and representation learning by Skip-Gram could be easily parallelized.