THE DATA MANAGEMENT SYSTEM FOR THE GLOBAL TEMPERATURE AND
SALINITY PROFILE PROGRAMME
Sun, C.(1), Thresher, A.(2), Keeley, R.(3), Hall, N.(4), Hamilton, M.(5), Chinn,P. (6), Tran, A.(7), Goni, G.(8), PETIT de la VILLEON, L.(9) , Carval, T.(10), Cowen, L.(11), Manzella, G.(12), Gopalakrishna, V.(13), Guerrero, R.(14),
Reseghetti, F.(15), Kanno, Y.(16), Klein, B.(17), Rickards, L.(18), Baldoni A.(19), Lin, S.(20), Ji, F.(21), andNagaya, Y.(22) (1)
National Oceanographic Data Center, 1315 East-West Highway, Silver Spring, Maryland, 20910, USA,
Email: [email protected]
(2)
Commonwealth Scientific and Industrial Research Organisation, GPO Box 1538, Hobart, TAS 7001, Australia,
Email: [email protected]
(3)
Integrated Science Data Management, Department of Fisheries and Oceans, 1202-200 Kent Street, Ottawa, Ontario,
Canada, K1A 0E6, Email:[email protected]
(4)
National Oceanographic Data Center, 1315 East-West Highway, Silver Spring, Maryland, 20910, USA,
Email: [email protected]
(5)
National Oceanographic Data Center, 1315 East-West Highway, Silver Spring, Maryland, 20910, USA,
Email: [email protected]
(6)
Atlantic Oceanographic and Meteorological Laboratory, 1335 East-West Highway, Silver Spring, Maryland, 20910,
USA, Email: [email protected]
(7)
Integrated Science Data Management, Department of Fisheries and Oceans, 1202-200 Kent Street, Ottawa, Ontario,
Canada, K1A 0E6, Email: [email protected]
(8)
Atlantic Oceanographic and Meteorological Laboratory, 4301 Rickenbacker Causeway, Miami, FL 33149, USA,
Email: [email protected]
(9)
CORIOLIS Data Centre exploitation, IFREMER, BP 70 29280 Plouzane, France,
Email: [email protected]
(10)CORIOLIS Data Centre exploitation, IFREMER, BP 70 29280 Plouzane, France, Email: [email protected] (11)
Bureau of Meteorology, Box 1289, Melbourne, Victoria, 3001, Australia, Email: [email protected]
(12)National Agency for New Technologies, Energy and the Environment, P.O. Box 224, I-19100, La Spezia, Italy, Email: [email protected]
(13)
National Institute of Oceanography, Dona Paula, Goa-403004, India, Email: [email protected]
(14)
Instituto Nacional de Investigación y Desarrollo Pesquero, Universidad Nacional de Mar del Plata. Paseo V.
Ocampo N°1, (B7602HSA) Mar del Plata, Argentina, Email: [email protected]
(15)
National Agency for New Technologies, Energy and the Environment of Italy, P.O. Box 224, I-19100, La Spezia,
Italy, Email: [email protected]
(16)Japan Meteorological Agency, 1-3-4 Otemachi, Chiyoda-ku, Tokyo, Japan, Email: [email protected] (17)
BSH, Bernhard-Nocht Straße 78, 20359 Hamburg, Germany, Email: [email protected]
(18)
British Oceanographic Data Centre, Joseph Proudman Building, 6 Brownlow Street, Liverpool L3 5DA, UK,
Email: [email protected]
(19)
Instituto Nacional de Investigación y Desarrollo Pesquero, Paseo V. Ocampo N°1, (B7602HSA) Mar del Plata,
Argentina, Email: [email protected]
(20)
National Marine Data and Information Service, 93 Liuwei Rd. Hedong District, Tianjin, China, 300171,
Email: [email protected]
(21)
National Marine Data and Information Service, 93 Liuwei Rd. Hedong District, Tianjin, China, 300171,
Email: [email protected]
(22)
Japan Oceanographic Data Center, 5-3-1 Tsukiji, Chuo-ku, Tokyo, 104-0045, Japan, Email: [email protected]
1. ABSTRACT
The Global Temperature and Salinity Profile Programme (GTSPP) is a joint program of the International Oceanographic Data and Information Exchange committee (IODE) and the Joint Commission on Oceanography and Marine Meteorology (JCOMM) of the World Meteorological Organization (WMO) and the Intergovernmental Oceanographic Commission (IOC). Tasks in the GTSPP are shared amongst the
participating countries including but not limited to Argentina, Australia, Canada, China, France, Germany, India, Italy, Japan, UK, and USA. Scientists and data managers in these countries contribute their time and resources to ensure the continued functioning of the program.
The paper describes a framework for developing and implementing operationally a state-of-the-art data and information portal with capabilities of exploring in-situ data from near real-time data streams and integrating the
data streams with historical data. The paper also provides recommendations to ensure the interoperability of data and information systems being developed in different countries.
2. GTSPP BACKGROUND AND OBJECTIVES
The international oceanographic community’s interest in creating a timely global ocean temperature and salinity dataset of known quality in support of the World Climate Research Programme (WCRP) dates back to the 1981 IODE meeting in Hamburg, Federal Republic of Germany. The community's interest led to preliminary discussions by the Australian Oceanographic Data Center (AODC), the Marine Environmental Data Service (MEDS), now the Integrated Science Data Management (ISDM), of Canada and the U.S. National Oceanographic Data Center (NODC) during the second Joint IOC–WMO Meeting of Experts on Integrated Global Ocean Services System (IGOSS)-IODE Data Flow in Ottawa, Canada in January 1988. The development of the GTSPP began in 1989, and went into operation in November 1990.
The GTSPP has four primary objectives:
(a.) to provide a timely and complete data and information base of ocean temperature and salinity profile data of known and documented quality in support of global and local research programs, and national and international operational oceanography, (b.) to implement data flow monitoring and reporting systems for improving the capture and timeliness of the GTSPP real-time and delayed mode data to prevent data losses,
(c.) to improve and implement agreed and uniform quality control and duplicates management systems by coordinating activities among all participating countries and
(d.) to facilitate the development and provision of a wide variety of useful data, analyses, information products to clients.
3. GTSPP INFRASTRUCTURE
The GTSPP is a collection of volunteer organizations, and therefore role adjustments are needed to accommodate changes in levels of participation. Over the life of the program, there are consistently 5 to 7 countries, and up to 10 to 12 organizations participating in operations of the GTSPP. Currently, the GTSPP consists of three components:
(a.) Global Telecommunication System (GTS): The WMO provides the use of the GTS for the transmission of oceanographic messages collected through various JCOMM programs. The GTSPP uses this service to acquire real-time data exchanged.
Real-time data processing services are provided by the ISDM,
(b.) IODE Data Centers: Historical data are acquired either from other IODE national oceanographic data centres (NODCs), or from cooperation with projects such as the Climate Variability and Predictability (CLIVAR), the World Ocean Database (WOD) [7], and the Ship Of Opportunity Programme (SOOP) [2] and
(c.) Continuously Managed Database (CMD): The NODC provides data processing services for the long-term preservation of oceanographic data and the maintenance of the GTSPP CMD. GTSPP manages the acquisition, ingest processing, quality control and the long-term preservation for both low resolution data from the GTS, and the full resolution data from XBT’s, CTD’s, Moorings, profiling floats, and instrumented marine mammals. Figure 1 illustrates the GTSPP data flow and data management procedure. A given
international JCOMM or IODE centre may fit within several boxes in carrying out its national and international responsibilities.
4. DATA VOLUMES
The GTSPP handles all real-time and delayed mode profile data with temperature and salinity measurements. The real-time data in GTSPP are acquired from the GTS in the BATHY and TESAC codes forms supported by the WMO. In JCOMM, the BATHY and TESAC code forms are the ones used most often for distribution of ocean profile data on the GTS. Fig. 2 shows the progression in the use of these codes to make ocean data available. The radical change in mid 1999 shows the initiation of the Argo Project [8] and the beginning of the use of TESAC to report profiles from robotic profiling floats. It is evident from the figure that the number of BATHY reports has declined since 1999 but appears to have stabilized or perhaps is slightly increasing. Over 2007–2008, the number of BATHYs
Figure 1. A schematic diagram shows the data flow
and management of the Global Temperature and salinity Profile Programme (GTSPP).
reported steadily increased from 24,855 in 2007 to 27,775 in 2008, while the number of TESACs was 1,630,360 at the end of 2008, considerably increased from 821,321 in 2007. A new data set of 6,869 CTD profiles (as of December 2008) derived from marine mammals was made available for the first time beginning in July 2008 [4]. The data are useful because they get high data return from areas between 60° S and 70°S, where data were previously very sparse.
Figure 2. The number of stations reported as BATHYs and TESACs.
The GTSPP data contain upper ocean temperature and salinity data and come mainly from profiling floats, XBTs, conductivity-temperature-depths (CTDs) and bottles. These have been subdivided into different types and presentations made of the number of stations of each type by year. Figure 3 shows the number of profiles contributed to the CMD, grouped by instrument type. It is clear that the majority of data were from XBTs (which primarily report profiles with temperature only) up until 1999, when the Argo Project began to report temperature and salinity profiles.
Number of Stations by Instrument Type
0 20,000 40,000 60,000 80,000 100,000 120,000 1990 1992 1994 1996 1998 2000 2002 2004 2006 2008 Year
Bottle Other BT CTD XBT Profiling Floats
Figure 3. The station number of historical data by instrument type in the CMD
5. DATA QUALITY CONTROL
The Data quality control is a procedure of verification and validation. Quality control of the data in the GTSPP system is handled at a few centres. The ISDM
handles near real-time, low-resolution data and applies quality control processing [5] to these data before forwarding them to the NODC. The data handled by GTSPP include all profile data reported through the WMO GTS and so includes data from profiling floats, SOOP, moorings, research cruises that make their data available in real-time, and all other contributors, such as the most recent contributions from instrumented animals. Real-time quality control procedures are a combination of both automated and manual checking. The automated part is substantively the same as used in Argo though tests in the Argo program that are specifically targeted at known failure modes of profiling floats. The manual component to GTSPP real-time Quality-Control (QC) catches failures not detected automatically, albeit at the expense of adding a couple of days delay in making the data available.
The NODC currently utilizes a basic "Delayed Mode Quality-Control (QC)" process analogous to the QC carried out on the real-time data, and removes duplicates. The quality reviewing procedures generally include three steps: 1) cruise metadata checks, 2) profile data review and 3) quality control edit. The NODC developed and implemented data quality cruise editor (QCED) software, which performs automatic QC tests and allows an operator to view data from files in the GTSPP-ASCII format. The program allows the temperature and salinity profiles to be visually inspected and compared with climatology and with neighbouring stations, the position and time metadata to be checked and edited, and profile QC flags to be edited. At the end of the process, data, passed the quality review process, have been loaded into the GTSPP database with its data quality flags. The flags indicating data quality are those currently used in IGOSS processing with one extension. Table 1 describes the GTSPP data quality codes and their meaning.
Table 1. GTSPP Data Quality Codes
Code Meaning
No quality control (QC) has been performed on this element.
0 No quality control (QC) has been performed on this element.
1 QC has been performed; element appears to be correct.
2 QC has been performed; element appears to be correct but is inconsistent with other elements. 3 QC has been performed; element appears to be
doubtful.
4 QC has been performed; element appears to be erroneous.
5 The value has been changed as a result of QC. 6 ~ 8 Reserved for future use.
However, because quality assessment is shared over processing centres, it is possible that data flagged as doubtful by one centre will be considered acceptable by another or vice versa. Flags can be changed by a GTSPP processing centre as long as the original values are preserved and the originators flags can be recovered. This is commonly known as an audit trail. The use of the flagging scheme described meets the stated requirements of the GTSPP. It is recognized that as new testing procedures are developed, it will be necessary to re-examine data. With version flags preserved with the data, it is possible to identify what was done and therefore how best to approach the task of passing data through newer quality control procedures. Typically, results of the QC procedure are the setting of flags or making corrections where data illustrate instrument failures and human errors.
Delayed mode QC in GTSPP has evolved since its inception. During the World Ocean Circulation Experiment (WOCE) [11], three centres, Australian Commonwealth Scientific and Industrial Research Organisation (CSIRO), Scripps Institution of Oceanography (SIO) and Atlantic Oceanographic and Meteorological Laboratory (AOML), contributed to Ocean based delayed mode QC with results returned yearly to NODC. Since the end of WOCE, such scientific level QC has lapsed to a large degree. One of the near-term goals of GTSPP will be to revive this scientific QC, thereby making the data served through the project more immediately useful.
6. HIGHLIGHTS OF GTSPP ACTIVITIES
The two most important activities that the GTSPP is undertaking are:
(a.) Management of expendable bathythermographs (XBTs) data: The GTSPP has preserved original XBT data in the GTSPP Continuously Managed Database (CMD). This is critical for the examination and correction of the recently identified XBT depth bias problem, since the oceanographic community does not have consensus on what causes this bias or how to correct it, and
(b.) Implementation of unique data tag identification: GTSPP has developed and implemented the algorithm of Cyclical Redundancy Check (CRC) as a way to uniquely tag data circulating on the Global Telecommunication System (GTS) and the original profiles used to create the real-time messages.
6.1.XBT data management
In the mid 1990s it was found that some of the fall rate (depth-time) equations provided by the manufacturers of expendable bathythermographs (XBTs) were not correct
[3] [6]. The computed depth errors are outside the manufacturer’s specifications. The GTSPP has preserved XBT data, probe type, and fall rate equation information (when provided) in the CMD. Two new codes were created to retain depth correction information in the surface codes structure of the GTSPP data. The "DPC$" indicates the status of depth correction and the "FRA$" retains the conversion factor of 1.0336 if it was applied. Table 2 shows the "DPC$" code and its meaning. The XBT probe type and the fall rate equation are stored in the surface codes structure of the GTSPP data.
Table 2. GTSPP DPC$ Code
Code Meaning
01 Known Probe Type, Needs Correction 02 Known Probe Type, No need to Correct
03 Unknown Probe Type, Not enough information to know what to do
04 Known XBT Probe Type, Correction was done 05 Unknown Probe Type, but a correction was done
One strategy for the fall rate correction is to simply multiply the existing depths by a factor of 1.0336. This was the technique employed in applying the correction, with the multiplication factor stored in the file structure, when GTSPP played a key role in the WOCE and contributed to the final WOCE Data Resource DVD [10]. However, data that has not been corrected by the originator remains uncorrected in the CMD, although it may carry a DPC$ code value indicating that a correction is advised.
6.2.Unique data identification
One of the most difficult problems faced by the GTSPP has been in matching real-time and delayed mode data from the same original observation. The problems stem from reduced vertical resolution and measurement precision reported in real-time messages and from uncertainties or slight errors in positions and times. The delayed mode data may have these errors corrected and so matching real-time to delayed-mode is not simply a matter of matching ship identifier, position and time between real-time and delayed mode messages. In addition, many ships choose to ‘mask’ their identity when reporting data to the GTS leaving a further level of uncertainty when trying to match real time to delayed mode data profiles. The GTSPP developed software that considers detailed comparisons of individual station data when real-time and delayed mode positions are within 5 km distance and 15 minutes of time to each other. Although a degree of success has been attained in matching real-time and delayed mode data, there is still room for improvement.
A new strategy was discussed at a GTSPP meeting in 2002. Because of rules imposed by WMO, no changes were permitted to BATHY or TESAC code forms, so it
was not possible to add a unique identifier into real-time data transmissions. The solution was suggested by colleagues in Australia and hinges upon the use of a cyclic redundancy check (CRC) calculation. Since then, the GTSPP and the Ship and Environmental (data) Acquisition System (SEAS) program in the US have been collaborating to install the necessary software to implement the solution. The CRC is a 32 bit value based on the ASCII generated BATHY message of those values following the 8888 group and terminating at the equal (=) sign of the message.
When an XBT is taken, SEAS shipboard software creates a binary record of the entire data stream, metadata, and computes unique SEAS ID for archive aboard ship. This is referred to as the “complete message”. The complete message is transmitted to a land-based SEAS processing server and saved as the delayed mode record. The SEAS processing server builds two best real-time messages from the complete message. One is the usual BATHY message (GTS record) distributed on the GTS. The other real-time message, called a “real-time archive message (RTAM)”, has the same GTS record but with the SEAS ID as well as the computed CRC of the GTS record attached. The RTAM record is sent to NODC to become part of the GTSPP operation.
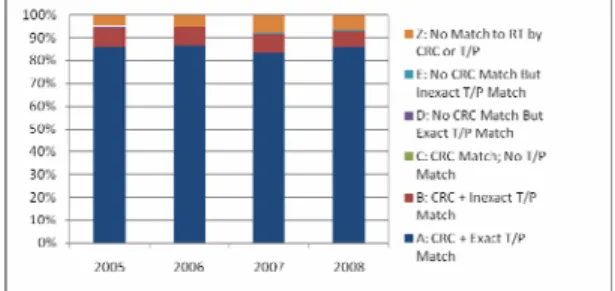
The BATHY message reaches ISDM. ISDM computes a CRC from the BATHY message using the exact algorithm used by SEAS and attaches it to the record and sends this to NODC. Comparing the RTAM record to the ISDM GTSPP record completes the GTSPP real-time data flow. Figure 4 shows the statistics of the comparison. The results show that the CRC scheme caught 94% of duplicates between 2005 and 2008. The other 6% failed in SEAS’ real-time QC tests and were not inserted to the GTS by SEAS.
Both Australia and France have expressed interest in implementing the same CRC scheme for data originating from their platforms. GTSPP will continue to monitor these results to test how well the unique identification scheme performs.
Figure 4. The statistics of the CRC scheme by comparing the real-time archive message and the GTS message.
7. CLIENTS AND SERVICES
The GTSPP is unique in that it consolidates all profile data collected in the ocean into a single data structure, with consistent quality control and duplicates processing. By doing so, it allows for ready comparisons of CTD and Argo data, XBT with CTD, CTDs from instrumented animals with Argo, etc. The GTSPP sends additional operational data from non GTS sources to numerical weather forecasting services. Marine operations receive data in operational time frames for such operations as ship routing and fishing strategies from the GTSPP as well. The GTSPP also provides higher quality timely data sets of temperature and salinity observations which are used for seasonal to inter-annual forecasting. Science and engineering users receive higher quality and more timely data sets for strategic studies and design.
The GTSPP users include, but are not limited to, the Australian Bureau of Meteorology (BOM). the National Centers for Environmental Prediction, and the Geophysical Fluid Dynamics Laboratory, the Southwest Regional Office of the U.S. National Marine Fisheries Service, the European Centre for Medium-Range Weather Forecasts, the Marine Data and Information Service (NMDIS) of China, and the Japan Meteorological Agency (JMA).
7.1.Online Data Access
The GTSPP data are available on-line through the GTSPP HTTP and FTP servers [1]. Users are allowed to view data file summaries, view station location plots, and download monthly real-time data or best copy data sets sorted by ocean and month of the year. All on-line data are distributed in the GTSPP ASCII format and the Network Common Data File (NetCDF) format. Users, who only need a subset of the data of their interest, use the GTSPP Web Interface (GWI) [1] or submit a request to the GTSPP data manager via email at [email protected].
7.2.Offline Data Delivery
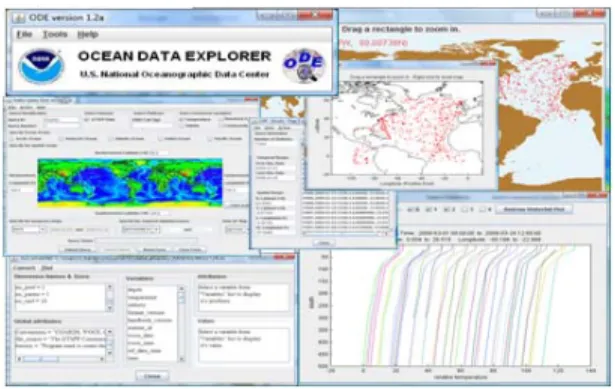
The GTSPP continues to publish data on optical disc media. As the disc uses the ISO9660 standard with the RockRidge extension, the platform-independent files can, in principle, be read on all operating systems. The GTSPP data disc comes with a software package, known as the "Ocean Data Explorer" (ODE), for users to examine oceanographic data stored on the disc. The ODE is a Java-based application that provides interactive graphical exploration and conversion of oceanographic vertical profile data stored on optical disc media. Fig. 5 is a composite image of screen shots showing the main features of the ODE. The ODE allows users to select and sub-set large in-situ data collections
using spatial/temporal metadata and to convert in-situ
ASCII text format. The ODE also provide an option that allows users to visualize profiles of their interest in a composite form, normally known as the “waterfall” plot as shown in the lower right corner of Fig. 5.
Figure 5. Screen shots of the Ocean Data Explorer’s main features.
8. PARTNERSHIPS
GTSPP collaborates with a number of international programs. In particular, it manages the XBT data collected by the operators of the SOOP, which is a subprogram of the Ship Observations Team (SOT) of JCOMM. GTSPP developed a strategy for linking XBT profiles to the SOOP XBT survey lines that were sampled and has been working closely with SOOP to assist in proper documentation of the XBT fall rate in the CMD. In addition, GTSPP also publishes a monthly ship report that highlights any errors found in the data so operations can monitor the performance of their ships’ data collection systems. This is then sent to the operators for future action.
The GTSPP currently works with the WOD project and the CLIVAR-Carbon Hydrographic Office (CCHDO) [9] to pull CCHDO data quarterly from the Internet. The quality controlled hydrographic and CTD data continue to be preserved and long-term archived at NODC. The CCHDO data contributes to both NODC and the Argo CTD Reference Database. GTSPP collaborated with the Argo program to fix GTS reports from Argo floats that were reporting pressure instead of depth to the GTS.
Ongoing support for GTSPP is provided by the various volunteer agencies. These agencies will continue to support GTSPP activities because of the benefits to their organizations and the international community. The agencies include, but are not limited to, the Instituto Nacional de Investigación y Desarrollo Pesquero (National Institute for Fisheries Research and Development of Argentina), CSIRO, BOM, and Oceanographic Data Centre, the British Oceanographic Data Centre (BODC), the Bundesamt für Seeschifffahrt und Hydrographie (Federal Maritime and Hydrographic
Agency of Germany), ISDM, NMDIS, the Institut Français de Recherche pour l'Exploitation de la Mer (French Research Institute for Exploitation of the Sea) , the Indian National Institute of Oceanography, the Italian National Agency for New Technologies, Energy and the Environment of Italy, the Japanese
Oceanographic Data Centre, JMA, AOML, and SIO
.
9. RECOMMENDATIONS
The success of the GTSPP not only provides an end-to-end ocean temperature and salinity profile data management system to the public, but also demonstrates its capability of archiving and re-processing data. Several recommendations, however, are made with respect to data management. For example, the oceanographic community recently discovered that the well-known XBT fall rate problem is complicated by inadequate instrument metadata in the past. GTSPP records fall rate and instrument type in the GTSPP database and has the ability to reprocess them, but only if the metadata are provided by the data orginators. It is suggested that any correction to global archives be carried out in cooperation with other data centres around the world to ensure consistency and international standards. Other recommendations are:
9.1.Recommendation 1
Any extra metadata that is provided or present, such as tests performed and failed, origins of the data stream, and data processing history, are critical aspects that should be retained by any future data management system. GTSPP has had a significant influence on the development of the Argo data system, where these same attributes have been incorporated. The programme will continue to exert influence through its members on the development of data systems in IODE and JCOMM.
9.2.Recommendation 2
A scheme of unique data, "tagging”, should be implemented immediately. Every original piece of data would be issued a unique identifier. This tag would never be separated from the data. Any subsequent processor would add further identifying information but would leave the original tag in place. As described, GTSPP has a partial implementation of one scheme and will be pursuing full implementation. There is no one solution for all kinds of data, but the adoption of a unique tagging scheme in all data systems will be promoted by GTSPP participants.
9.3.Recommendation 3
Information on calibration is difficult to acquire. Generally it does not accompany submissions to data centres with the delayed mode data. Researchers and data providers can assist in improving the ocean data archives, by providing such information with their
submissions. Documentation on data quality control and instrument calibration procedures should be available for public access. Through contributions to projects in JCOMM and IODE, GTSPP makes quality control documentation available on its web site and encourages other data systems to do the same.
9.4.Recommendation 4
It is a goal of the GTSPP to increase participation by the international community. All member states can participate more actively in the GTSPP through their normal JCOMM/IODE activities. To formalize this participation, member states can write to the IOC Secretariat, the WMO Secretariat, or to the Chair of the GTSPP Steering Group outlining the areas in which they wish to contribute.
9.5.Recommendation 5
In order to assure interoperability and common services to a wider community of users, cohesive collaborations with ongoing projects on data management and information systems such as the Data Management and Communications Subsystem of the Integrated Ocean Observing System (IOOS) and SeaDataNet are highly recommended.
9.6.Recommendation 6
As part of GTSPP’s contribution to Climate change research and forecast modelling, the members will actively look for support to re-establish the WOCE-level scientific QC of Upper Ocean Temperature data. Higher quality data is the key to accurate analysis and it will be of significant benefit to the international community if the best quality data is available from a single portal.
9.7.Recommendation 7
Data in the archives pre-1990 (pre-WOCE) is often of questionable quality. Bad data remaining unflagged affects reanalysis of the data as well as the detection of long-term trends and has been shown to have a highly significant impact on error bars and skewness of upper ocean temperature data. We are therefore examining ways to improve the quality of this archive through statistical QC with manual QC of suspect data. This will make use of the data in model initiation simpler since the user will not need to subject the data to their own QC process.
10. THE FUTURE
GTSPP will continue to concentrate efforts on temperature (T) and salinity (S) data and manage these in a prudent way, being sure that no data and information are lost. GTSPP must continue to be relevant, active, and responsive to the existing
programmes such as Argo, CCHDO, CLIVAR, SOOP, and WOD. GTSPP will work with new science and operational oceanography programmes and will treat these new programmes as clients. The new programmes may have requirements different from existing clients. This may mean adjustments in the kinds of tools needed, and perhaps some extensions to the data handled.
GTSPP will continue as a discernible joint IODE-JCOMM programme whose function is to provide the infrastructure of moving data from observers to users, as quickly as possible and at the highest possible quality. As an ongoing programme, it will continue to hold discussions among participants and with other programmes to resolve problems and discuss changes required. This encourages national data management agencies and improves data management internationally.
11. CONCLUSIONS
This paper describes the experience of the development and implementation of the GTSPP in the past two decades. Data are provided by networks in operational time frames and as global monthly data sets on the Internet. The unique features of the GTSPP include: (1) it unifies all temperature and salinity profile data into a common structure and therefore a common output, which is inter-operatable and extendable; (2) it sets standards for quality control of temperature and salinity profile data; (3) it documents data processing history; and (4) it carries complete metadata descriptions of every record. The success of the GTSPP allows users access to the most up-to-date, highest quality and resolution data at the time of request by managing both real-time and delayed mode data. It delivers data to users through complete quality control and duplicates elimination procedures within 48 hours of data collection (occasionally possible delay up to 30 days due to data transmission difficulties) and has standardized quality control procedures for ocean temperature and salinity profiles that have been adopted in many other projects and countries.
12. ACKNOWLEDGEMENTS
Many agencies have played important roles in the development of the GTSPP system. Each participating agency carries out a number of functions in handling the data for the GTSPP. The most important contributors are the collectors of the original data. Without their efforts, this compilation of data and information would not have been possible. This work was partially supported by the NODC management. The authors would also like to thank Ms. Amy Haase for proofreading this manuscript.
13. REFERENCES
1. Global Temperature-Salinity Profile Programme, June 2006. U.S. Department of Commerce, National Oceanic and Atmospheric Administration, National
Oceanographic Data Center, Silver Spring, Maryland, 20910. Date of Access,
http://www.nodc.noaa.gov/GTSPP/.
2. Goni, G., Roemmich, D., Molinari, R., Meyers, G., Rossby, T., Sun, C., Boyer, T., Baringer, M., Garzoli1, S., Vissa, G., Swart, S. , Keeley, R., Maes, C.. “The Ship Of Opportunity Program”, in Proceedings of the "OceanObs’09: Sustained Ocean Observations and Information for Society" Conference (Vol. 2), Venice, Italy, 21-25 September 2009, Hall, J., Harrison D.E. and Stammer, D., Eds., ESA Publication WPP-306, 2010. 3. Hanawa, K., P. Rual, R. Bailey, A. Sy, and M. Szabados
(1995). A new depth-time equation for Sippican or TSK T-7, T-6 and T-4 expendable bathythermographs (XBT).
Deep Sea Res. I(42), 1423–1451.
4.Hooker, S. K. And I. L. Boyd (2003). Salinity sensors on seals: use of marine predators to carry CTD data loggers. Deep-Sea Research, I(50), 927–939. 5. Intergovernmental Oceanographic Commission, 1990:
GTSPP Real-Time Quality Control Manul. IOC Manual and Guides,22, 128 pp.
6. Intergovernmental Oceanographic Commission, 1994: Calculation of new depth equations for expendable bathythermographs using a temperature-error-free method (application to Sippican/TSK T-7, T-6 and T-4 XBTs). IOC Tech. Series No. 42, 46 pp
7. Levitus, S., Boyer, T., Antonov, J., Garcia, H., J., Locarnini, R., Mishonov, A., Seidov, D., Baranova, O., Smolyar, I., Zweng, M.. “World Ocean Database and World Ocean Atlas”, in Proceedings of the "OceanObs’09: Sustained Ocean Observations and Information for Society" Conference (Annex), Venice, Italy, 21-25 September 2009, Hall, J., Harrison D.E. and Stammer, D., Eds., ESA Publication WPP-306, 2010.
8. Pouliquen, S., Schmid, C., Wong, A., Guinehut, S. Belbeoch, M.. “Argo Data Management”, in Proceedings of the "OceanObs’09: Sustained Ocean Observations and Information for Society" Conference (Annex), Venice, Italy, 21-25 September 2009, Hall, J., Harrison D.E. and Stammer, D., Eds., ESA Publication WPP-306, 2010.
9. Swift, J., Diggs, S., Fields, J., Kappa, J., Kinkade, D., Berys, C., Anderson, S., Barna, A., Lee, R., Morison, J., Muus, D., Piercy, S., Shen, M.. “The CLIVAR and Carbon Hydrographic Data Office”, in Proceedings of the "OceanObs’09: Sustained Ocean Observations and Information for Society" Conference (Annex), Venice, Italy, 21-25 September 2009, Hall, J., Harrison D.E. and Stammer, D., Eds., ESA Publication WPP-306, 2010. 10. WOCE Data Products Committee. 2002. WOCE Global
Data: Upper Ocean Thermal Data, Version 3.0, WOCE International Project Office, WOCE Report No. 180/02, Southampton, UK. http://woce.nodc.noaa.gov.
11. World Ocean Circulation Experiment (WOCE), 1990 – 2002. U.S. Department of Commerce, National Oceanic and Atmospheric Administration, National
Oceanographic Data Center, Silver Spring, Maryland, 20910. Date of Access, http://woce.nodc.noaa.gov/
![Fig. 2 shows the progression in the use of these codes to make ocean data available. The radical change in mid 1999 shows the initiation of the Argo Project [8] and the beginning of the use of TESAC to report profiles from robotic profiling floats](https://thumb-us.123doks.com/thumbv2/123dok_us/410423.2546838/2.918.492.803.451.638/progression-available-radical-initiation-project-beginning-profiles-profiling.webp)