Empowering Call Center
Simulation
In any call center, the biggest worry a call center
manager has is staff scheduling. Despite having a lot of
data measured by the call center infrastructure, there are
very few tools that can utilize these for staff scheduling.
As people are the most expensive resource in a call
center, it becomes imperative that staff scheduling is as
optimal as possible.
Arriving at the optimal number of call center agents, the
skills they should possess and the schedule they should
follow is essential for achieving a high level of customer
satisfaction and keeping staffing costs low. Several tools
in the market attempt to demystify work variation and
arrive at the right staffing fit. These tools largely use
analytical models developed by Erlang and Palm to
arrive at staffing requirements. These are models are
ideal during initial operations of a call center where
there is little measured data available. However, once
more data is available; use of simulation will yield more
accurate results.
A call center manager needs a tool/solution that
handles a call center in its entirety. The tool/solution
should use simulation, to remove assumptions made in
analytical models and factor in the complex behavior of
call centers. The tool/solution should be capable of
performing ‘what-if’ analyses towards predictive insights
for better scheduling. This paper illustrates such a
tool/solution and some key “what-if” analyses, which
will empower a call center manager schedule optimally
and drive profits.
About the Author
Benny Mathew
Benny Mathew is a Senior Scientist with TCS Innovation Labs- Performance Engineering, Tata Consultancy Services (TCS). His expertise is in discrete event simulation in the fields of computer systems, call centers and business processes. He has also worked in the areas of performance measurement, testing and file systems performance, databases and middleware. Benny Mathew holds a Masters Degree in Reliability Engineering from Indian Institute of Technology Bombay.
Table of Contents
1. Introduction 4
2. Calculating Staffing Requirement 5
3. Call Center Modeling and Simulation 7
Introduction
A call center is a people intensive business. Centers usually work 24/7 in three shifts. Bringing in the right number of people for each shift and keeping them optimally employed is a tough job. Overstaffing leads to idle staff and drives up costs, while understaffing leads to customer dissatisfaction and overworked staff. This can lead to higher turnover in an attrition plagued industry.
Call center managers may be familiar with the number of factors that influence customer and staff
experience at a call center. The call volumes are not fixed and change during the course of a day and week. The call volumes are also dependent on seasonal aspects and events such as product launches and
promotions. The call center staff work in shifts and need to be given time for breaks, meetings, trainings and meals during their working hours. To add to this, call center staff have differing sets of skill and productivity. It is important to accurately predict customer experience and staff experience taking into consideration all these influencing factors.
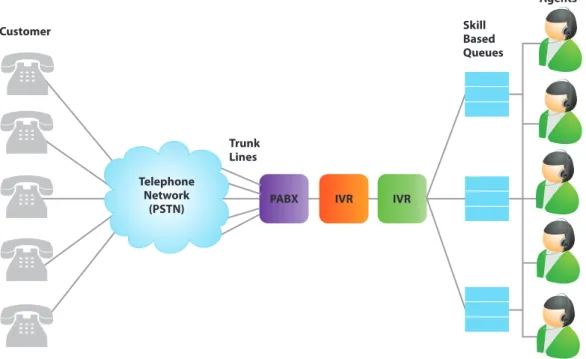
Call centers have tried to come up with agent schedules based on predicted call volumes by using plug and play products or by building their own. Before we present the case for fine grained modeling, let us examine the common approach to scheduling. Take a look at Figure 1 which shows the components of a typical call center. Inbound calls, initiated by customers calling in to the center, are first answered by an Interactive Voice Response (IVR) unit. If all trunk lines are busy, the call may be blocked. Customers may be able to complete the service interaction at the IVR. If not, the calls are passed from the IVR to an Automatic Call Distributor (ACD). The ACD is a specialized switch designed to route each call to an individual agent; if no qualified agent is available, then the call is placed in a queue. A queued customer may abandon call without receiving service.
Figure 1: Call Center Terminology Customer Trunk Lines Skill Based Queues Agents
PABX IVR IVR
Agents Telephone
Network (PSTN)
In a multi-skill call center, we distinguish various call types and agents by their skill group, defined as the subset of call types they can handle. Skill-Based Routing (SBR), or simply routing, refers to rules
(programmed in the ACD) that control in real time the agent-to-call and call-to-agent assignments. If more than one agent with requisite skill is available, agent selection criteria comes into the picture. The selection criteria can also be programmed in the ACD.
1
Call metrics such as Abandon Rate, Average Speed of Answer (SoA), Average Call Handle Time, Blockage, Agent Occupancy/Utilization, Staff Shrinkage, Service Level, Cost per Call may play a part in scheduling.
The required number of staff and the schedule they follow needs to be calculated so as to meet the specified service level. So for calculations, the minimum required data are service levels, projected call volumes and the average call handle time. The call volume projections are usually in 30 or 60 minute granularity. The call volume projections are based on historical work volumes and several factors like product marketing and campaigns, new releases, seasonal activities or competitive activities.
1.1Analytical Models
Analytical models are mathematical models that have a closed form solution. Closed form solution means that the solution to the equations can be expressed as a mathematical function. Call centers use analytical models developed by Agner Krarup Erlang to solve problems of adequate sizing of telephone exchanges in the early part of the 20th century.
1.1.1 Erlang-C Formula
The Erlang-C model, defines the probability that all agents will be occupied or the probability that a customer will have to wait in the queue.
1.1.2 Erlang-A Formula
Palm introduced a simple way to model abandonment. He suggested enriching Erlang-C in the following manner. Associated with each arriving caller there is an exponentially# distributed patience time. An arriving customer encounters an offered waiting time, which is defined as the time that this customer would have to wait, given that her or his patience is infinite. If the offered wait exceeds the customer’s patience time, the call is then abandoned; otherwise the customer awaits service.
Calculating Staffing Requirement
Wait Probability =
A = ratio of arrival rate to service rate n = number of agents
1.2 Limitation of Analytical Models
Erlang-C model as well as Palm’s variation of the model called Erlang-A assumes that call arrivals follow
# #
Poisson distribution and handle times follow Exponential distribution. Several research papers show that
#
these are not valid assumptions. For example handle times are more likely to follow LogNormal distribution. In addition to this assumption, the following complexities of a modern call center are not taken into account by these formulae:
Incoming calls require a certain skill on the part of an agent and not all agents will possess all the required skills.
Certain calls may be given higher priority. For example, a customer under a ‘gold service level’ will be given priority over customers who are at a ‘silver service level’. Customers reporting lost/stolen credit cards may be given a higher priority.
Based on training and years of experience, agents will have different handle times for the same type of skill. In other words, agents have different productivity levels. A certain percentage of calls may get misdirected to an agent who does not possess the skill to handle the call. This problem is especially more in case of IVRs that use voice-recognition software. The agent receiving misdirected calls needs to
redirect the call towards the right queue. This means that some part of an agent’s time may be wasted in handling the misdirected calls.
Many call centers use advanced routing techniques to route calls to the most efficient agent. At the end of each period, there will be calls that are in various states of completion and need to be carried forward to the next period.
n n n n Wait Probability = Where
A = ratio of arrival rate to service rate n = number of agents
λτ= abandonment rate μ= service rate
#
Statistical Distributions:
Poisson, Exponential, Lognornal are all statistical distributions. Statistical distribution influences the shape of the curve when we plot data values on X axis and the number of times the data values occurs (frequency) on the Y axis. For example, Normal distribution follows a bell-shaped curve.
In the case of a call center, our data is handle time or time between calls. Any DES tool should have support for rich set of standard distributions. The tool should also support if actual measurements are provided in files, so that if there is difficulty in fitting the data to a standard distribution, the measured data can be used directly for simulation.
1.3 Discrete Event Simulation (DES)
Discrete Event Simulation (DES) involves building a model of a physical system that portrays state changes at precise points in simulated time. This technique is used to predict the behavior of complex systems like management of parts inventory in a manufacturing unit, military combat, estimating beds required in a hospital and of course call centers. Using DES, the limitations of analytical model can be addressed. The next section shows how DES can be employed for predicting performance of a call center.
2.1 Call Center Resource Models
A queuing network representation of a call center is shown in Figure 2. Each component shown in the figure can be modeled as a resource in a discrete event simulator. During simulation, the attributes (also called parameters in certain simulation tools) of these resources can be changed. These attributes influence the resource’s behavior in terms of time taken by the resource to complete various tasks. In this case the task is incoming calls. The attributes need be comprehensive to cover all the shortcomings of analytical models. Following are the customer behavior attributes:
Retrials: Percentage of customers that will retry in case their first call failed due to non availability of trunk free telephone lines.
Abandonment of calls: The duration for which the customer will wait before abandoning the call. Following are agent attributes:
Skill set: The types of calls for which an agent has requisite skill to handle. Efficiency: Relative efficiency of each agent.
Absenteeism: The percentage of agents that will be absent on a particular day.
Time for breaks and meetings: The duration and times at which agents cannot take calls as they are attending meetings or having lunch/tea breaks.
Call Center Modeling and Simulation
n n n n n n
References
1. http://en.wikipedia.org/wiki/Game_engine 2. http://en.wikipedia.org/wiki/World_of_Warcraft 3. http://en.wikipedia.org/wiki/Tactical_role-playing_game 4. http://en.wikipedia.org/wiki/MMORPG 5. http://seriousgamesmarket.blogspot.com/2009/09/case-for-serious-games-in-heavy.html 6. http://thedesignspace.net/MT2archives/000632.html 7. http://seriousgamesmarket.blogspot.com/2011/04/video-collection-serious-games-for-high.html 8. http://unity3d.com/unity/engine/ 9. http://en.wikipedia.org/wiki/Stigmergy 10. http://en.wikipedia.org/wiki/Escalation_of_commitment 11. http://www.americasarmy.com/The call center infrastructure attributes include capacity (trunk lines), time required at IVR, queuing based on skill required and priority. One main infrastructure attribute is the agent selection criteria. Some options for agent selection criteria are:
Uniform Call Distribution (UCD): An incoming call is routed to the agent who has been idle for the longest time.
Expert Agent Distribution (EAD): An incoming call is routed to the agent who is best qualified to handle the call.
Least Occupied Agent (LOA): An incoming call is routed to the agent whose utilization is the least. Least Skills: An incoming call is routed to the agent who has the least number of skills. Calls are allocated preferably to a single skilled agent so as to preserve availability of agents who can handle more than one skill.
Least Cost: Calls are allocated to an available agent, costing the least in terms of wages drawn. Having provision for dynamically changing the agent selection methods based on how busy the call center would be ideal. For example, at low loads (say less than 60% of agents are busy), UCD can be used. When the call center load increases, an advanced strategy like EAD could be used.
2.2 Running the Simulation
Before the simulation can begin, values need to be assigned to the attributes of all call center resources. Here lies the strength of simulation. Given the large number of attributes, any single attribute or
combination of attributes can be changed to carry out complex ‘what-if’ analyses. The changes made to the attributes, influence the results of simulation. The main metric that any call center manager would be looking for in the results would be the customer SLAs. The customer wait times, lost and abandoned calls should be low and the challenge is to use the least number of agents to achieve the same.
2.3 Confidence in Simulation Results
Since DES depends upon the generation of pseudo-random numbers, longer the simulation runs, higher will be the confidence in the simulation results. In case of call centers this means that the simulation needs to be repeated several times until the desired confidence interval is met. So along with the metrics, the solution should also calculate the confidence interval.
2.4 Analyzing Simulation Results
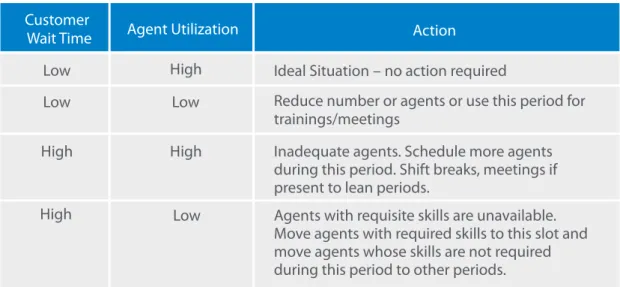
Once we have the various call center metrics with the desired confidence level, the report data can be analyzed. The metrics must be reported at short intervals, say for every 30 minute interval. This will help us fine tune the staff schedule, meetings, breaks. For example, if we find that there are periods which show higher wait times for customers, we can find periods where agents have low utilization and move their schedules to higher call periods. Some of the actions that can be taken based on a typical simulation report are shown in Table 1.
n
n
n
n
2.5 What-if Analysis
It is crucial that the solution should perform ‘what-if’ analyses. For instance the solution should be able to project optimization for various possible scenarios such as:
Impact of changing agent schedule: Schedule changes can be done to shift timings of agents as well as to accommodate break and meeting timings. These timings are changed so that there are no
meetings/breaks scheduled during peak hours.
Staggering of breaks (shown in Figure 3) can also help in improving customer experience. The tool should allow you to verify whether the changes have resulted in reduction in customer waiting times and
abandons. n
Customer
Wait Time Agent Utilization Action
Low High Ideal Situation – no action required
Low Low Reduce number or agents or use this period for
trainings/meetings
High High Inadequate agents. Schedule more agents
during this period. Shift breaks, meetings if present to lean periods.
High
Low Agents with requisite skills are unavailable. Move agents with required skills to this slot and move agents whose skills are not required during this period to other periods.
Table1: Analyzing Simulation Results – a sample
n
n
n
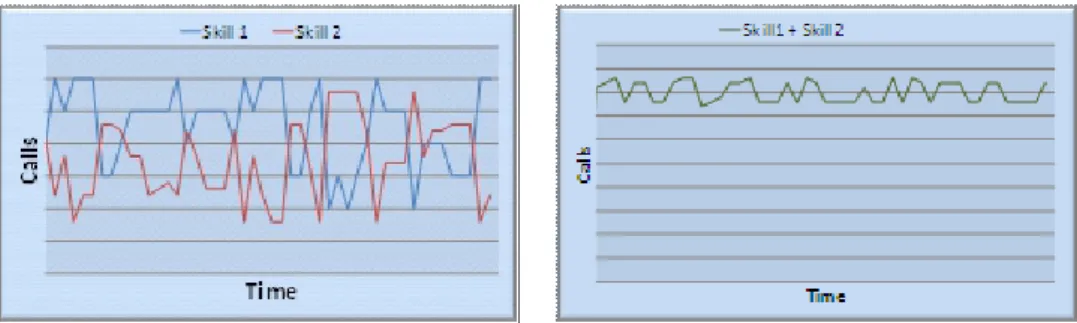
Impact of cross-training a few agents: Call volumes change during the course of a day. If there are single-skilled agents and we have sufficient staff to cater to peak call volumes of each skill, these agents will be underutilized during non-peak hours. On the other hand, multi-skilled agents will be able to keep changing the call type they answer based on which skill is in demand at any moment. As shown in Figure 4, it is especially helpful to cross-train agents with a skill whose peaks coincide with troughs of their original skill.
Impact of agent efficiency change: The overall efficiency of a call center keeps changing over time due to training, experience gained by agents and also due to turnover of agents (as shown in Figure 5). New batch of recruits due to their lack of experience are expected to have lower efficiencies. On the other hand targeted and intensive trainings can improve agent’s efficiencies. If the solution can simulate both scenarios, a manager can take decision on timing these appropriately, so as to avoid a fall in efficiency.
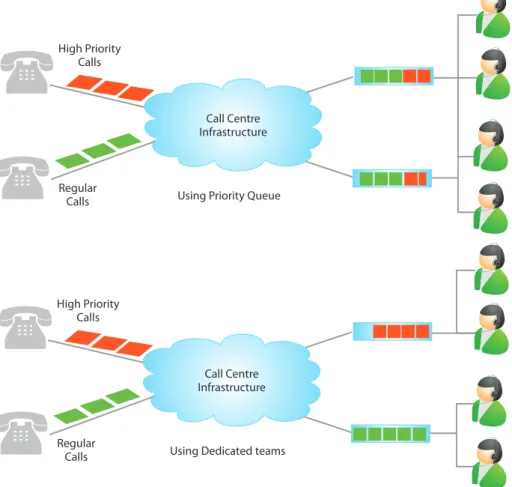
Dedicated Teams v/s Queue Priority: High priority customers can either be handled by offering priority while waiting in queue for free agents or their calls could be handled by a dedicated team who only handle high priority customers. Both the methods (as shown in Figure 6) have their
advantages/disadvantages. The tool should be able to simulate these options, so that you can decide on what is best for your call center and customers.
Figure 4: Balancing Variation in Call Volumes requiring 2 skills
3. Conclusion
DES based solution has many advantages over the Erlang formula based methods for simulating call center scenarios and predicting customer and agent experiences. It can support a wide range of attributes of a call center and hence helps in carrying out what-if analyses of call center situations. The tool or solution that can generate huge numbers of permutation and combination will give a call center manager many options to optimize operations and cut costs. It should also report metrics that cover several aspects of a call center operation such as: customer satisfaction, agent utilization and costs. Such a solution becomes a
comprehensive decision making tool for a call center manager, and will be more accurate than a plug and play tool or a simple in-house scheduler.
Figure 6: Handling High Priority Customers
Figure 1: Call Center Terminology Customer Trunk Lines Skill Based Queues Agents
PABX IVR IVR
Telephone Network (PSTNH) Agents High Priority Calls Regular
Calls Using Priority Queue Call Centre Infrastructure
High Priority Calls
Regular
Calls Using Dedicated teams Call Centre Infrastructure
Appendix
Terminology and Explanations Call Center:
A Call Center is a centralized office used for the purpose of receiving and transmitting a large volume of requests by telephone. A call center is operated by a company to administer incoming product support or information inquiries from consumers. Outgoing calls for telemarketing, clientele, product services, and debt collection are also made. In addition to call centers, collective handling of letters, faxes, live chat, and e-mails at one location is known as contact centers.
Call Center Metrics
Out of the entire range of metrics used at call centers, only those influencing staffing size is listed as follows:
Blockage: Indicates what percentage of customers will not be able to access the center at a given time due to insufficient network facilities in place. Most centers measure blockage by time of day or by occurrences of “all trunks busy” situations.
Abandon Rate: Percentage of calls abandoned while waiting to be answered. Abandon rate is not
typically a measure associated with e-mail communications, as e-mail does not abandon the “queue” once it has been sent, but it does apply to web-chat interactions.
Average Speed of Answer (SOA): Average time (usually in seconds), taken for a call to be answered by an agent. This is one of the most important metrics as far as customer service level is concerned. The
percentile value of SOA is also sometimes referred as Time Service Factor (TSF). 80/20 TSF means that 80 percent of the customers have less than 20 second SOA.
Service Level: Percentage of calls answered within a definite timeframe. This is same as TSF.
Agent Occupancy/Utilization: Agent occupancy is the measure of actual time an agent is busy on customer contacts compared with available or idle time. It is calculated as ratio of workload hours to staff hours.
Staff Shrinkage: The amount of time staff is unavailable for handling calls due to training, time off, breaks, etc.
Average Call Handle Time: Average time taken by agent to complete a call.
Cost Per Call: This is usually the cost of staff cost per call. However, some call centers may also include other costs like cost of telecom infrastructure, power and other rents.
Contact
For more information about TCS’ consulting services, contact [email protected]
All content / information present here is the exclusive property of Tata Consultancy Services Limited (TCS). The content / information contained here is correct at the time of publishing. No material from here may be copied, modified, reproduced, republished, uploaded, transmitted, posted or distributed in
vices M 02 13 I I I
About Tata Consultancy Services Ltd (TCS)
www.tcs.com
Tata Consultancy Services is an IT services, consulting and business solutions organization that delivers real results to global business, ensuring a level of certainty no other firm can match. TCS offers a consulting-led, integrated portfolio of IT and IT-enabled infrastructure, engineering and
TM
assurance services. This is delivered through its unique Global Network Delivery Model , recognized as the benchmark of excellence in software development. A part of the Tata Group, India’s largest industrial conglomerate, TCS has a global footprint and is listed on the National Stock Exchange and Bombay Stock Exchange in India.
For more information, visit us at
IT Services
Business Solutions Outsourcing
Subscribe to TCS White Papers
TCS.com RSS: http://www.tcs.com/rss_feeds/Pages/feed.aspx?f=w Feedburner: http://feeds2.feedburner.com/tcswhitepapers
About TCS Innovation Labs
Performance Engineering Research Center is part of TCS Innovation Labs and is engaged in measurement, emulation, analysis, modelling, and optimization of performance for distributed computing systems. It also develops of high performance components & frameworks, and tools for measurement and optimization of network protocol stacks.
TCS Innovations Labs are a part of the TCS Corporate Technology Organization (CTO),
which governs formal research and innovation in the company. We set up our first research lab in 1981 when the IT industry in India was just taking shape. We have several disruptive innovations to our credit.
Today, the global network of TCS Innovation Labs works across domains and new technologies to deliver a range of solution frameworks to help you achieve your business objectives. In the true spirit of collaboration, TCS CTO has created a Co-Innovation Network (TCS COIN™) anchored in our labs. This connects to several entities in the innovation ecosystem and we co-innovate with them, capitalizing on the strengths of each, to the benefit of all.