Monitoring Extensions for Component-Based Distributed Software
Nikolay K. Diakov, Marten van Sinderen, Dick Quartel
Centre for Telematics and Information Technology, University of Twente, The Netherlands
{diakov, sinderen, quartel}@cs.utwente.nl
Abstract
This paper defines a generic class of monitoring extensions to component-based distributed enterprise software. Introducing a monitoring extension to a legacy application system can be very cost-ineffective. In this paper, we identify the minimum support for application monitoring within the generic components of a distributed system, necessary for rapid development of new monitoring extensions. Furthermore, this paper offers an approach for design and implementation of monitoring extensions at reduced cost. A framework of basic facilities supporting the monitoring extensions is presented. These facilities handle different aspects critical to the monitoring process, such as ordering of the generated monitoring events, decoupling of the application components from the components of the monitoring extensions, delivery of the monitoring events to multiple consumers, etc.
The work presented in this paper is being validated in the prototype of a large distributed system, where a specific monitoring extension is built as a tool for debugging and testing the application behaviour.
1.
Introduction
Nowadays, most consumer products are composed of building blocks, or modules, that are supplied by different manufacturers. Combining diverse modules together is impossible without the compatibility requirements outlined in international or company standards for a family of products. The electronic household appliances and computer hardware are good examples of the extensive experience of the industry in this area, producing compatible and reusable hardware modules. The benefits from reusability and compatibility are obvious as markets become wider or integrate, demand for new up-to-date products grows and new technology solutions emerge at fast rates. The experience from the consumer products industries is quickly entering the dynamic world of software industry, resulting into a move towards development of new solutions for component-based software design and implementation.
There are numerous definitions of what a software component is. We choose a definition inspired by [5] where a software component is a binary unit of
independent production, acquisition, and deployment that interacts to form a functioning system.
Software components introduce a new abstraction in the software process, which entails the binary representation of components, deployment and instantiation schemes, etc.
Usage of software components in a distributed environment for development of complex applications is widely offered on the market, e.g., by products called application servers [9,10]. Distributed environments introduce additional complexity and unpredictability to the software applications, as network latencies, software incompatibilities and other problems may seriously influence the behaviour of a distributed application. Monitoring software have widely been used for solving some of these problems by providing: quick response to events in the distributed environment (load balancing, fault tolerance), analysis of recorded logs (performance, replica deployment), debugging and testing [1], etc.
In this paper we assume that monitoring software is always present or introduced together with the components of a distributed application, with the goal of exposing application behaviour through a standard configurable framework. The paper has the following objectives: (1) Identify the minimum but sufficient support for monitoring within the generic components of the distributed system. This support is necessary for rapid development of event-driven monitoring extensions, which typically concentrate functionality that interprets information about the dynamic behaviour of a distributed application. (2) Offer an approach for design and implementation of monitoring extensions at reduced cost. A framework of basic facilities supporting the monitoring extensions is presented. These facilities handle different aspects critical to the monitoring process, such as the ordering of the generated monitoring events, decoupling of the application components from the components of the monitoring extensions, and delivery of the monitoring events to multiple consumers.
The remainder of this paper is organised as follows. Section 2 outlines a high-level application model necessary for the definition of monitoring extensions. Section 3 defines the architecture of a monitoring extension. Section 4 explains our prototyping efforts carried out in two research projects. Section 5 makes an overview of related work. Section 6 presents conclusions and intentions for future work.
2.
Generic Application Model
The component-based applications may have arbitrary complexity and often use additional software technologies, like specific middleware for distribution, and transaction monitors. In order to design our framework for monitoring extensions we need to have a generic perception of what a distributed component-based application is.
Application components
Middleware
Figure 1. Application components
communicating through middleware.
A component-based distributed application consists of software components that are the units of distribution. We assume that the application follows a pattern of a component model. At this level we can stay independent from a particular component model as we need the notions only of architectural concepts standard to all component model. Such concepts include common communication contracts (CORBA, DCOM, EJB 1.1 interfaces), lifecycle of a component (instantiation, migration, replication, suspend/resume, destruction, etc), components as black-boxes, and finder facilities (naming/directory services).
The components are entities communicating through interaction contracts [2]. The communication is handled from the middleware layer (Figure 1) where aspects like component location, OS and implementation language specifics, are taken care of transparently to the developers and their application specific code.
Components of a new extension Application components
Middleware
Figure 2. Introducing a new extension to an
existing application.
Any enterprise-wide application becomes a legacy system immediately after its release. Object-oriented and component technologies have been some of the tools that give strong support for a successful solution to this problem, by providing reusability,
configurability, version control, etc. Nevertheless, depending on the functional requirements, a new software extension to a legacy system may require changes and even replacement of application components, which often leads to high development costs.
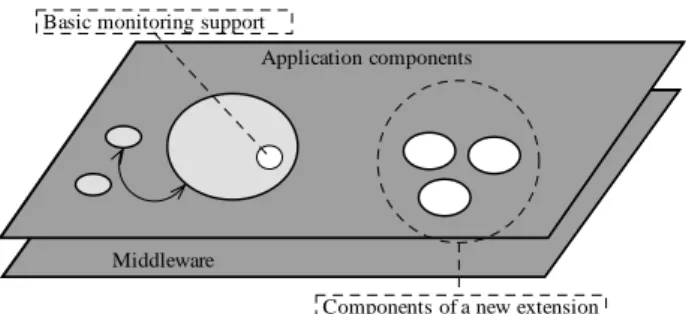
This paper is targeted to a class of software extensions that perform observations over the behaviour of the application components in the distributed application. We classify these software extension as monitoring extensions (see Figure 2). If generic monitoring support is introduced into every original application component, the developer of the monitoring extensions does not need to change the existing application in order to implement the observation functionality of this extension.
An example of a monitoring extension is a distributed testing tool that generates message sequence diagrams. These diagrams describe all remote invocations between application components, and their ordering, for the purpose of error discovery or conformance analysis [2]. Another example is an accounting module for online services, where the usage of particular application components (service components) is charged according to particular policies.
In order to provide a relevant solution for generic monitoring extensions, we need to analyse what would make a monitoring framework a desirable solution.
2.1
Monitoring requirements
Let’s assume that a legacy application is modified to facilitate a monitoring extension. Typically such an extension needs information about component state and about communication between components. State and communication do not exhaust the interest for information but we consider these two as most important.
In general, two types of monitoring approaches are distinguished, namely the event-driven approach and the time-driven approach [15]. Our monitoring framework adopts an event-driven approach, since we are interested in the behaviour of components in a distributed application.
When component-based software is built from components, exposing internal component state is normally done through component interfaces, component events and properties, which is decided at design time for each component. A monitoring extension can make perfect use of component events and properties, however, component interfaces are just APIs and have not been designed for emitting notifications to yet non-existing applications. Consequently, developers have to open the source code and add the required notifications manually. This approach can be very expensive in terms of time and man power, and the probability for introduction of errors is high.
Our monitoring framework uses a different approach in which each application component contains some generic monitoring functionality. This functionality enables component interfaces to be observed, elements of these interfaces (typically its operations) to be intercepted and monitoring events to be generated for all interested parties in the system, without altering the application components. Furthermore, the monitoring framework should satisfy the following requirements.
Accuracy. The granularity and frequency of the generated monitoring events is defined at the level of the computational model of the middleware being used by the application programmer. Our event-driven monitoring framework allows observations on all programming elements (interfaces, their operations, operation parameters and results, exceptions) used to implement applications and components. Time-driven monitoring is possible, since monitoring extension may request measurements on a time basis.
Consistency. Components that process monitoring events (called consumers) should be able to restore the order in which these events were generated. Because of the innate concurrency of a distributed environment, delays on communication networks and differences in operating systems on the separate computing nodes, the order in which monitoring events arrive at the consumer might not be the same as the order in which they were generated. Under such conditions, software extensions sensitive to the ordering of monitoring events will not function properly and perform unsatisfactory. Tackling this problem for every new extension results in significant overhead and therefore the monitoring framework should provide consumers with a consistent view on the ordering of monitoring events.
Scalability. A scalable legacy application may not scale anymore after applying a monitoring extension, because each producer of monitoring events may have to send these events to many different consumers. Since the development of a proprietary event notification scheme may involve a considerable amount of work, the monitoring framework supports scalable monitoring extensions by employing a notification service to decouple event producers and event consumers.
Applicability. The success of the monitoring framework depends largely on how easy it can be incorporated, managed and used during the development process. The framework should relieve the application developer from many (generic) monitoring issues, by providing proper tool support and adequate software libraries. Other important issues are performance and flexibility in terms of static (compile-time) versus dynamic (run-time) configurability of the monitoring framework. Interception of an operation at an interface costs CPU time for calling the notification handler. Transmitting unnecessary data over the network, encapsulated in the
event, may cause bandwidth problems. A flexible generic monitoring framework allows reconfiguration of the set of events that will be generated and sent, based on the interest of the event consumers. The format of the basic information model of the captured events should be extendible and rich.
2.2
Framework and facilities
We propose a monitoring framework that incorporates basic monitoring support in every legacy application component, provides certain facilities to assist the proper operation of the framework and allows rapid development of monitoring extensions for the observed application.
Application components
Middleware
Components of a new extension Basic monitoring support
Figure 3. Two of the basic types of actors in
the proposed framework: basic monitoring support and the components of the new
extension.
The basic support for monitoring application components is implemented by a slim software library bound with every application component, which produces notifications in the form of monitoring events (Figure 3). The components of the monitoring extension are the event consumers that show their interest in specific events of the monitoring framework by initiating dynamic reconfiguration on the monitoring support to the application components (see 3.2).
2.2.1 Monitoring support in the generic application components
The programming model of most contemporary middleware employs specific mediator (proxy) objects that are responsible for the communication specifics (Figure 4). In CORBA these objects are the stub at the caller and the skeleton at the interface implementation. Since the proxy objects participate in every remote invocation they can be reconfigured to notify the monitoring support in the application component, about the ongoing remote invocation. The monitoring support is then responsible for generation and emission of an event encapsulating all the necessary information according to the information model. Details about an
implementation of the monitoring support can be found in [2].
Applicat ion component
Monitoring support
Middleware specific proxy objects
Figure 4. Inside the application component.
The monitoring events related to remote invocations we call interaction events. The frequency and granularity of the interaction events follows closely the computational model of the middleware and enforces the accuracy requirement.
Other type of monitoring events are lifecycle events that reflect the dynamics of the component instance, an aspect of the component model. For example, instantiation and destruction are basic notifications that produce lifecycle events.
For applying time-driven monitoring, the developers have to define their custom event type support. Time-driven monitoring is usually tightly related to particular functional requirements and falls out of the scope of this paper.
The monitoring support framework is flexible and allows installation of new event type support. Nevertheless, adding this new functionality may need augmentation of the source code of the application component. In this case, the software developer can still benefit from the monitoring framework, as it provides consistency and takes care of event filtering and delivery.
Meeting the applicability requirement is a serious challenge. The monitoring support in every application component must allow dynamic reconfiguration of the set of generated events. This can be achieved through a generic monitoring interface on each application object. Special event filters can be passed to the monitoring support in the application component. These filters encapsulate the interest of the event consumers for particular monitoring events. If we specialise further using the CORBA middleware technology, the standard Notification service already provides such type of event filters. The COM+ events model also allows implementation of producers that announce their interest for particular events by querying the COM+ catalogue.
Filtering at the source of events can be very useful for lowering the CPU utilisation and network traffic at
the physical nodes where the application components are running. An alternative approach is to use filtering in the facility responsible for delivering the events to the event consumers, however in this case the network load between the application objects and the event facility can become very high.
2.2.2 Framework and Facilities
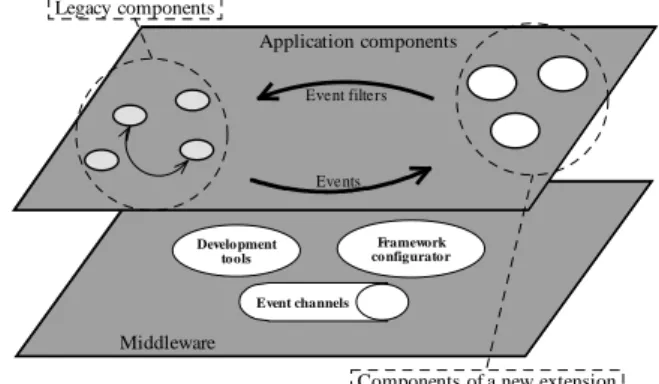
The monitoring framework provides the facilities and configurations that glue together the components of the legacy application and the monitoring extensions.
Application components
Middleware
Components of a new extension Legacy components Event channels Framework configurator Development tools Event filters Events
Figure 5. The elements of the monitoring
framework.
The monitoring facilities can be found as extensions to the middleware. The whole set of development tools for automating the development of application objects with monitoring support is a monitoring facility. The framework configurator is a monitoring facility responsible for deployment and initialisation of the monitoring framework. It is used mainly during system startup. The event channels are provided by an event dispatching facility like the CORBA notification service. Where the middleware does not offer such service, this facility has to be additionally implemented.
A typical scenario of adding a monitoring extension to a legacy application includes several step:
1. Development of the software extension according to the monitoring API and using development tool facilities;
2. Using the framework configurator facility, the event channels necessary for the operation of the monitoring extension are deployed; 3. Having the legacy application running, the
monitoring extension is started and it registers to the event channels and passes its event filters to the event dispatching facility. The event dispatching facility pushes the necessary filters to the corresponding application components;
4. The monitoring support in the application components is reconfigured to emit events
matching the criteria delivered with the event filters;
5. Events start flowing from the application components to the event channels where events are multi-casted to all interested monitoring extensions;
6. The monitoring extension starts analysing the arriving events, and performs activities specific to its mission tasks.
3.
Monitoring Extensions
The monitoring extensions to a legacy application, concentrate mainly observation and analysis functionality. The information these software extensions are gathering can be categorised by business domain. For example, an accounting extension requires information about starting and stopping accountable sessions, accounting policies, etc. In the domain of software testing and debugging, the terminology is different, where remote invocations and parameter values are important, together with concurrency information (e.g., thread identifications, timestamp of occurrence).
The application components emit monitoring events that are received at the monitoring extension. The number and variety of the generated events can be dynamically adjusted by using the facilities of the monitoring framework.
3.1.1 Basic information model
An essential monitoring requirement is the richness of the basic information model of observed information. Logical Clock NTP Timestamp Trail Label Time <fixed> source_id source_type node_id container_id process_id Address <fixed>
Information (determined by event type) <dynamic> interface_id interface_type operation_id parameters announcement_id ...others
Interaction Events Life-Cycle Events
Figure 6. The format of the monitoring
event.
The monitoring event is a persistent object that contains a number of data fields. Its information model consists of three groups of fields: time, address, and information (Figure 6). The time group contains information about the time when the event occurred and the order and causality relation of the particular event with the other events in the system. The address group contains a set of fields with information about the source of the event. The information group contains variable fields, depending on the supported event type. For example, an interaction event captures information about interface (interaction contract) id
and type, operation name, and parameter values, while a lifecycle event contains details about the creation, suspend/resume, or destruction of a component instance.
The time and address data fields in the monitoring event are fixed. These fields encapsulate all necessary information to cover the consistency requirement and define the exact location of occurrence of the event in the monitored application regarding ’space’ and ’time’. The set of information fields is variable and reflects the event type. Our framework supports installation of new event types in the legacy application components. Since this is a static configuration process, the component instances may have to be restarted and in some cases recompiled. By implementing event types, the developers of monitoring extensions may use the features of the monitoring framework, and at the same time have the freedom of a proprietary implementation.
3.2
Monitors
We suggest that observation functionality (i.e., collecting and processing observations) is concentrated in a separate component. The part of the monitoring extension that encapsulates the observation functionality we call a monitor (Figure 7). The monitor can be plugged into the monitoring framework and start receiving notifications.
Application components
Monitor Other
Other
T he components of a new extension Legacy components
Figure 7. Structure of a monitoring
extension.
Several monitors can operate on the same legacy application. Although each of the monitors can configure the application components to issue different sets of events, conflicts will not arise as the basic monitoring support within each legacy component can handle multiple dynamic configurations at the same time. For example, when Event Filters together with a CORBA Notification Service are used for specifying interest in particular events, the legacy application components can combine different event filters, in order to update its set of currently generated events.
3.3
Design guidelines
The developer of a monitoring extension using our monitoring framework, can benefit from some design guidelines we have composed during our research.
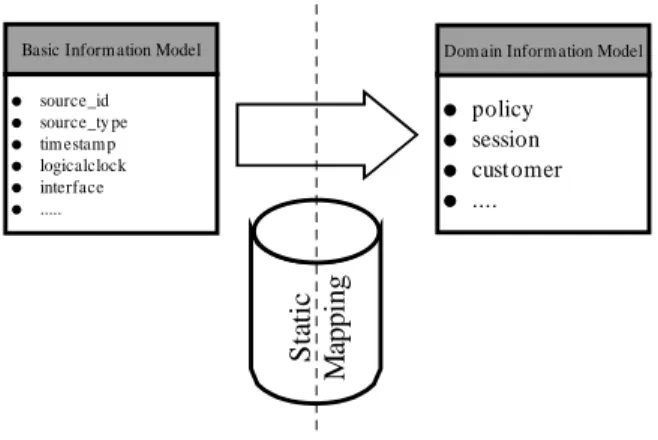
source_id source_ty pe tim estam p logicalclock interface ...
Basic Inform ation Model
Sta tic M appi ng policy session cust omer ....
Dom ain Inform ation Model
Figure 8. Static mapping from basic to
domain specific terminology.
The main task of a monitoring extension is to somehow interpret the notifications coming from the components of the legacy application. Since each software application solves a task in a particular business domain (e.g. accounting, software testing, security), there is a set of the domain terminology associated. The first step of identification of the terminology is part of most software development processes, thus we will not further discuss it. The second step is to define events in the domain language, that directly relate to the observation process. For example, starting an accounting session can be a domain specific event. These events form a domain information model specific to the particular monitoring extension. The next step is to define a static mapping from the basic information model of the monitoring framework into the domain information model. Static mapping means that the rules for translation of events from the basic model into events of the domain model are specific to the domain at hand. An example of such a mapping is the translation of a monitoring event indicating the start a of a specific application component into a "start account session" event in the accounting domain.
Once the static mapping is done, the implementation of the monitoring extension is straightforward, by implementing the event handlers and the state machine that represent the logic of the particular problem solution.
We have justified this approach in an experiment with our prototype, where a management monitoring application has been implemented, that shows the dynamic deployment diagram of the high-level compound component of a TINA-based distributed platform for online services [7].
4.
Prototype
The FRIENDS (FRamework Integrated ENgineering and Deployment of Services) project [7] defines and implements an architectural framework
that supports service development, deployment, and usage in an integrated way, based on analyses of the needs of service developers, service providers, and service users. The FRIENDS platform architecture is based on the Telecommunications Information Networking Architecture (TINA).
For the purposes of the FRIENDS software platform, the Distributed Software Component (DSC) framework [3, 4] has been developed. The DSC framework encapsulates a component model similar to the CORBA Components model, which builds on top of the CORBA middleware architecture and basic services.
The basic monitoring support is integrated in the generic DSC components. An event dispatcher (DSCMonitor) has been implemented that takes care of the event delivery. In the next release of the monitoring framework, DSCMonitor will be replaced by a Notification service.
The FRIENDS services platfrom has been implemented with generic DSC components, this way the monitoring framework becomes available for usage.
We have built a number of monitoring extensions to the FRIENDS service platform.
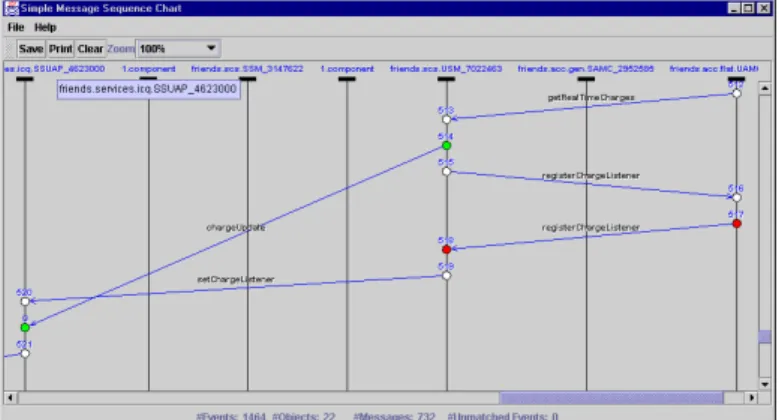
• A debugging and testing extension that observes the interactions between the components of the FRIENDS platform and produces accurate visual message sequence diagrams of the actual execution (Figure 9).. The domain mapping for this monitoring extension, for example, maps simple outgoing and incoming communication events (depicted as circles) to messages (depicted as arrows) exchanged between two component instances
• A persistent storage system that has the task to log all events to a database. In this case, no mapping is necessary.
• A topology viewer of the dynamic instances of the high level TINA components. This extension maps the interactions between instances of the software components, to the messages passed between abstract TINA components (Figure 10). The translation is done towards the TINA architecture domain terminology, and a graphical representation has been offered to the user.
Figure 9. Message sequence diagram.
The graphical user interface of the debugging and testing extension (Figure 9) visualises a message sequence diagram of the concurrent execution of a distributed application. The horizontal axis shows component instances and the vertical axis shows the time order of the events. This tool provides support for visual analyses of the communication behaviour of a distributed system, where the number of concurrent component interactions may be very large.
Figure 10. Dynamic deployment graph
Figure 10 depicts the visual user interface of a tool that shows a graph, where nodes represent TINA-compliant entities and arrows represent the communication activity between two entities. TINA entities may contain several instances of software components and an arrow between two entities reflects that remote invocations are performed. This monitoring extension is able to animate the activities, by highlighting entities currently involved in the communication process, and showing solid directed arrows to represent ongoing invocations between entities.
Technical information about the software solutions for these applications can be found in [2].
5.
Related work
The research outlined in this paper is a generalisation of the work done in [2], where a framework for debugging and testing distributed
applications has been designed and implemented. This framework fulfils the consistency and partially the accuracy requirements. With the ongoing generalisation of the framework, the debugging and testing becomes a monitoring extension to a legacy application. For the purposes of testing, the event filters mask the full set of events, whereas the debugging monitors analyse these events and visualise the flow of control through the legacy application.
In [11], a multi-layer monitoring framework called MIMO is proposed that supports distributed environment by introducing observation software at the middleware level. The MIMO framework offers tools for automating software development. Under certain conditions, MIMO can be used for building monitoring extensions for legacy systems.
In contrast to our approach, MIMO leaves the consistency of the events outside the scope of the monitoring framework. Furthermore, it only considers tools that correspond to monitoring extensions in our set-up and does not provide guidelines for tool construction. The implementation of the MIMO framework involves wrapping of the interfaces of the request broker, which may conflict with several CORBA implementations due to usage of non-standardised interfaces on the ORB. In our approach we choose to perform tool-supported modification on the proxy objects (Java portable stubs and skeletons) in order to introduce in a standard way the hooks necessary for the functioning of the monitoring support in each application object. Our framework supports the level of application components with a clear notion of a component model involved. The monitoring support can be extended with support for different event types, that make use of the basic features of the original framework.
Reflective middleware can offer useful support for the implementation of a monitoring system. A good example is dynamicTAO [13] that is built around a CORBA compliant request broker. It is able to maintain and expose the configuration of its highly customisable internal engine. One of the example configuration implementations for dynamicTAO introduces monitoring functionality.
DynamicTAO keeps consistency of its internal state with respect to dynamic reconfiguration. As a part of the ORB, the monitoring support ensures order of the monitoring records (events) inside the ORB, however, the monitoring support does not offer consistency of the event model with respect to the events generated from a large distributed system that runs several ORB instances.
In [8], a method is described for run-time monitoring of distributed applications that supports a software development process. The approach provides consistent event model. The level of granularity is the CORBA object, whereas our monitoring framework enhances this approach with introduction of the component abstraction. The configuration of the
monitoring code in [8] can be dynamic and supported by tools. By applying a notification service, our approach introduces an additional scheme for decoupling event sources from event consumers. Additionally, our monitoring framework supports several event types and support for different ORB implementations.
6.
Conclusion and future work
The monitoring framework we propose supports the quick and cost-effective development of monitoring extensions to component-based distributed applications. We have implemented several monitoring extensions to proof the applicability and usefulness of the framework.
The testing and debugging monitoring extension is used in the FRIENDS project for software verification and run-time error discovery. The dynamic deployment graph monitoring extension has been implemented in a week time following our design guidelines.
Work on our monitoring framework will continue in several directions.
The current framework provides means for partial capturing of causality. In order to improve the opportunities for performing formal analysis on the event traces, we need to extend the causality support in the monitoring framework. Provided a formal model of the behaviour of a distributed system is available, conformance testing can be done assisted by a tool. For this purpose, a mapping has to be defined from the execution model of the monitoring system to the formal model describing the system behaviour [12].
We plan to perform tests to measure the impact of the monitoring framework on the overall system performance.
We continue our implementation effort to cover several middleware technologies (CORBA, COM+) as well as the most widely used component models (CORBA Components, COM+, EJB 1.1).
The COM+ event model allows implementation of our monitoring framework for COM+. A standard tool [14] uses the COM+ metric API tocapture traces of communication and lifecycle events for COM+ objects. Our framework can be integrated with the existing COM+ facilities to provide additional consistency of the event system, scalability for monitoring extensions and filtering at the event source.
References
1. Diakov, N.K., Batteram, H. J., Zandbelt, H., Sinderen, M. J., "Monitoring of Distributed Component Interactions", RM’2000 Workshop on Reflective Middleware, 2000, NY, USA,
http://www.comp.lancs.ac.uk/computing/rm2000/papers /8-awentenkov.pdf.
2. Diakov, N.K., Batteram, H. J., Zandbelt, H., Sinderen, M. J., " Design and Implementation of a Framework for
Monitoring Distributed Component Interactions", submitted to IDMS’2000, Workshop on Interactive Distributed Multimedia Systems and Telecommunication Services, 2000, Enschede, NL. 3. Batteram, H.J., and H.P. Idzenga, “A Generic Software
Component Framework for Distributed Communication Architectures,” ECSCW’97 Workshop on Object Oriented Groupware Platforms, 1997, Lancaster UK, pp. 68-73.
4. Bakker, J.L., and H.J. Batteram, "Design and evaluation of the Distributed Software Component Framework for Distributed Communication Architectures", Proceedings of the 2nd international Workshop on Enterprise Distributed Object Computing (EDOC'98), pp. 282–288, San Diego (USA), November 3–5, 1998. 5. Szypersrki, C., Component Software: Beyond Object
Oriented Programming, Addison-Wesley, 1998.
6. CORBA Component Model RFP, orbos/97-06-12, Revised Submission, February 2000.
7. The FRIENDS project, see http://friends.gigaport.nl/ 8. Logean, X., Dietrich, F., Karamyan, H. and
Koppenhoefer, S., "Run-time Monitoring of Distributed Applications", Proceedings of the IFIP International Conference on Distributed Systems Platforms and Open Distributed Processing (Middleware'98), pp. 459-473, Hudson River Valley, New York, USA, 3-7 April 2000.
9. BEA WebLogic Commerce Server,
http://www.beasys.com/
10. Inprise Application Server,
http://www.inprise.com/appserver/
11. Rackl, G., Lindermeier, M., Rudorfer, M., Süss, B. “MIMO --- An Infrastructure for Monitoring and Managing Distributed Middleware Environments”,
Middleware 2000 --- IFIP/ACM International Conference on Distributed Systems Platforms, volume
1795 of Lecture Notes in Computer Science, pages 71-87. Springer, April 2000.
12. Quartel, D.A.C., M.J. van Sinderen, and L. Ferreira Pires, "A model-based approach to service creation", In: Proceedings of the Seventh IEEE Computer Society Workshop on Future Trends of Distributed Computing Systems, IEEE Computer Society, 1999, pp 102-110. 13. Kon, F., Román, M., Ping Liu, Mao, J., Yamane, T.,
Magalhães, L.C., Campbell, R.H., "Monitoring, Security, and Dynamic Configuration with the dynamicTAO Reflective ORB", IFIP/ACM International Conference on Distributed Systems Platforms and Open Distributed Processing (Middleware'2000). New York. April 3-7, 2000
14. Visual Studio Analyzer Framework,
http://msdn.microsoft.com/library/devprods/vs6/vstudio /vstool2/veconvisualstudioanalyzerconcepts.htm
15. Monsouri-Samani, M., Sloman M., "Monitoring Distributed Systems", Chapter 12 of "Network and Distributed Systems Management", pp 303-344, Addison Wesley, 1994