A numerical optimization of high altitude testing
facility for wind tunnel experiments
Bruce Ralphin Rose J
a,*, Jinu GR
b, Brindha CJ
ca
Department of Aeronautical Engineering, Regional Centre of Anna University, Tirunelveli 627007, India bDepartment of Mechanical Engineering, University College of Engineering, Nagercoil 629004, India c
Department of Aeronautical Engineering, The Raajas Engineering College, Vadakkankulam 627165, India Received 1 June 2014; revised 24 December 2014; accepted 21 January 2015
Available online 20 April 2015
KEYWORDS
CFD;
Enclosed free-jet section; Ground testing;
High altitude testing (HAT) facility;
Optimization
Abstract High altitude test facilities are required to test the high area ratio nozzles operating at the upper stages of rocket in the nozzle full flow conditions. It is typically achieved by creating the ambient pressure equal or less than the nozzle exit pressure. On average, air/GN2is used as active gas for ejector system that is stored in the high pressure cylinders. The wind tunnel facilities are used for conducting aerodynamic simulation experiments at/under various flow velocities and operating conditions. However, constructing both of these facilities require more laboratory space and expen-sive instruments. Because of this demerit, a novel scheme is implemented for conducting wind tun-nel experiments by using the existing infrastructure available in the high altitude testing (HAT) facility. This article presents the details about the methods implemented for suitably modifying the sub-scale HAT facility to conduct wind tunnel experiments. Hence, the design of nozzle for required area ratioA/A*, realization of test section and the optimized configuration are focused in the present analysis. Specific insights into various rocket models including high thrust cryogenic engines and their holding mechanisms to conduct wind tunnel experiments in the HAT facility are analyzed. A detailed CFD analysis is done to propose this conversion without affecting the existing functional requirements of the HAT facility.
ª2015 The Authors. Production and hosting by Elsevier Ltd. on behalf of CSAA & BUAA. This is an open access article under the CC BY-NC-ND license (http://creativecommons.org/licenses/by-nc-nd/4.0/).
1. Introduction
In spite of its extended use in computational methods for aero-dynamic design, ground testing is one of the highly inevitable methodologies.1 Computational fluid dynamics (CFD) has been evolved as an important tool in the design and analysis of aerospace engine ground tests.2In the aerospace domain, before rocket propulsion systems are put into operational use, they are subjected to several different types of test facili-ties.3 Among that, high altitude testing (HAT) facility for
rocket engines offers the greatest advantage in the ground
* Corresponding author. Tel.: +91 97862 55311.
E-mail address:[email protected](J Bruce Ralphin Rose). Peer review under responsibility of Editorial Committee of CJA.
Production and hosting by Elsevier
Chinese Society of Aeronautics and Astronautics
& Beihang University
Chinese Journal of Aeronautics
www.sciencedirect.com
http://dx.doi.org/10.1016/j.cja.2015.04.018
1000-9361ª2015 The Authors. Production and hosting by Elsevier Ltd. on behalf of CSAA & BUAA. This is an open access article under the CC BY-NC-ND license (http://creativecommons.org/licenses/by-nc-nd/4.0/).
testing of aerospace engines.2 Upper stage rocket engines designed for operating at high altitudes need a nozzle with large expansion ratio for the effective utilization of engine pressure. If the nozzles are tested under sea-level conditions then the flow separates near the nozzle wall. In order to eval-uate the performance of such engines, sufficient low pressure environment has to be simulated in testing installations during testing. The main objective of conducting the high altitude testing is to test the engine under the conditions of nozzle full flow by creating ambient pressure or less than the nozzle exit pressure.4
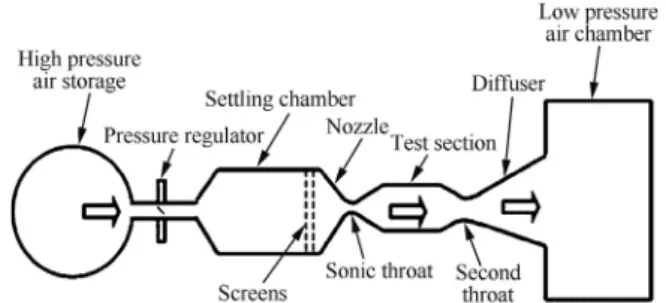
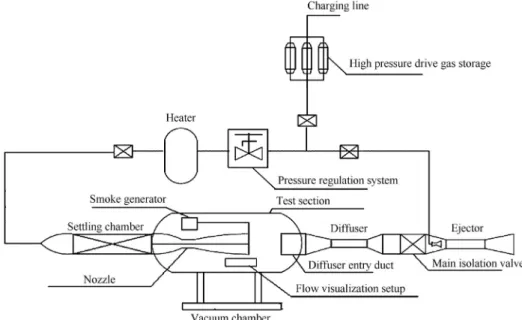
The subsystems of a typical HAT facility are shown inFig. 1. The HAT system comprises of a vacuum test chamber that iso-lates the rocket motor from the outside atmosphere and enables the measurement of full motor thrust by simulating the high-altitude environment. The vacuum system consists of a vacuum chamber and vacuum pumping circuit. Typically, the test article is mounted in the vacuum chamber through proper support sys-tems. Vacuum pumps are used to create vacuum inside the chamber and diffuser cavity. It is followed by a second throat diffuser for maximum pressure recovery that converts the kinetic energy of the engine plume into pressure energy. A spray cooler is used to cool the exhaust gas and an isolation valve that completely isolates the ejector system from the rest of the HAT facility. External ejector system consists of high pressure cylin-ders, flow components, convergent-divergent nozzle and ejector shroud. Before starting the motor, ejector system is operated only to create a desired low pressure environment in the test chamber. As it is known that the GN2is required to drive the ejector and cluster nozzle configuration is preferred for the external ejector system. The key advantage of this configuration is higher active–passive shear area when compared to single nozzle configurations.5,6
Relative to HAT facility, wind tunnels also represent a major focus of aerospace engineering curricula.7 Nowadays many space research organizations use wind tunnels to do the flow experiments on spacecraft and rockets. Although these vehicles are intended to operate in space, they should pass through the atmosphere for entering into space. Vehicles that transmit humans into space should return through the atmosphere during entry. As the rockets, re-entry vehicles and space shuttles are operated at high Mach numbers, they are usually tested in the supersonic/hypersonic wind tunnels. The aerodynamic efficiency and drag character-istics of the rocket vehicle models are confirmed by wind tun-nel experiments. Once the initial design is over, the sub-scale models of rockets and space shuttles are tested in wind tunnels to improve the safety and performance measures. Even though complete simulation of free flight is not achieved, valuable design information can be obtained through wind tunnel testing.8
One of the most important and useful needs of a wind tun-nel is the simulation of rocket exhaust plumes for aerospace engineering applications.9–12If the test section speed is more than 650 km/h then the tunnel is categorized as high speed wind tunnels (HSWT). Because of the high power require-ments, HSWT are often of intermittent type in which the energy is stored as pressure or vacuum or both, and is allowed to drive the tunnel only for few seconds out of each pumping hour.13Most of the techniques developed for supersonic wind
tunnel design are equally applicable to hypersonic wind tun-nels. For economical and practical reasons, the majority of intermittent supersonic/hypersonic wind tunnels is a combina-tion of blow down and succombina-tion type tunnels.13Essential fea-tures of intermittent combined blow down and suction type wind tunnels are schematically shown inFig. 2.
In general, a heater and thermal equalizer in the supply sec-tions and an after cooler at the downstream of the diffuser are required for a hypersonic tunnel in addition to the components of supersonic tunnels. In HSWT, one of the important ele-ments is the heating system because of the minimum required temperature. It is determined by the air saturation point that increases rapidly with the Mach number. Despite the inherent limitation to fixed Mach number, axisymmetric nozzles must replace conventional two-dimensional nozzles for the high Mach number range.14The diffuser of the tunnel is connected
to a quick opening valve which discharges into a vacuum tank. The second throat is used to stabilize the flow in the test sec-tion region. Its main objective is to choke the flow at a locasec-tion downstream of the test section to effectively freeze the flow in the test section.15
After each run the vacuum tank is evacuated by vacuum pumps and the air is compressed, dried, and sent into the high pressure system. If the weight flow available is much larger than the weight flow required for the high Mach number test, then an air ejector is used in place of a vacuum tank.16The objectives and scope of the present analysis are summarized as follows:
(1) High altitude testing facility is essential for the ground testing of rocket engines. Comparatively, wind tunnel facility has several advantages in connection with the flow simulation of rocket models and space shuttles to improve the initial design and safety. Regarding both of these facilities, they are well known for efficient purposes.
(2) The cost of constructing and operating a HSWT leads to further capital investment and also requires more labora-tory space. Because of these unfavorable circumstances, a
Fig. 1 Schematic diagram of HAT facility.
Fig. 2 Intermittent combined blow down and suction wind tunnel.
novel scheme is implemented for modifying the existing HAT facility to conduct wind tunnel experiments without affecting its functional requirements.
(3) This article gives an apparent view about the method to be implemented for the modification of HAT facility without affecting the existing infrastructure. Detailed computational study is conducted using CFD tools for the optimized configuration.
(4) A sample wind tunnel model testing is carried out in the modified sub-scale HAT facility layout to ensure the fea-sibility of the investigation.
2. Optimized configuration design methodology
The optimization sequence for customizing the HAT facility to conduct high speed wind tunnel testing is presented in the fol-lowing flow chart (seeFig. 3). In the modified HAT facility, few components such as storage tanks, heater section, pressure regulation system and settling chamber specifications must be identified based on the test section Mach number.
2.1. Design of nozzle as per the desired flow regime
Supersonic and hypersonic wind tunnel nozzles are classified into several types based on the necessary area ratioA/A*.The most useful and common type of nozzle is axisymmetric one with circular cross section at every station. Therefore, in sub-scale HAT facility modification process supersonic axisymmet-ric nozzles are preferred. A single flexible plate-nozzle produces various flow speeds along the test section. Although the goal of contour design is to deliver a perfectly uniform flow, the follow-ing conditions are proposed as sufficient. If a nozzle contour exists at the inlet station then it delivers uniform continuum flow, steady inviscid flow, isentropic axisymmetric flow and uniform entrance flows.17The rocket nozzle in the HAT facility
will be replaced by the designed supersonic contour nozzle. Parameters that influence the shape of the contour include nozzle length, diameter, inflection angle, and specifications made for the various boundary conditions, particularly along the nozzle centerline for some design techniques. The essential design is that specification of a uniform nozzle exit flow at some Mach number along with a centerline Mach number distribution.17
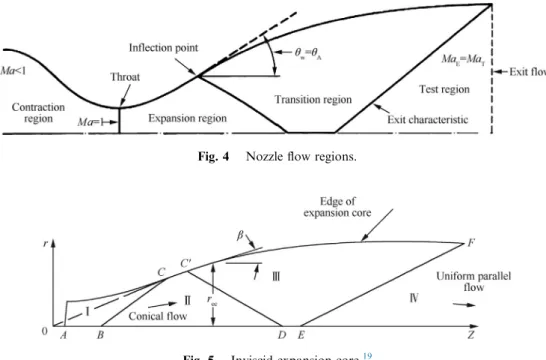
In a supersonic wind tunnel nozzle, totally four aerody-namic regions are present as depicted inFig. 4. The contrac-tion seccontrac-tion lies between the supply seccontrac-tion and the nozzle
throat. In this region, the flow is accelerated from subsonic speed to the speed of sound at the throat section. The expan-sion region lies the downstream of the throat and extends up to the point on the wall where the maximum wall angle is reached. At this point, the flow is expanded from sonic condi-tion to supersonic speeds. The wall point corresponding to this maximum wall angle is sometimes called the point of inflec-tion. Downstream of the expansion region is the transition region and the flow is straightened here to become uniform and parallel flow. The design Mach number of the flow is reached at the exit characteristic line. The last region is known as the test region. Wall coordinates of the first, second, and third regions form a perfect fluid contour. In order to achieve uniform and parallel flow at the design Mach number in the test region of a wind tunnel, the nozzle wall should be aerody-namically contoured.18
2.1.1. Nozzle design using method of characteristics (MOC) A converging–diverging (C–D) nozzle consists of a subsonic and a supersonic segment. Method of characteristics for an axisymmetric flow investigates the flow behavior of the super-sonic part from the subsuper-sonic part or region. The assumption of conical source flow has obvious advantages in the supersonic part. First, the calculation of the expansion region coordinates is reduced to the problem of relating a monotonic curve to match the throat geometry. Fig. 5shows the curves that are used as expansion curves to represent the shock waves, the details can be seen from Ref.19Secondly, the expansion angle
is specified as a design parameter.
The contour of contraction region should be a continuous curve, preferably designed according to potential theory to attain uniform flow at the throat. The contour should provide rapid acceleration of the flow while approaching the throat in order to avoid excessive boundary layer growth. In practice, the design criteria for a satisfactory contraction contour are summarized as follows:
(1) A large contraction ratio between inlet and the throat must be provided. It reduces the turbulence level and makes the flow smooth.
(2) A smooth and continuous curvature at the throat is essential.
From the above design considerations, an arbitrary curve preserving continuity at the throat serves as a contraction con-tour.18 The following steps are involved to generate design
data for the aerodynamic nozzle during the initial design pro-cess: (A) formulation of compatibility equations; (B) dis-cretization of compatibility equations and (C) solving the numerically discretized equations. In addition, compatibility equations are derived from the basic governing equations for steady, adiabatic and axisymmetric flows. The derived compat-ibility equation for the running characteristics is given by dð/hÞ ¼ ffiffiffiffiffiffiffiffiffiffiffiffiffiffiffiffiffiffi1 Ma21 p coth dr r ð1Þ dy dx¼tanððhþlÞÞ ð2Þ
where h is the expansion angle, l the Mach angle, / the Prandtl–Meyer function. Eqs. (1) and (2) represent the Fig. 3 Optimization sequence for customizing the HAT facility
characteristic and compatibility equations, respectively. Both are valid on upward characteristics (K) and downward char-acteristics (K+) that illustrate the disparity of the flow prop-erties along the Mach lines.20
It is convenient to use the cylindrical coordinate system (z,r,h) for axi-symmetric flows. The scalar form of Euler’s equations of motion can be expressed in the form
u
@u @zþ
v
@u @r¼
1 q @p @zu
@v @zþ
v
@v @r¼
1 q @p @r(
ð3Þwhere u andv are the axial and radial velocity components respectively;pis the local stagnation pressure,qthe stagnation density. For isentropic conditions, the terms on the right hand side of Eq.(3)become
@p @z
¼
a
2@q @z @p @r¼
a
2@q @r(
ð4Þwhere a is the speed of sound. The continuity equation for compressible steady flow in cylindrical coordinates is repre-sented as @ðquÞ @z þ @ðqvÞ @r þ qv r ¼0 ð5Þ
This allows the introduction of velocity potentials /z¼@/ @z¼u /r¼ @/ @r¼v /zr¼/rz 8 > < > : ð6Þ
By combining Eqs.(3)–(6), the partial differential equation (PDE) for axi-symmetric, supersonic, irrotational, isentropic and steady flow is obtained.
ða2/2 zÞ/zz2/z/r/zrþ a 2/2 r /rrþa 2 r /r¼0 ð7Þ
Substitution ofA,B,CandDfor the coefficients in Eq.(7) gives:
A/zzþ2B/zrþC/rr¼D ð8Þ
Eq.(8)is a nonlinear second order PDE with two independent variables, and it is sometimes called quasi-linear differential equation. The solutions of Eq. (8) consist of three types depending on the signs of the quantityB2A C.
(1) Hyperbolic type:B2A C >0 (2) Parabolic type:B2A C¼0 (3) Elliptic type:B2AC<0 .
In supersonic steady flow such as in Eq.(7), the equation is of hyperbolic type. This hyperbolic differential equation can be solved by the well-known method of characteristics approach. The design method of contraction contour allows flexibility for selecting the nozzle design parameters.21These parameters
are:
(1) Test section Mach numberMaT. (2) Nozzle expansion anglehA.
(3) Length of partial cancelation regionb. (4) Specific heat ratioc.
In general, the axisymmetric supersonic isentropic flow Mach number is associated with the expansion angle that equals one-half of the value of Prandtl–Meyer expansion angle. The Prandtl–Meyer function expressed as
/¼ ffiffiffiffiffiffiffiffiffiffiffi cþ1 c1 s tan1 ffiffiffiffiffiffiffiffiffiffiffi c1 cþ1 s ffiffiffiffiffiffiffiffiffiffiffiffiffiffiffiffiffiffi Ma21 p tan1pffiffiffiffiffiffiffiffiffiffiffiffiffiffiffiffiffiffiMa21 ð9Þ A continuous gradient of the Prandtl–Meyer angle confirms that the curvature is incessant along the nozzle axis. The new Mach number is estimated by relating the Prandtl–Meyer func-tion. The wall contour slope is gradually straightened until it Fig. 4 Nozzle flow regions.
becomes parallel to the flow subsequent to the expansion sec-tion design. New Mach lines in this region are calculated by means of the steps that have been followed earlier. The final nozzle contour is attained by solving the compatibility equa-tions numerically.18
The MOC technique analyzes the contour within the required boundary conditions based on the nozzle design prob-lem. Fig. 6 presents the nozzle coordinates curve for MaE= 2.5 with an area ratioA/A*of 2.594. Based on the nec-essary data, the design of 2-D axisymmetric contour is numer-ically solved for inviscid flow with perfect gas assumption. The nozzle curvature is designed by an unlimited number of con-tours based on the specific boundary conditions. The throat diameter is calculated from the isentropic relation for area ratio given by A A 2 ¼ 1 Ma2 E 2 cþ1 1þ c1 2 Ma 2 E cþ1 c1 ð10Þ Depending on the throat diameter and the boundary condi-tions, the throat characteristic permits the characteristic solu-tion to filling in the entire supersonic domain and scatters the contour design to wrap the entire length from throat to exit.17It is found that the manual computation of axisymmet-ric perfect fluid contours using the approach mentioned in Ref.18is a most laborious task. The procedure is readily pro-grammed using the computer routine and the nozzle coordi-nates are obtained easily.
2.1.2. Ideal flow in supersonic wind tunnel (starting the tunnel) The ratio of second throat area to test section area in terms of the Mach number downstream of the shock is calculated with A1 A2 ¼Ma1 Ma2 1þ ðc½ 1Þ=2Ma 2 2 1þ ½ðc1Þ=2Ma2 1 ð11Þ The flow Mach number downstream of the shock is related to the upstream Mach number by
Ma2 2¼ 2=ðc1Þ þMa2 1 2cMa2 1ðc1Þ 1 ð12Þ By combining the above two equations and substituting c= 1.4 yields: A2 AT ¼ 5þMa 2 T 0:5 7Ma2 T1 2:5 216Ma2 T ð13Þ whereA2 equals second throat area,ATthe test section area.
Once the wind tunnel is started, the Mach number in the second throat corresponding to the isentropic flow is obtained by using the area ratios from Eq.(13). The requirement of the tunnel is to start results in a fixed second throat that is consid-erably larger Mach number close to unity during running. As the test section Mach number is 2.5 and the second throat is customized for starting, its Mach number is 1.98. Similarly, throughout the Mach range the second throat permits starting with little supersonic diffusing.22
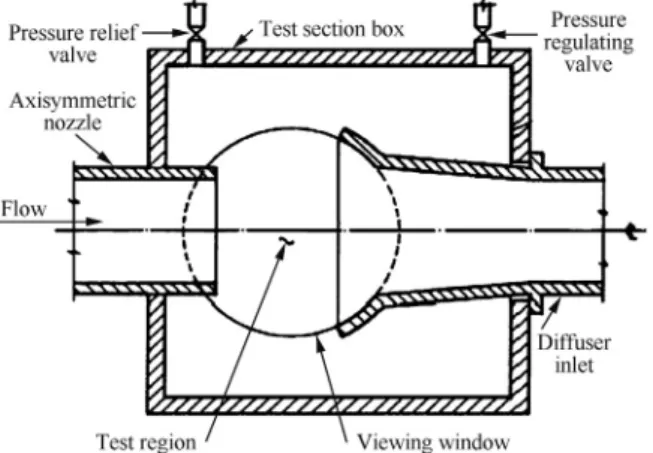
2.2. Realization of test section
The test section is realized by modifying the vacuum chamber in HAT facility without affecting the functional require-ments.23 Based on the configuration of vacuum chamber, enclosed free-jet test section is taken into consideration. In this configuration, only the rocket nozzle is replaced by the wind tunnel axisymmetric nozzle of Mach number 2.5. The nozzle and diffuser entry duct are placed at a particular distance inside the sub-scale HAT facility as shown in Fig. 7. Inside the test section there is more space available for maneuvering the models. Thus, the models can be ejected outside the test region during the tunnel starting and stopping. With a larger test area, the mechanical and structural design of the model support is relatively simple. It also reduces the nozzle flow choking conditions. The starting and running compression pressure ratios are the same and no over- pressure to start the tunnel is required.18,22
2.3. Holding mechanisms
The majority of models in high-speed wind tunnels are sup-ported by means of a string (or) a rod of small diameter extending downstream from the base of the model and aligned with the model axis. The motives for the string- type mounting are twofold. First, the struts extending from the walls of the wind tunnel to the lower surfaces of the model would have major effects on the flow around the model that could not be evaluated. The second is the fortuitous existence of blunt bases to accommodate for the high speeds. With these blunt bases, the model is supported by string without any alteration of model contour.22
2.4. Diffuser and ejector system
The diffuser and ejector system itself in the HAT facility is uti-lized for wind tunnel experiments and no modifications are incorporated. C–D diffusers are commonly used for supersonic wind tunnel circuits.24 Such configurations provide the best pressure recovery and stability in the test section flow because the shock system in the diffuser can be located near the second throat region. A more effective diffuser is the conical fixed-diffuser. A gradually converging cone is followed by a straight section of approximately 2–10 diameters in length. This section is followed by a diverging section as illustrated in Fig. 8. By means of this configuration, a fixed second throat is provided.
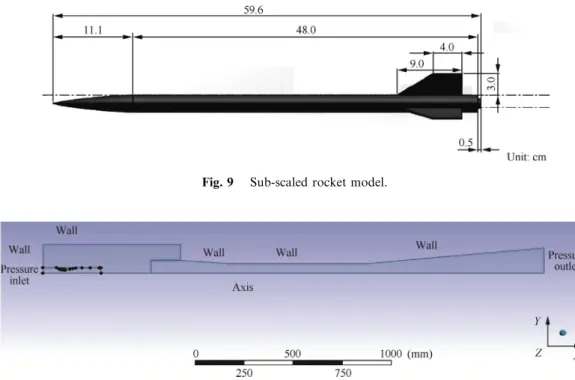
The primary consideration in the design of test section is to ensure the model length that is not limited by the length of the uniform flow position of the nozzle. To analyze the aerody-namic properties of the rocket in a better way, the wind tunnels are utilized. It provides a more accurate result for rocket centre of pressure coefficient Cp and drag coefficient CD as well as
other aerodynamic properties.25 Fig. 9 shows a sub-scale rocket model used for the wind tunnel simulation in the pre-sent work.
Ejector system in the HAT facility acts as low pressure reser-voir while the wind tunnel experiments are carried out. Moreover, ejectors are widely used in the high speed wind tun-nels and high pressure ratios are achieved by ejecting the exit pressurepebelow atmosphere. It consists of a supply of primary gas, a throttling valve and a supersonic nozzle or group of noz-zles. The major advantage in the use of ejectors is the variability ofpeand the common gas for the primary flow is steam or com-pressed air.26 Commonly, the ejector is placed in the down-stream part of the diffuser. The number of ejector nozzles required is related to the Mach number range of operation. Always, multiple nozzle configurations improve the down-stream mixing as well as the control characteristics of the system.8,25
3. Numerical flow analysis of the optimized configuration 3.1. Nozzle-diffuser system
The performance of diffuser configuration is essential in terms of pressure recovering ability and to maintain a well- behaved test section flow.27In the absence of subscale tests, numerical flow simulation is the only option available for predicting the diffuser performance. Diffuser flow simulations are carried out for various sub-atmospheric back- pressures ranging from 4000, 5000, 6700, 7500 Pa under the given stagnation condi-tions.24The flow simulation outputs details of the
nozzle–dif-fuser system is utilized for evaluating the performance of diffuser. Numerical Analysis is done with the help of ANSYS 14.5 Workbench tools (Fluent Module).
The governing equations of the flow physics are derived from Navier–Stokes equations for axisymmetric, compressible and turbulent flows. In CFD, Navier–Stokes equations include the equations for conservation of mass, energy and momen-tum. An appropriate k–e (k–Epsilon) model applicable for Reynolds flow is applied as a turbulence model. Pressure boundary conditions are imposed at the inlet (nozzle entry) and at the pressure outlet (diffuser exit). If the exit flow is sub-sonic then the solver uses the imposed outlet pressure. The Boundary conditions of a typical axisymmetric nozzle–diffuser system is highlighted inFig. 10. The stagnation temperature and pressure values at the nozzle inlet and diffuser exit are listed inTable 1.
The computational domain is discretized using triangular and quadrilateral elements and the mesh/elements near the walls are well refined when compared to other regions. Regarding convergence, the iterations endure till the mass flow imbalance occurs between the inlet and exit of the nozzle-diffuser system. The residual convergence of 106is obtained from the numerical simulation for continuity, momentum and energy.
3.2. Modified HAT facility
In the modified HAT facility environment, wind tunnel flow simulation is done for two different cases, (i.e.,) without the presence of a model (test specimen) and with model. The initial CFD predictions support for fixing up the measurement points for velocity and pressure measurements in all directions. In addition to that, the CFD simulation provides better under-standing of the test section flow pattern around the models. The computational domain is discretized using quadrilateral elements and the mesh/elements near the walls are clustered because of inflation as illustrated inFig. 11. Pressure boundary conditions are imposed at the inlet (nozzle entry) and pressure outlet (ejector outlet) is exposed to atmospheric pressure.28 The physical flow properties in the nozzle to ejector portion are studied numerically to customize the HAT environment for cost-effective high speed flow analysis.
3.3. Case 1 (without model)
In the first case, the CFD analysis is done to simulate the flow conditions in the modified HAT facility, without any model in the test section for Wind tunnel calibration. The velocity distri-bution computed for the entire wind tunnel working section is presented in Fig. 12. At this point, the preferred operating Mach number range in the test section is assumed from 2.5 to 3.0. The nozzle flow from the inlet is a subsonic flow which is then choked at the nozzle throat, and it will continue to accelerate to higher supersonic mach numbers progressively. Further increase in flow pressure leads to the formation of oblique shock waves at the nozzle exit.
The flow entering the test chamber from the nozzle exit con-tracts slightly during its passage through the test section because of mixing of the flow. Oblique shock waves exist in the supersonic portion of the flow and are terminated by a nor-mal shock upstream of the diffuser throat. Very thick bound-ary layer exists between the supersonic flow and the walls of the contraction section of the diffuser.21,22In ejector, the flow
starts from the cluster nozzle exit that remains supersonic up to downstream of the ejector throat.
From the flow pressure contour configuration illustrated in Fig. 13, the pressure at the diffuser exit influences the pressure in the test section through the upstream flow in the thick boundary layer. Increase in total pressure of the flow causes the normal shock to move downstream, as the result test sec-tion pressure decreases.22 However, theMa> 1.3 is attained with 1 atmospheric pressure input by the modified flow setup as indicated in Fig. 12. The absolute pressure magnitude decreases severely at the ejector entry section as similar to induction type wind tunnels.
Turbulence fluctuations and their energy level details at dif-ferent sections of the domain are obtained from Fig. 14. Computation of Reynolds stresses using the Navier–Stokes equation is a starting point for turbulence kinetic energy or fluctuating kinetic energy prediction. The fluctuating kinetic energy for constant density flows is attained directly from the Reynolds stresses. The red colored region indicates the regions that are subjected to high turbulence kinetic energy with reasonably low Mach number. The turbulence kinetic Fig. 9 Sub-scaled rocket model.
Fig. 10 Geometry of nozzle-diffuser system sketched in design modeler (ANSYS 14.5).
Table 1 Initial boundary conditions.
Boundary condition Value
Pressure inlet (bar) 8.5
Pressure outlet (bar) 0.40, 0.50, 0.67, 0.75 Ejector nozzle inlet (bar) 25
Wall No slip and adiabatic conditions
Axis Nozzle centre line
Temperature (K) 300
Working fluid GN2
Note: 1 bar = 105Pa.
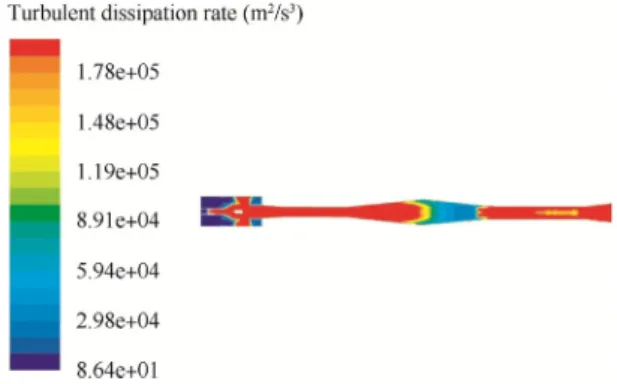
energy provides a framework for understanding the dynamics of turbulent motion and turbulence modeling. At the low pres-sure region, the kinetic energy decreases rapidly as indicated by the shaded blue color inFig. 14. It is a well-known fact that the kinetic energy of the turbulent flow has a distinct role to play in the overall energy balance.29The kinetic energy for the fluc-tuating motion causes a negative rate of change of kinetic energy traditionally known as dissipation. Energy is dissipated because of the work done by the fluctuating viscous stresses in resisting deformation of the fluid substance. The near wall shear stress is another source for turbulence dissipation rate by the fluctuating strain rates as displayed by red in color in Fig. 15. But near the spray cooler portion (blue shaded) of the diffuser-ejector system, the dissipation rate is kept in min-imum as it is expected in a physical system. The dissipation of turbulence energy typically takes place at the smallest turbu-lence scales.29 Further, it occurs gradually (no rapid change
in colors at a specific point) across the low absolute pressure points in the diffuser to stabilize the entire flow Mach number distributions.
3.4. Case 2 (with model)
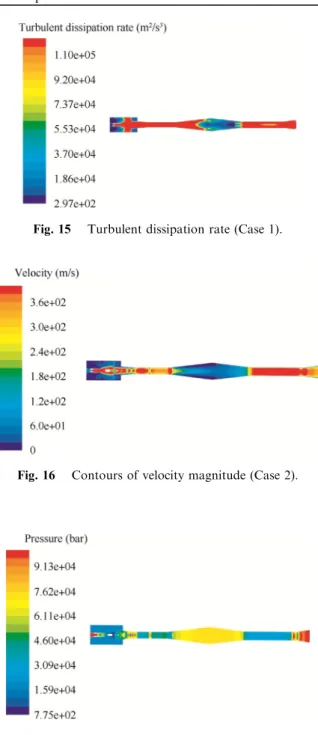
In the second case, a sub-scale launch vehicle model26is placed inside the enclosed free-jet test section between the nozzle exit and diffuser entry duct ath= 0. At this point, the test model inclusion helps to predict the qualitative as well as quantitative information on velocity and pressure measurements. The velocity and pressure contours are illustrated byFigs. 16 and 17, respectively.
The given sub-scaled rocket model is placed at an angle h= 0 in the test section. For a given wedge angleh, when
Ma1 is high enough, an attached shock wave is formed at the nose cone. As Ma1 decreases, the shock angle also increases; with further decrease in Mach number, a value is reached for which the conditions after the shock are subsonic. Because of this reason a detached shock wave is formed as a bow shock. The strength of the detached shock is high near the stagnation streamline, where it is typically approximated as a normal shock. Then, its strength decreases continuously by becoming oblique until it becomes a Mach line far away from the object.25The velocity and absolute pressure
magni-tudes at the test section physically suggest the higher upstream Mach number through expansion waves. This numerical simu-lation of modified HAT facility has revealed the identical flow field characteristics of the supersonic wind tunnel model testing.
Fig. 13 Contour of absolute pressure at 1 bar (Case 1).
Fig. 14 Turbulent kinetic energy (Case 1).
Fig. 15 Turbulent dissipation rate (Case 1).
Fig. 16 Contours of velocity magnitude (Case 2).
The flow from the nozzle inlet is a subsonic flow which is then choked at the nozzle throat and it continues to accelerate progressively to higher supersonic Mach numbers. Further increase in flow pressure leads to formation of oblique shocks in nozzle exit. The flow entering the test chamber from the noz-zle exit contracts slightly during its passage through the test section because of mixing of the flow. Oblique shock waves exist in the supersonic portion of the flow and are terminated by a normal shock upstream of the diffuser throat. A thick boundary layer exists between the supersonic flow and the walls of the contraction section of the diffuser. The reason for variable pressure gradients across the test section can be summarized as follows:
(1) In ejector, the flow starts from the cluster nozzle exit which remains supersonic up to downstream of the ejec-tor throat.
(2) The pressure at the diffuser exit influences the pressure in the test section through the flow upstream in the thick boundary layer.
(3) Increase in total pressure of the flow causes the normal shock to move downstream, as a result the test section pressure will decrease.
The reduction of turbulence intensity across the free-jet test section area is an essential requirement for accurate flow com-putations. Flow velocity is sensitive to perturbations and fluc-tuates wildly in time and in space as illustrated inFig. 18. It also contains swirling flow structures with characteristic length, velocity and time scales that are spread over broad ranges. If the turbulence kinetic energy in the test section is huge enough, then it causes adverse transition and the mea-surements such as drag, lift and velocity profiles are inaccurate. Turbulence levels are typically demonstrated using a hot-wire anemometer in the high speed tunnels. It gives measurements of high-frequency fluctuations in the airstream of supersonic wind tunnels that do not take place in free air. Turbulence dissipation rate is computed in the presence of rocket model and the numerical solution is shown inFig. 19. It presents the net rate of change of fluid kinetic energy caused by shock waves in proportion to the aerodynamic heating and friction. The test chamber is considered as the control volume and it allows expressing the net rate of dissipation in terms of physical and thermodynamic variables (e.g., internal energy, temperature, pressure, velocity and density). It can be mea-sured at the inlet and outlet faces of test chamber according to the necessary output.
4. Experimental viability study
A scaled- down HAT facility model is considered to evaluate the performance of an ejector system during no- flow conditions (before starting the rocket motor) before realizing a full-size HAT facility (Ref.3). The cold flow test is mandatory to qualify the ejector system for the selected purpose. A series of numerical simulations is done to find the optimum primary fluid flow rate required to create the desired vacuum level as mentioned in Ref.6. Since, the hot gas test is required for the rocket exhaust flow analysis, energy equation is enabled by varying the opera-tional conditions from no-flow to full flow conditions. For a fixed geometric configuration, the ejector system alone is assumed to create the desired low pressure environment corre-sponding to the test conditions. Apart from the engine thrust, static pressure and static temperature of the exhaust gas are measured at different locations along the HAT facility.5CFD simulations are carried out under the conditions of p0= 8.4 bar,T0= 298 K,AE/AT= 2.599 andMaE= 2.48.
The experimental setup of sub-scale HAT facility with the suction chamber configuration and modified enclosed free-jet test section is presented in Ref.6. It is an intermittent blow-down type with test duration of 30 s, designed to measure forces, moments, and both steady and unsteady pressures. In the present numerical study, a supersonic jet Mach number of 2.48 is injected upright into the main stream with Mach number 2.98, with a jet pressure ratio (JPR) of 2.45, from the nose cone of the sounding rocket. The rocket engine is fre-quently interested in aerodynamic data from near zero velocity to the maximum velocity of the rocket. Wind tunnel tests must be made over the entire angle range using a series of string mounts.30 Schieliren and oil flow visualizations can be used to predict the nature of flow field at maximum velocity condi-tions. Schieliren system for high-speed tunnels is often designed for passing the light through the test-section two times using a ‘‘double-pass’’ system. It is accomplished by using a circular arc mirror adjacent to one wall of the test sec-tion and a light source and mirror focal point as close together as possible on the opposite side of the test-section.
The modified HAT facility with a layout of complete exper-imental setup is shown inFig. 20. The geometric design param-eters and dimensions of the system are computed through 1-D flow equations by MATLAB tool box. CFD results of the modified HAT facility provide a clear insight that the setup is feasible to conduct high speed wind tunnel experiments with minor addition of instruments. Especially, the nozzle design Fig. 18 Turbulent kinetic energy (Case 2).
plays a vital role in determining the maximum possible test sec-tion Mach number in the modified experimental setup. In this article, the contoured nozzle produces satisfactory exit velocity downstream of test region. The shock wave propagation caused by the turbulent kinetic energy is also found to be sat-isfactory one to realize the novel design.
5. Results and discussions
5.1. Starting characteristics of nozzle-diffuser geometry The performance of a diffuser is assessed by evaluating its abil-ity to maintain the required test-section mass flow. It should be able to compress supersonic flow to low subsonic flow, and has the talent to recover pressure. Therefore, diffuser flow simula-tion is done for various back-pressurespbranging from 4000, 5000, 6700, 7500 Pa. The diffuser Mach number distributions for different back pressures are shown inFig. 21.
From the Mach number distribution for various back pres-sures ranging from 4000 to 7500 Pa, it is observed that the flow expands as it leaves the nozzle exit area to Mach number about
2.5 until it hits the diffuser entry duct. Once the flow hits the diffuser entry duct it generates compression/shock wave which in turn compresses the high supersonic to low supersonic Mach number.24 At even low back pressures about 4000 Pa, the Mach number distribution is good enough to establish high test section velocities. The flow simulation was repeated several times with different pressure magnitudes to ensure the physical reliability of simulated results.
From the pressure distribution plots (shown inFig. 22, for back pressures in the range of 4000–6000 Pa, the terminal shock moves upstream of the diffuser. The flow traverses through severe terminal shock in the throat when backpressure in the excess of 6000 Pa with resultant pressure rise equal to the respective diffuser back pressure.24
5.2. Starting characteristics of experimental setup of modified HAT facility for wind tunnel calibration
5.2.1. Wind tunnel calibration without model (CFD results) A steep decrease in starting pressure to atmospheric pressure is obtained from the pressure distribution plot illustrated in Fig. 20 Modified layout of complete experimental setup.
Fig. 21 Mach number distribution for back-pressures of 4000, 5000, 6700, 7500 Pa.
Fig. 22 Pressure distribution for back-pressures 4000, 5000, 6700, 7500 Pa.
Fig. 23. Pressure decreases at the space between the nozzle exit and the diffuser entry duct, where the wind tunnel test model is to be placed. As the supersonic flow is obtained at the nozzle exit, the total pressure starts to decrease. Because of the obli-que shock formation in the nozzle exit there is a sudden increase in pressure at the diffuser entry plane. In the conver-gent portion of the ejector, the pressure decreases with a low pressure increase in supersonic nozzle. A normal shock occurs at the downstream of the ejector throat that makes the sub-sonic exit flow velocity.
The nozzle design Mach number distribution about 2.5 is obtained at the exit through the numerical simulation as shown inFig. 24. The operating Mach number range in the test section varies from 2.5 to 3.0. The convergent portion of the diffuser experiences supersonic flow that inevitably generates compression/shock wave, in turn compresses the high super-sonic to low supersuper-sonic Mach number of about 1.4. A normal shock takes place at downstream of the second throat which stabilizes the test section flow.25The supersonic nozzle in the ejector generates supersonic flow until it reaches downstream of the ejector throat.
5.2.2. Wind tunnel calibration with model (CFD results) The incremental pressure distribution over the model creates a shock wave at the wedge shaped body as shown inFig. 25. The sudden increase in pressure is caused by the shock formation on the wedge. Ejector acts as a low pressure reservoir that main-tains the low pressure at the divergent potion. As a shock forms at the downstream of the divergent portion of the ejector, it leads to a low pressure flow exposed to the atmosphere.28
The test section operates at a particular range of Mach number from 2.5 to 3.0 as depicted inFig. 26. This computed Mach number distribution helps to study the influence geomet-ric dimensions of the section on the physical flow properties. The flow entering into the convergent potion of the diffuser is supersonic. The oblique shock waves are formed at the straight throat and a normal shock wave at the downstream of the divergent portion of the diffuser leads to subsonic flow. 5.3. Measurements of turbulence parameters
5.3.1. Case 3 (without model)
The measurements of turbulent level are presented for the modified HAT facility without model and with model in this feasibility study. The considerable flow shift occurs from lam-inar to turbulent flow on the upstream model surface on its
actual location. In this environment, the free stream turbulence level is more than real value as indicated in Fig. 27. Free stream turbulence can change the effective Reynolds number somewhere in the turbulent flow. Because of the small varia-tions in the free stream turbulence, a change in the boundary layer behavior and skin friction is observed. However, the influence of free stream turbulence scale has not been deter-mined completely.
Wind tunnels with equal levels of turbulence can produce different test results because of the variations in their turbu-lence spectra.31 The turbulent dissipation rate is also found Fig. 23 Pressure distribution across the modified HAT facility.
Fig. 24 Mach number distribution across the modified HAT facility.
Fig. 25 Pressure distribution due to the fluid flow over a model.
Fig. 26 Mach number distribution due to the fluid flow over a model.
to be high in the test section as shown inFig. 28. The higher kinetic energy associated with the turbulent boundary layer permits greater penetration into the adverse pressure gradient on the rear half of the model. Therefore, compared to the lam-inar case, separation is delayed, the wake width is substantially reduced and base pressure recovery is improved in this configuration.
5.3.2. Case 4 (with model)
Free-stream turbulence increases the entrainment into the shear layers as the source of turbulence in a wind tunnel. It is divided into two parts (i.e.,) turbulence due to eddies and noise with a correlation between them.31 The turbulence parameters’ plots provide the influence of turbulence on the generation of sound and velocity fluctuations caused by pres-sure waves in a large supersonic wind tunnel. It is found that sound waves have a self-effacing impact on the measured lon-gitudinal turbulence and is essentially generated by eddies on the surface of a body or in its wake. It affects the energy dis-tribution and altering the locations of transition, separation and reattachment as illustrated inFig. 29. The turbulent dissi-pation rate in the presence of test model is obtained as shown in Fig. 30 and it is compared to the ‘‘without model’’ case. There is an enhanced diffusion of organized vorticity, presum-ably affecting eddy-shedding phenomena and base pressures because of the presence of the model. In a wind tunnel, pres-sure waves are generated aerodynamically along the tunnel cir-cuit that is considered as plane sound waves. These pressure waves can enter the test section either from the downstream direction or through the nozzle and thus varying the test conditions.
6. Conclusions
The utilization of HAT facility for conducting wind tunnel experiments leads to a versatile behavior. By implementing this novel scheme, it is not necessary to construct a wind tunnel separately for the high speed flow simulation purposes. Mainly, high altitude testing of rocket engines is conducted few months in a year. The rest of the time it remains idle. During the remaining time, the HAT facility will be utilized for wind tunnel experiments. This article provides a clear view of the optimized configuration methodology. CFD simulation has been done for nozzle-diffuser system for various diffuser back-pressures and for modified HAT facility experimental setup for wind tunnel calibration. In this experimental setup model, the CFD simulation is performed for two cases: with-out model and with a sub-scaled model of rocket launching vehicle. This is to predict the qualitative as well as quantitative information on velocity and pressure measurements. Based on the CFD studies, the flow pattern in wind tunnel simulation is obtained. This modification is first undertaken in 1:12 sub-scale HAT facility without affecting the functional require-ments. In future, high speed wind tunnel experiments can be conducted in a sub-scale HAT facility by slight modifications and with a least expense.
Acknowledgement
The authors express their sincere thanks to Anna University, Tirunelveli Region for the computing resources and Laboratory facilities to carry out this research work successfully. Fig. 27 Turbulent kinetic energy (Case 3).
Fig. 28 Turbulent dissipation rate (Case 3).
Fig. 29 Turbulent kinetic energy (Case 4).
References
1. Matsumoto G, Lu FK, Wilson DR. Development of a subscale supersonic aero propulsion wind tunnel. Report No.: AIAA-1998-2868. 1998.
2. Cooper GK, Phares CG. CFD applications in an aerospace engine test facility. Report No.: AIAA-1990-2003. 1990.
3. Sutton GP, Biblarz O.Rocket propulsion elements. 7th ed. New York: John Wiley & Sons Inc; 2010, p. 711–7.
4. Solfaneli G, DeRose L, Porcu E. A new simulated altitude test facility for space motor tests report No.: AIAA-1982-1149. 1982. 5. Manikanda Kumaran R, Sundrarajan T, Raja Manohar D.
Performance evaluation of second-throat diffuser for a high altitude testing facility.J Propul Power2010;26(2):248–58. 6. Vinse AW, Jegesh DM, Suderson J, Alaguvelu K. Experimental
trials of cluster nozzle supersonic ejector for high altitude testing of cryogenic engine. International conference on computer aided engineering. Madras: Indian Institute of Technology Madras; 2013. p. 1–5.
7. Barlow JB, Nagaraja KS. The wind tunnel, its evolution for aerospace test purposes, perspective for curriculum development.
AIAA 17th aerospace ground testing conference. Nashville: AIAA; 1992. p. 1–15.
8. Dunbar B. What are wind tunnels Internet. Washington, D.C.: NASA; 2014 [cited 2014 Jun 3]. Available from: http://www.na- sa.gov/audience/forstudents/5-8/features/what-are-wind-tunnels-58.html.
9. Schulz RJ, Bauer RC. Rocket plume testing in ground test facilities.J Spacecraft1973;11(1):1–16.
10. Draper JS, Moran JP. Wind tunnel simulation of high altitude rocket plumes.J Spacecraft1978;15(3):129–30.
11. Adams RH. Wind tunnel simulation of rocket vehicles in flight with two-phase-flow rocket plumes.J Spacecraft1967;4(4):518–24. 12. Roberts MM, Voisinet RLP, Hedlund ER, Fiscina C. Extended capabilities for high-altitude reentry simulation in the NSWC hypervelocity wind tunnel. Report No.: AIAA-1984-0412. 1984. 13. Rathakrishnan E. Instrumentation, measurements and
experi-ments in fluids Internet. 2007 May [cited 2014 Jun 3]. Available from:http://www.crcnetbase.com/isbn/9780849307638.
14. Ferrari A, Bogdonoff SM. Design and operation of intermittent supersonic wind tunnels. Report No.: AGARDograph-1. Washington, DC: United States Air Force; 1954.
15. Layukallo T, Nakamura Y. Flow stabilization in a transonic wind tunnel with a second throat.J Aircraft2000;37(6):1033–7. 16. Amiria K, Soltani MR, Haghiri A. Steady flow quality assessment
of a modified transonic wind tunnel.Sci Iran2013;20(3):500–7. 17. Mon KO, Lee C. Optimal design of supersonic nozzle contour for
altitude test facility.J Mech Sci Technol2012;26(8):2589–94. 18. Yu YN. A summary of design techniques for axisymmetric
hypersonic wind tunnels. Report No.: AGARDograph-35. Paris: Advisory Group for Aeronautical Research and Development; 1958.
19. Leith Potter J, Carden WH. Design of axisymmetric contoured nozzles for laminar hypersonic flow. J Spacecraft
1968;5(9):1095–100.
20. Shope FL. Contour design techniques for super/hypersonic wind tunnel nozzles. Report No.: AIAA-2006-3665. 2006.
21. Mitchell RR, Lu FK. Development of supersonic aerodynamic test section using computational modeling. Report No.: AIAA-2009-3573. 2009.
22. Pope A, Goin KL. High speed wind tunnel testing. New York: John Wiley & Sons Inc; 1965, p. 25–45.
23. Otterstattertt MR, Meyer SE, Heister SD, Dambach EM. Design of an altitude-testing facility for lab-scale propulsion devices. Report No.: AIAA-2007-5323. 2007.
24. Pugazenthi RS, Mclntosh AC. Design and performance of a supersonic diffuser for plasma wind tunnel. Word Acad Sci Technol2011;5(8):1254–72.
25. Rathakrishnan E. Gas dynamics. 5th ed. New Delhi: Prentice-Hall of India Learning Private Limited; 2011, p. 110–35. 26. Selvi Rajan S, Santhoshkumar M, Lakshmanan N, Nadaraja Pillai
M, Paramasivam M. CFD analysis and wind tunnel experiment on a typical launch model vehicle. Tamkang J Sci Eng
2009;12(3):223–9.
27. Cattafesta L, Bahr C, Mathew J. Fundamentals of wind-tunnel design. New York: John Wiley & Sons Inc; 2010, p. 120–30. 28. Bruce Ralphin Rose J, Veni Grace J. Performance analysis of
lobed nozzle ejectors for high altitude simulation of rocket engines.Int J Model Simul Sci Comput2014;5(4):1450019. 29. Manshadi MD. The importance of turbulence reduction in
assessment of wind tunnel flow quality. In: Lerner JC, Boldes U, editors. Wind tunnels and experimental fluid dynamics research. Rijeka: InTechOpen Publisher; 2011. p. 261–78. 30. Kumaravel G, Mehta RC, Rathakrishnan E. Three-dimensional
flow visualization studies on a typical sounding rocket model in supersonic flow: visualization of mechanical processes Internet. 2012 [cited 2014 Jun 3]. Available from: http://www.dl.begell-house.com/ru/journals/08456987543b9011,68d84f683cf0d938,1f6b 56ed0abb3000.html.
31. Manshadi MD, Ghorbanian K, Soltani MR. Experimental study on correlation between turbulence and sound in a subsonic wind tunnel.Acta Mech Sin2010;26(4):531–9.
Dr. Bruce Ralphin Rose Jis presently working as an assistant professor in the Department of Aeronautical Engineering at Anna University – Regional Centre, Tirunelveli. He received his B.E. and M.E. degrees with first class & distinction in the field of aeronautical engineering from Anna University, Chennai, India. Then, he also received the Ph.D. degree in the field of aeroelasticity from Anna University, Chennai during October 2014. He has published many journal articles in the recent years in the field of active aeroelastic control. His research areas include aircraft structural optimization, aeroelastic tailoring with advanced composites and metals, and Aircraft design. The goal of his research work is to develop efficient computational tools for integrated synthesis of actively-controlled aircraft. Dr. Bruce Ralphin Rose’s research has been supported by the Anna University, Chennai and Defense Research and Development Organization (DRDO), India.