Transportation
Power Generation
Agriculture
Forestry
Waste Management
Energy Exploration and
Production
Sustainable Development Business Case Report
Downstream Natural Gas
SD Business Case
™
Version 1 • April 2014
Energy Utilization
Residential
Downstream
Natural Gas
Commercial
Industrial
Power Generation
Transportation
Renewable Natural Gas
* Copyright © 2014 by Canada Foundation for Sustainable Development Technology (“SDTC™”).
All Copyright Reserved. Published in Canada by SDTC™. No part of the
SD Business Case
™may be
produced, reproduced, modified, distributed, sold, published, broadcast, retransmitted, communicated
to the public by telecommunication or circulated in any form without the prior written consent of
SDTC, except to the extent that such use is fair dealing for the purpose of research or private study
(unpublished, or an insubstantial copy). To request consent please contact SDTC. All insubstantial
copies for research or private study must include this copyright notice.
The SD Business Case
™is provided “as is” without warranty or representation of any kind.
Use of the information provided in the SD Business Case is at your own risk. SDTC does not
make any representation or warranty as to the quality, accuracy, reliability, completeness,
or timeliness of the information provided in the SD Business Case.
Sustainable Development Technology Canada
™,
SDTC
™,
SD Business Case
™,
SD Natural Gas Fund
™,
and
SDTC STAR
™ are trade marks of Canada Foundation for Sustainable Development Technology.
Sustainable Development Business Case Report
Downstream Natural Gas
SD Business Case
™
Version 1 • April 2014
Energy Utilization
Residential
Downstream
Natural Gas
Commercial
Industrial
Power Generation
Transportation
Renewable Natural Gas
Acknowledgements
SDTC would like to gratefully acknowledge the contribution and assistance provided by the Canadian Gas Association and
its venture, Energy Technology & Innovation Canada, whose management and team have provided valuable insight into
Canada’s natural gas delivery industry.
John Adams
Vice-President, Industry
Table of Contents
1
The SD Natural Gas Fund
™...
11.1
About SDTC
... 1
Figure 1: SDTC Total Portfolio Value Across Canada
... 1
Figure 2: The Companies Delivering Natural Gas
... 2
1.2
About the Canadian Gas Association (CGA)
... 2
2
Executive Summary
...
3
2.1
Downstream Natural Gas Use
... 3
Figure 3: Breakdown of Natural Gas Consumption in Canada, 2012
... 3
2.2
Downstream Natural Gas Vision Statements
... 4
Figure 4: Downstream Natural Gas Vision Statement, GHG Emissions
... 4
Figure 5: GHG Emissions Reductions from the Downstream Natural Gas Vision, by Sub-Sector
... 4
2.3
Investment Priorities
... 5
2.3.1 Near Term Investment Priorities
... 5
Table 1: Near Term High Priority Investments
... 5
Table 2: Near Term Medium Priority Investments
... 5
2.3.2 Long Term Investment Priorities
... 5
Table 3: Long Term High Priority Investments
... 5
Table 4: Long Term Medium Priority Investments
... 5
2.4
Non-technical Priorities
... 6
2.4.1 Integration of Natural Gas and Electricity Provision
... 6
2.4.2 Energy Literacy
... 6
2.4.3 Demonstration Opportunities for New Technologies
... 6
2.4.4 Clarification of Financial and Regulatory Structures
... 6
3
Report Process, Scope and Structure
...
6
3.1
Report Process
... 6
Figure 6: The SDTC STAR™ Process
... 7
Figure 7: SDTC’s Mandate
... 8
3.2
Report Scope
... 8
3.2.1 Downstream Natural Gas Sub-Sectors
... 8
3.3
Structure of Report
... 9
4 Background
...
10
4.1
Natural Gas Use in Canada
... 10
Figure 8: Breakdown of Natural Gas Consumption in Canada, 2012
... 10
Figure 9: Natural Gas Consumption in Canada, PJ, 1995 – 2012
... 11
Figure 10: Natural Gas Consumption by Sector in Canada, PJ, 1995-2012
... 11
Table 5: Increase in Natural Gas Consumption by Sector in Canada, 2012 vs. 1995
... 12
4.2
Projected Natural Gas Use
... 13
Figure 11: Projection of Natural Gas Consumption by Sector in Canada, PJ, 2014-2030
... 13
5
Applicant Technologies for SDTC Funding
...
14
6
Industry Vision
...
16
Figure 13: Downstream Natural Gas Vision Statement, GHG Emissions
... 17
Figure 14: GHG Emissions Reductions from the Downstream Natural Gas Vision, by Sub-Sector
... 17
6.1 Residential
... 19
Figure 15: Residential Sub-Sector Vision Statement, GHG Emissions
... 19
Table 6: General Data and Assumptions Used in the Residential Vision Statement Calculations
... 20
Table 7: Technology Data and Assumptions Used in the Residential Vision Statement Calculations
... 20
6.2 Commercial
... 21
Figure 16: Commercial Sub-Sector Vision Statement, GHG Emissions
... 21
Table 8: General Data and Assumptions Used in the Commercial Vision Statement Calculations
... 22
Table 9: Technology Bin Data and Assumptions Used in the Commercial Vision Statement Calculations
... 22
6.3 Industrial
... 23
Figure 17: Industrial Sub-Sector Vision Statement, GHG Emissions
... 23
Table 10: General Data and Assumptions Used in the Industrial Vision Statement Calculations
... 24
Table 11: Technology Bin Data and Assumptions Used in the Industrial Vision Statement Calculations
... 24
6.4
Power Generation
... 25
Figure 18: Power Generation Sub-Sector Vision Statement, GHG Emissions
... 25
Figure 19: Transportation Sub-Sector Vision Statement, GHG Emissions
... 26
Table 12: Technology Bin Data and Assumptions Used in the Power Generation Vision Statement Calculations
... 26
6.5 Transportation
... 26
Table 13: Market Adoption Assumptions Used in Transportation Vision Calculations
... 27
Table 14: GHG Reductions Associated with Fuel Switching in Transportation Sub-Sectors
... 27
Figure 20: Renewable Natural Gas Sub-Sector Vision Statement, GHG Emissions
... 28
6.6
Renewable Natural Gas
... 28
7
Needs Assessment
...
29
7.1
Technical Needs
... 29
7.1.1 Residential
... 29
7.1.2 Commercial
... 29
7.1.3 Industrial
... 29
7.1.4 Power Generation
... 30
7.1.5 Transportation
... 30
7.1.6 Renewable Natural Gas (RNG)
... 30
7.2
Non-technical Needs
... 31
7.2.1 Cross-Cutting
... 31
7.2.2 Residential
... 31
7.2.3 Commercial
... 31
7.2.4 Industrial
... 31
7.2.5 Power Generation
... 32
7.2.6 Transportation
... 32
7.2.7 Renewable Natural Gas (RNG)
... 32
8
Market Assessment
...
33
Table 15: Rationale for Market Analysis - Key Points
... 33
Figure 21: Market Analysis for the Residential, Commercial and Industrial Sub-Sectors
... 34
9
Technical Needs Assessment
...
35
9.1
Cross-cutting Technology Needs
... 35
9.2 Residential
... 35
Table 16: Residential Technology Summary
... 36
Figure 23: Residential Technology Plot
... 36
9.3 Commercial
... 37
Table 17: Commercial Technology Summary
... 37
Figure 24: Commercial Technology Plot
... 38
9.4 Industrial
... 38
Table 18: Industrial Technology Summary
... 39
Figure 25: Industrial Technology Plot
... 39
9.5
Power Generation
... 40
Table 19: Power Generation Technology Summary
... 41
Figure 26: Power Generation Technology Plot
... 41
9.6 Transportation
... 42
Table 20: Transportation Technology Summary
... 43
Figure 27: Transportation Technology Plot
... 43
9.7
Renewable Natural Gas
... 44
Table 21: Renewable Natural Gas Technology Summary
... 44
Figure 28: Renewable Natural Gas Technology Plot
... 44
10
Investment Priorities
...
45
10.1
Near Term Investment Priorities
... 45
Table 22: Near Term High Priority Investments
... 45
Table 23: Near Term Medium Priority Investments
... 45
10.2
Long Term Investment Priorities
... 45
Table 24: Long Term High Priority Investments
... 45
Table 25: Long Term Medium Priority Investments
... 46
11
National Strategy Impacts
...
47
11.1
Integration of Natural Gas and Electricity Provision
... 47
11.2
Energy Literacy
... 47
11.3
Demonstration Opportunities for New Technologies
... 47
11.4
Clarification of Financial and Regulatory Structures
... 47
12 Acknowledgements
...
48
13 Glossary
...
50
14
Appendix A: Market and Technology Assessment Methodology
...
51
14.1
Market Assessment
... 51
Table 26: Market Plot Indicators
... 51
14.2
Technology Assessment
... 52
Table 27: Market Plot Indicators
... 52
1
The SD Natural Gas Fund
™
Natural gas has a central place in Canada’s energy mix, meeting 30 per cent of the country’s energy needs. Today, over 6.4 million customers representing well over half the Canadian population rely on natural gas for heat and power in homes, apartments, buildings, businesses, hospitals and schools. In 2012, approximately 3,900 PJ (100,000 gigalitres) of natural gas was consumed in Canada. According to the National Energy Board, approximately 5,700 PJ of natural gas will be consumed in Canada in 2030. This represents an increase in consumption of approximately 45% from 2012, with the greatest absolute increases in the power generation and industrial sub-sectors. By the year 2030, commercialization of new technologies in the downstream natural gas sector in Canada will achieve GHG emissions reductions of 30.7 Mt-CO2e
per year from the the business as usual emissions projection.
The SD Natural Gas Fund™ is the result of collaboration between Sustainable Development Technology Canada (SDTC) and the Canadian Gas Association (CGA), through its venture “Energy Technology Innovation Canada” (ETIC), that will see $15 million provided by the CGA and matched by SDTC, creating a fund valued at $30 million over 3 years. The Fund will be managed by SDTC and will support the development and demonstration of new downstream natural gas technologies. The SD Natural Gas Fund™ will invest in technology areas outlined in the Business Case and technologies that are attractive to the international export market. SDTC will accept applications to the Fund twice per year. Successful applicants will be invited to submit a detailed proposal that will be subjected to SDTC’s rigorous due diligence process, with a final funding decision made by SDTC’s Board of Directors. The Fund will support, on average, 33% of overall project costs, subject to the successful completion of project milestones.
The SD Business Case™ for Downstream Natural Gas identifies and prioritizes emerging clean technologies which have, or will have, the highest impact in addressing particular industry needs related to the SD Natural Gas Fund™.
1.1 About SDTC
On behalf of the Government of Canada, Sustainable Development Technology Canada (SDTC) helps move Canadian clean technologies forward, readying them for growth and export markets. With a portfolio of companies under management valued at more than $2 billion, SDTC is demonstrating that cleantech is a driver of jobs, productivity and economic prosperity.
SDTC operates two funds aimed at the development and demonstration of innovative technological solutions. The SD Tech Fund™ supports projects that address © climate change, air quality, clean water, and clean soil. The NextGen Biofuels Fund™ supports the establishment of first-of-kind large demonstration-scale facilities for the production of next-generation renewable fuels.
SDTC works with the private sector, the financial sector and all levels of government to meet the Government of Canada’s commitment to create a healthy environment and a high quality of life for all Canadians. SDTC operates as a not-for-profit corporation.
Figure 1: SDTC Total Portfolio Value Across Canada
$542M $454M $62M $20M $708M $353M $1M $5M $8M $54M
1.2 About the Canadian Gas Association (CGA)
Founded in 1907, the Canadian Gas Association (CGA) is the voice of Canada’s natural gas distribution industry. Its members are distribution companies, transmission companies, equipment manufacturers and other service providers. Today, natural gas meets 30% of Canada’s energy needs and Canadian natural gas distribution companies serve approximately 6.4 million customers – over half of all Canadians in their homes and at work.
The CGA works with industry to:
• Build the understanding of natural gas;
• Advance efficiency and innovation in the energy and economy discourse; • Drive for improved regulatory engagement;
• Ensure continuous improvements in safety and integrity management; and • Pursue partnerships to better deliver energy services to Canadians.
The CGA also develops educational information and organizes training schools, workshops, seminars and conferences. The CGA sponsors and participates in a number of forums, partnerships and coalitions to foster dialogue on energy policy and achieve a better understanding of natural gas.
Figure 2: The Companies Delivering Natural Gas
St. John’s Halifax Fredericton Quebec Montreal Ottawa Toronto Winnipeg Regina Calgary Edmonton Yellowknife Vancouver Victoria Prince George Fort Nelson Whitehorse Inuvik Saskatoon Inukiv Gas Pacific Northerrn Gas (PNG) FortisBC ATCO AltaGas City of
Medicine Hat SaskEnergy Manitoba
Hydro Union Gas
Enbridge Gas Distribution
Enbridge Gas New Brunswick
Heritage Gas
2
Executive Summary
This SD Business Case™ report focuses on impacts of downstream natural gas use in Canada. For the purpose of the analysis, downstream natural gas has been divided into six sub-sectors including:
• Residential • Commercial • Industrial • Power Generation • Transportation
• Renewable Natural Gas (RNG)
The renewable natural gas sub-sector is treated differently than the other sub-sectors, which only include downstream applications. For RNG, the sub-sector also includes production and gas cleanup.
This report does not include an analysis or needs assessment of upstream and midstream natural gas.
2.1 Downstream Natural Gas Use
In 2012, approximately 3,900 PJ (100,000 gigalitres) of natural gas was consumed in Canada1 as per the breakdown below:
Figure 3: Breakdown of Natural Gas Consumption in Canada, 2012
2*
11%
56%
16%
12%
4%
Power Generation
Industrial
Residential
Commercial
Other
According to the National Energy Board, approximately 5,700 PJ of natural gas will be consumed in Canada in 2030. This represents an increase in consumption of approximately 45% from 2012, with the greatest absolute increases in the power generation and industrial sub-sectors†.
2.2 Downstream Natural Gas Vision Statements
The Vision Statement developed for the downstream natural gas sector assesses environmental benefits associated with the commercialization of new technologies within the sector. Technologies taken into consideration include relevant technologies from recent Statements of Interest for SDTC funding, as well as technologies identified by key stakeholders during the STAR™ process.
Greenhouse gas (GHG) and criteria air contaminant (CAC) emissions are the primary environmental impacts associated with the downstream natural gas sector. Therefore, GHG and CAC emissions reductions are the focus of the Vision Statement and have been assessed quantitatively.
Downstream Natural Gas Vision Statement
By the year 2030, commercialization of new technologies in the downstream natural gas sector in Canada will:
• achieve GHG emissions reductions of 30.7 Mt-CO2e per year from the business as usual emissions projection;
• achieve annual CAC emission reductions of 86 kt-NOx, 17 kt-SOx, 3.2 kt-PM, 6.9 kt-VOCs, and 140 kt-CO.
Graphical representations of the Vision Statement are shown below for GHG emissions (CAC emissions follow a similar trend).
Figure 4: Downstream Natural Gas Vision Statement, GHG Emissions
560
580
600
620
640
660
2015
2020
2025
2030
GH
G
Em
iss
io
ns
(M
t C
O₂
-e
q)
Year
Business as Usual
Vision
30 MT Reduction
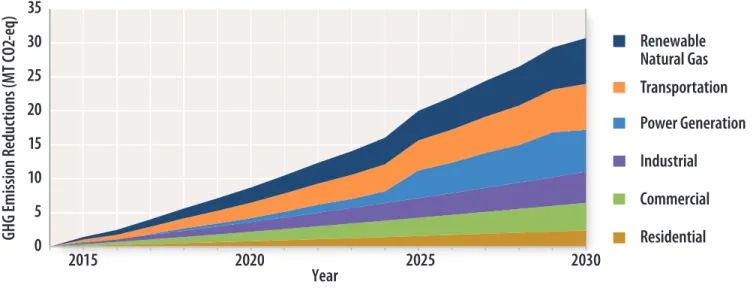
Figure 5: GHG Emissions Reductions from the Downstream Natural Gas Vision, by Sub-Sector
0
5
10
15
20
25
30
35
2015
2020
2025
2030
GH
G
Em
iss
io
n
Re
du
ct
io
ns
(M
T C
O2-eq
)
Year
Residential
Commercial
Industrial
Power Generation
Transportation
Renewable
Natural Gas
2.3 Investment Priorities
Near and long term investment priorities are summarized below based on a technical needs assessment. Needs are also divided by the degree to which they are a priority, both high and medium priority.
2.3.1 Near Term Investment Priorities
Table 1: Near Term High Priority Investments
Sub-Sector Technology Need
Residential Lower capital cost ultra-high efficiency water heaters that improve user experience, integrate with low-flow appliances and meet footprint requirements.
Residential / Commercial Multi-unit sized Heat Pumps that improve the efficiency of heating and/or cooling for larger buildings. Smart Energy Meters/System components and Data Management Solutions.
Commercial Combined Heat and Power (CHP) systems with lower capital cost in order to increase technology penetration in the commercial sector.
Industrial Higher-efficiency industrial heating equipment (process and/or building) with reduced capital cost. Measurement and data management for advanced heating process control.
Power Generation Higher-efficiency natural gas power generation.
Renewable Natural Gas RNG cleanup technologies that improve cleanup economics. Cost-effective small-scale anaerobic digesters.
Table 2: Near Term Medium Priority Investments
Sub-Sector Technology Need
Industrial CHP units for applications that require less heat, or less continuous heat (e.g. increased electricity generation without sacrificing overall efficiency).
Less energy-intensive hydrogen production from natural gas / renewable natural gas.
2.3.2 Long Term Investment Priorities
Table 3: Long Term High Priority Investments
Sub-Sector Technology Need
Power Generation Technologies that focus on the capture of CO2 from natural gas power generation.
Power Generation / Transportation / Industrial Compressed Natural Gas (CNG) and Long-term Liquefied Natural Gas (LNG) Storage. Transportation Next Generation NG Piston Engines (Heavy Duty Vehicles (HDVs), Rail).
Next Generation on-board fuel storage with lower cost.
Renewable Natural Gas Cost-effective gasification technology where produced gas is converted to RNG.
Table 4: Long Term Medium Priority Investments
Sub-Sector Technology Need
Residential Small-scale (single family home) CHP units with reduced capital cost in order to encourage uptake in the residential market.
Industrial CO2 capture systems from industrial natural gas combustion. Transportation Alternative natural gas engine types (e.g. hybridization, NG fuel cells).
Next Generation NG Piston Engines for Light Duty Vehicles (LDVs). Next Generation NG Gas Turbine Engines.
Systems for LDV fuelling at home. Lower-cost and safe fuel dispensing.
2.4 Non-technical Priorities
2.4.1 Integration of Natural Gas and Electricity Provision
Given Canada’s current energy landscape, minimizing the life-cycle environmental impact of energy-use within the residential and commercial sectors would involve the use of a combination of electricity and natural gas by region. However, separate regulation governing electricity and gas provision to the same customer presents a barrier to integrated solutions designed to minimize environmental impact.
2.4.2 Energy Literacy
There is a need for the education of policy makers, stakeholders and consumers with respect to the life-cycle impacts of various power generation alternatives, as well as Canada’s capacity to generate power through various alternatives in the short, medium and long terms. By simultaneously educating key decision makers while building social understanding and acceptance, the goal of energy literacy would be to ensure that energy decisions are made based on the best available information.
Also identified within this broader category is a need for improved education on how products and services use energy. This could empower end-users to make environmentally-based decisions, which could then impact the decisions of suppliers related to efficiency and energy source considerations.
2.4.3 Demonstration Opportunities for New Technologies
Many of the downstream NG sub-sectors are considered risk averse, and even those sub-sectors that may be more receptive to newer technologies look to demonstrated performance prior to adoption. Demonstration opportunities could come in the form of government programs or other methods to incentivize or reward utilities to incubate, install and nurture new technologies.
2.4.4 Clarification of Financial and Regulatory Structures
Adoption of some technologies with significant GHG reduction potentials will be reliant on financial and regulatory structures. Lack of clarity on these structures will have the potential to negatively impact adoption. They include:
• Natural gas taxation as a transportation fuel.
• Clarification from regulators regarding potential GHG emissions regulations.
• How the RNG cost premium will be overcome as RNG is not expected to be cost-competitive with NG in the short and medium term. • CCS requirements for NG electric power generation.
3
Report Process, Scope and Structure
3.1 Report Process
The SDTC STAR™ Tool
The Sustainable Technology Assessment Roadmap (STAR™) is an analytical tool that is used to produce the SD Business Case reports. It is an iterative analytical process that combines data, reports, stakeholder input, and industry intelligence in a common information platform. It uses a series of criteria selection screens to assess and sort relevant information from a variety of sources. The output is an Investment Report that highlights key technology investment opportunities for the sector under study.
The SDTC STAR™ Process: Data Collection and Analysis
The STAR™ process uses a “vision-based, needs-driven” approach: it begins with an industry vision of where the sector is anticipated to be at some defined point in the future, and then identifies the most critical requirements that must be satisfied in order to achieve the stated vision.
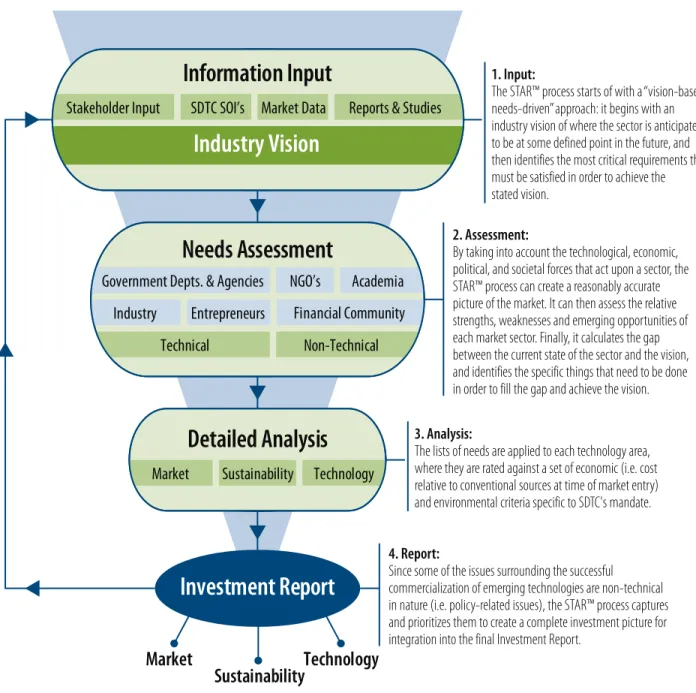
Figure 6: The SDTC STAR™ Process
Industry Vision
SDTC SOI’sStakeholder Input Market Data Reports & Studies
Industry Entrepreneurs Government Depts. & Agencies
Financial Community NGO’s
Needs Assessment
Non-Technical TechnicalInformation Input
Market Sustainability Technology
Detailed Analysis
Market
Sustainability
Technology
Investment Report
Academia 1. Input:The STAR™ process starts of with a “vision-based, needs-driven” approach: it begins with an industry vision of where the sector is anticipated to be at some defined point in the future, and then identifies the most critical requirements that must be satisfied in order to achieve the stated vision.
2. Assessment:
By taking into account the technological, economic, political, and societal forces that act upon a sector, the STAR™ process can create a reasonably accurate picture of the market. It can then assess the relative strengths, weaknesses and emerging opportunities of each market sector. Finally, it calculates the gap between the current state of the sector and the vision, and identifies the specific things that need to be done in order to fill the gap and achieve the vision.
3. Analysis:
The lists of needs are applied to each technology area, where they are rated against a set of economic (i.e. cost relative to conventional sources at time of market entry) and environmental criteria specific to SDTC's mandate.
4. Report:
Since some of the issues surrounding the successful commercialization of emerging technologies are non-technical in nature (i.e. policy-related issues), the STAR™ process captures and prioritizes them to create a complete investment picture for integration into the final Investment Report.
The above process is repeated for each area of study, until a complete picture of the market emerges to the satisfaction of SDTC and the key market stakeholders.
SDTC STAR™ is a trade mark of Canada Foundation for Sustainable Development Technology.
By taking into account the technological, economic, political, and societal forces that act upon a sector, the STAR™ process can create a reasonably accurate picture of the market. It can then assess the relative strengths, weaknesses and emerging opportunities of each market sector. Finally, it calculates the gap between the current state of the sector and the vision, and identifies the specific things that need to be done in order to fill the gap and achieve the vision.
The lists of needs are applied to each technology area, where they are rated against a set of economic (i.e. cost relative to conventional sources at time of market entry) and environmental criteria specific to SDTC’s mandate. Since some of the issues surrounding the successful commercialization of emerging technologies are
non-technical in nature (i.e. policy-related issues), the STAR™ process captures and prioritizes them to create a complete investment picture for integration into the final Investment Report.
The Market Assessment is conducted from the perspective of SDTC’s mandate, which is to support the development and demonstration of emerging sustainable technologies in Canada at critical stages in the development cycle. Specifically, SDTC is focused on those technologies that are between prototype, development and market-ready product stages. The size and span of the blocks in Figure 7 are indicative of the relative timing and amount of funding from various sources.
Figure 7: SDTC’s Mandate
Funding Gaps Industry Industry Governments Banks Investors Angel Pension Funds Project Finance Corporate VC Venture Capital/ Private Equity Public Markets Technology Development and Demonstration(Pilot to Full Scale) Fundamental
Research ResearchApplied
Product Commercialization & Market Development Market Entry and Market Volume
Funding In
tensit
y
SDTC Funds
3.2 Report Scope
This SD Business Case™ report focuses on impacts of downstream natural gas use in Canada. The report does not include an analysis or needs assessment of the upstream or midstream natural gas sectors.
3.2.1 Downstream Natural Gas Sub-Sectors
Downstream natural gas has been divided into six sub-sectors including: • Residential
• Commercial • Industrial • Power Generation • Transportation
• Renewable Natural Gas (RNG)
The renewable natural gas sector is treated differently than the other sub-sectors, which only include downstream applications. For RNG, the sub-sector also includes production and gas cleanup.
3.3 Structure of Report
This report includes eight key sections, including the following:
Background
Details historical natural gas consumption in Canada, as well as future trends and drivers.
Applicant Technologies for SDTC Funding
SDTC solicits Statements of Interest (SOI) from the technology development community for projects that could receive funding. SDTC retains this unique data in their proprietary data base, and it forms a national snapshot of the state of emerging sustainable technologies in the downstream natural gas sector in Canada.
Industry Vision
The Vision Statement developed for the downstream natural gas sector assesses environmental benefits associated with the commercialization of new technologies within the sector. It is important to note that the individual sub-sector Vision Statements are based on input from the industry stakeholders, and in this regard, only serves to compile and interpret stakeholder responses.
Needs Assessment
In order for the vision to be achieved, there are a number of needs that must first be satisfied. Some refer to technological improvements that must be made while others refer to financial, political, or regulatory issues that must be resolved. There are two types of needs, technical (i.e. technology innovation, development and demonstration needs) and non-technical (policy and market needs). This section describes the specific needs of each sub-sector and their relative importance.
Market Assessment
This section focuses on the ability of the market to use the emerging technologies that are currently at the development and demonstration stages. It identifies what needs to be done in order to maximize the application and acceptance of the technology, with a focus on financial and economic performance.
Technology Assessment
This section analyzes priority technology needs that were identified as having the potential to contribute to emission reduction goals as described in the vision. While there are numerous emerging technologies that may contribute to achieving the sub-sector vision, only the priority technologies identified using the criteria in the STAR™ model are considered in this section.
Investment Priorities
This section categorizes priority technologies identified in the Technology Assessment into two types of investment groups that are considered in the SD Business Case: Near Term and Longer Term. They reflect the current stage of development of the various technologies and the expected time and magnitude of potential investment required to bring them to the market.
National Strategy Impacts
This section highlights the most important non-technical needs identified in the STAR™ analysis and proposes concrete policy strategies for enabling the diffusion of the identified sub-sector technology priorities into the Canadian market.
4
Background
4.1 Natural Gas Use in Canada
In 2012, approximately 3,900 PJ (100,000 gigalitres) of natural gas was consumed in Canada.3
Sectors within the Canadian economy that consume natural gas include the following: power generation; the industrial sector (including oil and gas producer consumption)*; the residential sector; the commercial sector; and other categories, such as transportation, agricultural, and pipeline compression. A sectoral breakdown of natural gas consumption in 2012 is shown below in Figure 8.
Figure 8: Breakdown of Natural Gas Consumption in Canada, 2012
4†
11%
56%
16%
12%
4%
Power Generation Industrial Residential Commercial OtherIn 2012, the largest consumer of natural gas was the industrial sector, which consumed approximately 56% of ‘available’‡ natural gas. Within the industrial sector, the oil sands industry was the largest consumer of gas (approximately 40% of industrial consumption).5 The residential sector was the next largest consumer at 16%,
followed by the commercial and power generation sectors at 12% and 11%, respectively. Consumption within the ‘Other’ category is primarily composed of natural gas use in compressors powering gas pipelines. This category also includes consumption within the transportation and agriculture sectors, although these sectors only consumed about 1% of available natural gas.
* The industrial sector includes the manufacturing industry, the oil and gas industry, and gas used to generate electricity. For example, combined heat and power plants that generate electricity for the oil sands industry are included under the industrial sector.
† Power generation includes natural gas transformed to electricity by utilities and natural gas transformed to steam generation.
Natural gas consumption in Canada has increased over the past two decades. From 1995 to 2012, natural gas consumption increased by approximately 25%, as shown in Figure 9.
Figure 9: Natural Gas Consumption in Canada, PJ, 1995 – 2012
3,000 3,100 3,200 3,300 3,400 3,500 3,600 3,700 3,800 3,900 4,000 1995 PJ 2000 2005 2010 Year
The drivers of this trend are best explained through a sector by sector approach. A disaggregation of historical natural gas consumption in Canada by sector is shown in Figure 10.
Figure 10: Natural Gas Consumption by Sector in Canada, PJ, 1995-2012
0 500 1,000 1,500 2,000 2,500 3,000 3,500 4,000 4,500 Year 1995 2000 2005 2010 Residential Commercial Industrial Power Generation Other PJ
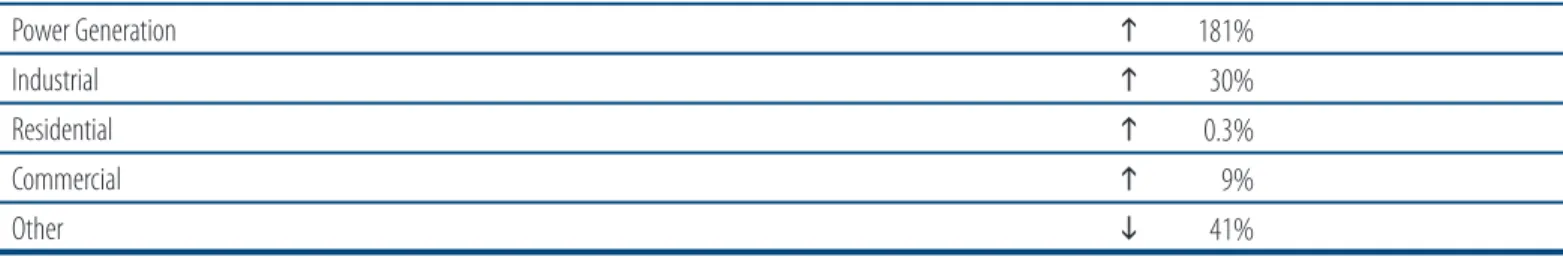
It should be noted that in the figure above, growth in natural gas consumption over the time period varies by sector. Of all sectors, growth in the power generation sector was the greatest, with an increase of approximately 180%. Growth percentages for all sectors are summarized in Table 5.
Table 5: Increase in Natural Gas Consumption by Sector in Canada, 2012 vs. 1995
Sector Relative Change in Consumption, 1995 to 2012
Power Generation 181%
Industrial 30%
Residential 0.3%
Commercial 9%
Other 41%
The primary drivers for increases (or decreases) in natural gas consumption are summarized below on a sectoral basis.
Power Generation
• The increase in natural gas consumption is primarily due to an increase in utilities generating electricity through natural gas combustion. Steam generation was relatively constant over the time period.
• Factors contributing to increased natural gas electricity generation include: lower gas prices; government policy and regulations, such as coal phase out regulations, which supported natural gas as a cleaner electricity generation alternative; and, increasing overall electricity demand.
Industrial
• The increase in natural gas consumption in the industrial sector is closely related to industrial GDP growth. From 1995 to 2012, industrial GDP in Canada grew by approximately 50%.8
• Industrial electricity production through natural gas combustion increased by approximately 245% from 1995 to 2012. This was primarily driven by the expansion in the number of industrial CHP facilities.
Residential
• The increase in natural gas consumption in the residential sector was small (less than 1%). Increases in demand resulting from a growing housing stock were mostly offset by efficiency improvements in natural gas fired equipment, such as furnaces, boilers, and water heaters.
Commercial
• The increase in natural gas consumption in the commercial sector was primarily driven by an increase in commercial floorspace.
Other
• The decrease in natural gas consumption in this category was driven by energy efficiency improvements in pipeline systems. Transportation is included in the “Other” sector and is not broken out separately because historically this been a very small application for natural gas.
4.2 Projected Natural Gas Use
The National Energy Board (NEB) provides energy supply and demand projections in its annual Energy Future publication. The most recent report, Canada’s Energy Future 2013 - Energy Supply and Demand Projections to 2035 (Energy Future Report), was used as a reference source for natural gas consumption projections.9
According to the report, approximately 5,700 PJ of natural gas will be consumed in Canada in 2030. This represents an increase in consumption of approximately 45% from 2012. Disaggregation of total natural gas consumption in Canada by sector, from 2014 to 2030, is shown in Figure 11.
Figure 11: Projection of Natural Gas Consumption by Sector in Canada, PJ, 2014-2030
0 1,000 2,000 3,000 4,000 5,000 6,000 2015 2020 2025 2030 Residential Commercial Industrial Electricity and Steam Generation Transportation PJ Year
In Figure 11, growth in natural gas consumption over the time period varies by sector. Of all sectors, growth in the transportation sector is expected to be the greatest, with an increase of approximately 18 times 2014 consumption values; however, note that the transportation sector still only makes up a small fraction (approximately 1%) of total consumption in 2030. Growth in the power generation sector is the next greatest at 104%, followed by the industrial sector at 32%. Growth in the residential and commercial sectors is expected to be 13% and 12%, respectively.
The primary drivers and assumptions behind the NEB’s projections are summarized below on a sectoral basis.
Power Generation
• Several factors support a greater role for natural gas power generation in Canada, including: low natural gas prices related to increased shale and tight gas production; lower GHG emissions compared to coal-fired power plants; and, shorter construction times (typically 18 months) in comparison with the alternative large centralized power generation options. Natural gas generation also benefits from lower upfront capital costs than coal fired or nuclear power plants and the ability for capacity to be built in smaller increments to better match load growth.
Industrial
• The industrial demand projection is closely related to the economic growth projections, as well as projections of oil and gas production. Key trends that impact the natural gas demand projection include: a gradual recovery in energy-intensive manufacturing industries following the recent economic downturn; strong growth in the oil sands; and, growth in other natural resource industries such as mining.
Residential
• Increasing residential floorspace will lead to an increase in natural gas consumption. However, this will be counteracted to some extent by energy-use per square metre of floorspace declining. Energy use intensity will decrease due to improved building shell construction practices and increased penetration of high efficiency heating appliances.
Commercial
• As with the residential sector, increasing commercial floorspace will lead to an increase in natural gas consumption. This increase will be limited by a revised National Energy Code for Buildings (NECB), which was finalized in 2011. The code change is expected to improve energy performance in new commercial and institutional buildings by 25 per cent compared to the previous code (1997).
Transportation
• The forecast takes into account the current interest in natural gas (often LNG) for medium and heavy-duty trucks, particularly in operations where the vehicles return to central locations often and use key regional transport corridors. In the forecast, freight Natural Gas Vehicles (NGVs) use 100 PJ or 7.4 106m³/d (260 MMcf/d) of natural gas in 2035, representing 6% of total freight demand. This is approximately equivalent to 60 000 medium- and heavy-duty freight NGVs.
5
Applicant Technologies for SDTC Funding
An analysis of Statements of Interest (SOIs) was undertaken in order to develop an overview of the current state of sustainable downstream natural gas technologies within the sub-sectors considered in this report.
SOIs are received by SDTC as part of their funding process. Proponents identify the nature of the technology being proposed and provide a business rationale for funding support. Only projects that meet the technology development and financial integrity criteria are considered, so the information provided in the SOIs is considered timely and relevant. Taken together, these applications provide a unique and accurate snapshot of the state of late-stage sustainable technology developments in Canada. The SOIs related to the downstream natural gas sector received by SDTC from 2009 to 2013 were reviewed as part of the analysis. Applicant information regarding the type of technology proposed, GHG reduction potential, total project costs, request for SDTC funding, and year of submission were documented for the assessment. SOIs were categorized by sub-sector and technology type.
Approximately 15% of all the SOIs received by SDTC from 2009 to 2013 were related to the downstream natural gas sector. The sub-sectoral breakdown of relevant SOIs is shown in Figure 12.
Figure 12: SOIs by Sub-Sector
Residential
8%
Commercial
12.5%
Industrial
8%
Power Generation
35%
Transportation
12.5%
Renewable Natural Gas
SOIs received were most relevant to power generation, with approximately 35% of the technology applications falling within this sub-sector. This was followed by RNG (25%), commercial (13%), transportation (13%), industrial (8%), and residential (8%).
Specific technologies and technology areas identified during the SOI analysis are summarized below for each sub-sector.
Residential
• High efficiency combined heat and power systems
Commercial
• Energy and data management systems • Combined heat and power systems • Natural gas cooling
Industrial
• Efficient heating systems
Power Generation
• Fuel cell technologies
• Integration of renewable energy with natural gas generators • Power to gas technologies
Transportation
• NG/LNG fuelled vehicles
RNG
• Biogas purification technologies • Biomass gasification technologies • Anaerobic digestion technologies
6
Industry Vision
The Vision Statement developed for the downstream natural gas sector assesses environmental benefits associated with the commercialization of new technologies within the sector. Technologies taken into consideration include those identified during the SOI analysis in Section 5, as well as technologies identified by key stakeholders. Greenhouse gas (GHG) and criteria air contaminant (CAC) emissions are the primary environmental impacts associated with the downstream natural gas sector. Therefore, GHG and CAC emissions reductions are the focus of the Vision Statement and have been assessed quantitatively.
Note that some of the technologies considered may provide benefits other than GHG and CAC emissions reductions. For example, some CHP systems in the residential, commercial, and industrial sectors are able to provide heat and power during electrical grid outages thereby increasing supply resiliency.*
Note on Soil and Water Impacts
The Vision Statement focuses on GHG and CAC emissions, as they result in the direct environmental impacts associated with the downstream natural gas sector. Direct impacts on soil and water quality are more evident during natural gas extraction (e.g., hydraulic fracturing), which is considered outside the scope of this study. Impacts on soil and water quality resulting from activities in the downstream natural gas sector are typically indirect. For example, NOx and SOx emissions contribute to acid rain, which in turn impacts soil and water quality. Therefore, the CAC emissions reductions achieved in the Vision Statement may result in environmental benefits to soil and water quality. However, an attempt to quantify these benefits has not been undertaken, due to the high degree of uncertainty associated with the quantification methodologies and data sources.
Downstream Natural Gas Vision Statement
Based on the prevailing market trends and input from key stakeholders, the following Vision Statement has been derived for the downstream natural gas sector in Canada. The goal year is 2030, representing a 16 year timeframe over which technology innovation is expected. This was chosen to be consistent with the time required to realize major shifts in practices, attitudes and technologies within the sector.
By the year 2030, commercialization of new technologies in the downstream natural gas sector in Canada will:
• achieve GHG emissions reductions of 30.7 Mt-CO2eper year from the business as usual emissions projection;
• achieve annual CAC emission reductions of 86 kt-NOx, 17 kt-SOx, 3.2 kt-PM, 6.9 kt-VOCs, and 140 kt-CO.
* For CHP systems to operating during grid outages, they must be capable of operating in ‘island mode’. The design elements necessary so that a CHP system can be isolated from the grid are system-specific and include additional controls and switchgear.
A graphical representation of the Vision Statement is shown in Figure 13 and Figure 14 for GHG emissions. CAC emissions reductions follow a similar trend.
Figure 13: Downstream Natural Gas Vision Statement, GHG Emissions
560 580 600 620 640 660 2015 2020 2025 2030 GH G Em iss io ns (M t C O₂ -e q) Year Business as Usual Vision 30 MT Reduction
Figure 14: GHG Emissions Reductions from the Downstream Natural Gas Vision, by Sub-Sector
0 5 10 15 20 25 30 35 2015 2020 2025 2030 GH G Em iss io n Re du ct io ns (M T C O2-eq ) Year Residential Commercial Industrial Power Generation Transportation Renewable Natural Gas
Downstream Natural Gas Vision Details Business as Usual Emissions
Business as usual GHG emissions are based on projections contained within the NEB Energy Future Report. Details on specific data used to generate the business as usual scenario for each sub-sector are given in the sections below.
For all sub-sectors, the NEB Energy Future Report assumes that both process (e.g., building codes, social practices) and device (equipment) efficiency improvements will lead to reductions in future fuel consumption. These assumptions are high-level and have not been disaggregated to the extent necessary to remove from the business as usual cases; therefore, the efficiency assumptions have been retained in the sub-sectoral business as usual cases. This may cause some Vision Statement technology efficiency gains to lead to smaller reductions in natural gas consumption than would be the case if the Report’s efficiency assumptions were removed; however, it should also result in conservative emissions reductions projections.
Fuel and electricity consumption values were converted to life-cycle (upstream production* and combustion) GHG and CAC emissions using emission factors from the following sources:
• Natural Resources Canada’s GHGenius v4.03a model for lifecycle assessment of transportation fuels.10 GHGenius was also used for CAC emission factors
for various equipment, such as building heaters and industrial boilers;
• Environment Canada’s National Inventory Report 1990-2011: Greenhouse Gas Sources and Sinks in Canada for natural gas combustion emission factors and grid electricity emission factors11;
• Environment Canada’s National Pollutant Release Inventory for grid electricity CAC emission factors12.
Emissions Reductions within Sub-Sectors
The Vision Statements for each sub-sector attempt to demonstrate the impact of SDTC funding on emissions reductions. In certain sub-sectors, emissions reductions attributable to natural gas technologies are already occurring. For example, in the power generation sub-sector, the recent switch from coal to natural gas electricity generation has led to (and will lead to further) emissions reductions. However, these emission reductions cannot be attributed to SDTC funding and are therefore considered to be a part of the business as usual case. If SDTC funding resulted in the commercialization of more efficient natural gas generators, then the resulting reduction in natural gas consumption within the power generation sector could be attributed to SDTC funding. It is this type of emissions reductions that the Vision Statement attempts to quantify.
Within each sub-sector, technologies expected to lead to GHG and CAC emissions reductions were identified based on input from key stakeholders. In general, these technologies lead to GHG and CAC reductions in two ways: (1) by reducing the amount of natural gas consumed within a sub-sector through, for example, efficiency improvements; and, (2) by fuel switching to natural gas from a higher emitting fuel, such as gasoline or diesel in the transportation sub-sector.
In cases where a technology leads to reductions in natural gas consumption, the methodology used to calculate GHG and CAC reductions involves estimating a percent reduction in natural gas use attributable to that technology. Data used to calculate this percent include, for example: increase in efficiency over the business as usual technology; percentage of market where the technology is applicable; and, the market adoption rate within a sub-sector by 2030. GHG and CAC reductions are then directly proportional to the percent reduction in natural gas consumption caused by the commercialization of a particular technology.
In cases where a technology leads to fuel switching, the methodology used to calculate GHG and CAC reductions involves estimating the market uptake of the technology, which was based on input from key stakeholders. GHG and CAC reductions attributable to a particular technology are then calculated using GHG and CAC emissions reduction factors for fuel switching, for example from gasoline vehicles to natural gas vehicles.
A more detailed discussion of the technological drivers and assumptions used to calculate GHG and CAC reductions is presented below for each sub-sector.
* The GHGenius default emission factor for natural gas production, processing, and distribution in Canada was used to estimate upstream GHG and CAC emissions. This is based on current recovery from Canadian reservoirs and includes emissions from conventional, shale, and tight gas production.
6.1 Residential
Based on the prevailing market trends and input from key stakeholders, the following Vision Statement has been derived for the residential sub-sector in Canada.
Residential Sub-Sector Vision Statement
By the year 2030, commercialization of new technologies in the residential sub-sector in Canada will:
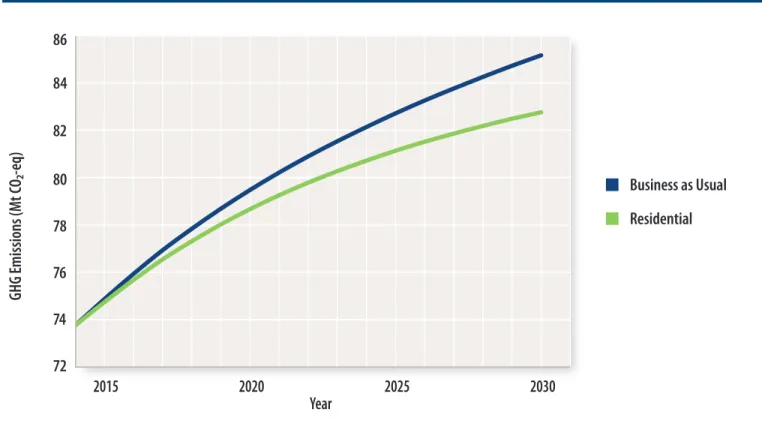
• achieve GHG emissions reductions of 2.4 Mt-CO2e per year from the business as usual emissions projection; • achieve annual CAC emission reductions of 3.0 kt-NOx, 0.73 kt-SOx, 0.16 kt-PM, 0.23 kt-VOCs, and 0.86 kt-CO.
A graphical representation of the Vision Statement is shown in Figure 15 for GHG emissions.
Figure 15: Residential Sub-Sector Vision Statement, GHG Emissions
72 74 76 78 80 82 84 86 GH G Em iss io ns (M t C O₂ -e q) 2015 2020 2025 2030 Year Business as Usual Residential
Business as Usual Details
Business as usual GHG emissions are based on the following projections contained within the NEB Energy Future Report: • Natural gas consumption within the residential sub-sector;
• Grid electricity consumption within the residential sub-sector. This was included since one technology considered, micro-CHP, will offset the use of grid electricity.
Vision Details
The vision GHG and CAC emission reductions may be achieved through technological improvements to: 1. Natural gas heat pumps for space heating;
2. Ultra-high efficiency water heating;
3. Residential smart energy meters/system components and data management solutions; 4. Micro-CHP systems.
Approximately 42% of the GHG reductions in 2030 are expected to come from residential smart energy meters/system components and data management solutions. The remainder of the reductions will come from the increased use of natural gas heat pumps for space heating (36%), more efficient natural gas water heating appliances (18%), and generation of electricity by micro-CHP units (4%). These improvements translate to about 2.4 Mt-CO2e per year of total GHG emissions reduction from projected 2030 levels.
Input Data and Assumptions
Data and assumptions used to calculate GHG and CAC emission reductions are summarized in Table 6 and Table 7.
Table 6: General Data and Assumptions Used in the Residential Vision Statement Calculations
Data Value Source
Proportion of natural gas used for space heating 71%
Natural Resources Canada,
Energy Use Data Handbook 201313
Proportion of natural gas used for water heating 28% Proportion of natural gas used for appliances 1.2% Annual turnover rate of residential
natural gas heating equipment 7% Statistics Canada, the Environment: Energy UseHouseholds and 14
Table 7: Technology Data and Assumptions Used in the Residential Vision Statement Calculations
Technology Bin Assumption Description Value
Natural gas heat pumps
for space heating Coefficient of performance. 2.3
Percentage of the residential market where natural gas heat pumps are applicable.
20% Market adoption in 2030, within the applicable market percentage above. 20% Ultra-high efficiency water heating Increase in efficiency over business as usual residential water heaters.* 13%
Residential smart energy meters/system components and data management solutions
Reduction in residential natural gas consumption in 2030 due to the roll-out of these technologies.
2%
Micro-CHP systems Efficiency of commercialized micro-CHP units in 2030. 86%
Heat to power ratio of micro-CHP units. 2
Maximum available market for micro-CHP units where GHG reductions may be achieved. Calculated as the percentage of the Canadian population living in a province with an electricity grid emission factor higher than the electricity production emission factor for micro-CHP.
13%
Market adoption in 2030, within the available market percentage above. 5%
* This is an estimate of the absolute increase in residential water heating efficiency. It is an aggregate estimate that takes into account efficiency improvements in water heaters, as well as increased use of natural gas heat pumps for water heating.
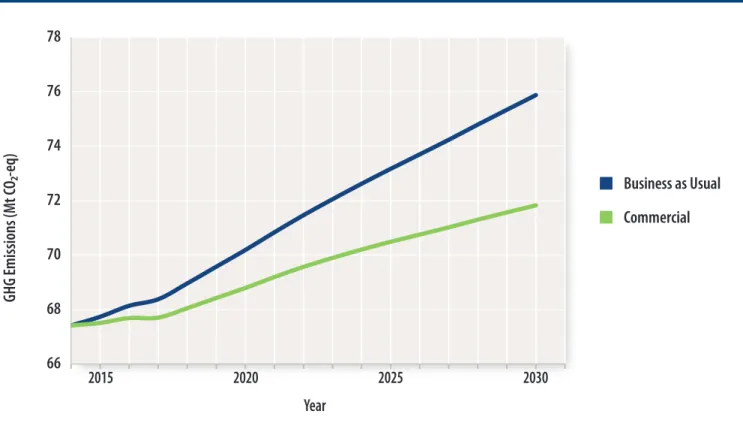
6.2 Commercial
Based on the prevailing market trends and input from key stakeholders, the following Vision Statement has been derived for the commercial sub-sector in Canada. Commercial Sub-Sector Vision Statement
By the year 2030, commercialization of new technologies in the commercial sub-sector in Canada will:
• achieve GHG emissions reductions of 4.1 Mt-CO2e per year from the business as usual emissions projection; • achieve annual CAC emission reductions of 4.9 kt-NOx, 2.9 kt-SOx, 0.33 kt-PM, 0.34 kt-VOCs, and 1.2 kt-CO.
A graphical representation of the Vision Statement is shown in Figure 16 for GHG emissions.
Figure 16: Commercial Sub-Sector Vision Statement, GHG Emissions
66 68 70 72 74 76 78 2015 2020 2025 2030 GH G Em iss io ns (M t C O₂ -e q) Year Business as Usual Commercial
Business as Usual Details
Business as usual GHG emissions are based on the following projections contained within the NEB Energy Future Report: • Natural gas consumption within the commercial sub-sector;
• Grid electricity consumption within the commercial sub-sector. This was included since one technology considered, commercial CHP, will offset the use of grid electricity.
Vision Details
The vision GHG and CAC emission reductions may be achieved through technological improvements to: 1. Natural gas heat pumps for space heating;
2. Natural gas cooling;
3. Ultra-high efficiency water heating;
4. Smart Energy Networks and advanced building control; 5. Commercial CHP systems.
Approximately 54% of the GHG reductions in 2030 are expected to come from smart energy networks and advanced building control. The remainder of the reductions will come from natural gas heat pumps for space heating (24%), generation of electricity by CHP units (17%), natural gas cooling systems (3%), and more efficient natural gas water heating appliances (2%). These improvements translate to about 4.1 Mt-CO2e per year of total GHG emissions reduction from projected 2030 levels.
Input Data and Assumptions
Data and assumptions used to calculate GHG and CAC emission reductions are summarized in Table 8 and Table 9.
Table 8: General Data and Assumptions Used in the Commercial Vision Statement Calculations
Data Value Source
Proportion of natural gas used for space heating 75%
Natural Resources Canada,
Energy Use Data Handbook 2013. Proportion of natural gas used for water heating 14%
Proportion of natural gas used for appliances 9% Proportion of natural gas used for auxiliary equipment 2% Annual turnover rate of commercial
natural gas heating equipment 5% taking into consideration the lower availability of government Assumption based on residential turnover rate, incentives for commercial retrofits.
Table 9: Technology Bin Data and Assumptions Used in the Commercial Vision Statement Calculations
Technology Bin Assumption Description Value
Natural gas heat pumps for space heating Coefficient of performance. 2.3
Percentage of the commercial market where natural gas heat pumps are applicable. 50% Market adoption in 2030, within the applicable market percentage above. 10%
Natural gas cooling Coefficient of performance 1.7
Percentage of the commercial market where natural gas cooling is applicable. 50% Market adoption in 2030, within the applicable market percentage above. 15% Ultra-high efficiency water heating Increase in efficiency over business as usual commercial water heaters. 10% Smart energy networks and
advanced building control Reduction in commercial natural gas consumption in 2030 due to the roll-out of these technologies. 5% Commercial CHP systems Efficiency of commercialized CHP units in 2030. 89%
Heat to power ratio of commercial CHP units. 2
Maximum available market for commercial CHP units where GHG reductions may be achieved. Calculated as the percentage of the Canadian population living in a province with an electricity grid emission factor higher than
the electricity production emission factor for CHP.
13%
6.3 Industrial
Based on the prevailing market trends and input from key stakeholders, the following Vision Statement has been derived for the industrial sub-sector in Canada.
Industrial Sub-Sector Vision Statement
By the year 2030, commercialization of new technologies in the industrial sub-sector in Canada will:
• achieve GHG emissions reductions of 4.6 Mt-CO2e per year from the business as usual emissions projection; • achieve annual CAC emission reductions of 7.1 kt-NOx, 3.1 kt-SOx, 0.36 kt-PM, 0.39 kt-VOCs, and 2.4 kt-CO.
A graphical representation of the Vision Statement is shown in Figure 17 for GHG emissions.
Figure 17: Industrial Sub-Sector Vision Statement, GHG Emissions
2015 2020 2025 2030 GH G Em iss io ns (M t C O₂ -e q) Year 170 180 190 200 210 220 GH G Em iss io ns (M t C O₂ -e q) Business as Usual Industrial
Business as Usual Details
Business as usual GHG emissions are based on the following projections contained within the NEB Energy Future Report: • Natural gas consumption within the industrial sub-sector;
• Grid electricity consumption within the industrial sub-sector. This was included since one technology considered, industrial CHP, will offset the use of grid electricity.
Vision Details
The vision GHG and CAC emission reductions may be achieved through technological improvements to: 1. High efficiency industrial heating equipment (boilers/steam generation/non-steam systems); 2. Instrumentation and control;
3. Industrial CHP systems.
Note that these areas of innovation do not include changes to processes that would lead to reductions in NG consumption. It is understood that process changes can have the highest potential for reduction; however, these are considered out of scope and would be included within industry-specific SD Business Cases™. Approximately 58% of the GHG reductions in 2030 are expected to come from high efficiency industrial heating equipment. The remainder of the reductions will come from instrumentation and control (29%) and the generation of electricity by CHP units (13%). These improvements translate to about 4.6 Mt-CO2e per year of total
GHG emissions reduction from projected 2030 levels.
Input Data and Assumptions
Data and assumptions used to calculate GHG and CAC emission reductions are summarized in Table 10 and Table 11.
Table 10: General Data and Assumptions Used in the Industrial Vision Statement Calculations
Data Value Source
Proportion of natural gas used for process heating and
steam generation 90% Input from key stakeholders. Data on industrial natural gas consumption in Canada is limited. The usage breakdown aligns with US data, where 86% of natural gas consumed by the manufacturing industry
is used for process heat and steam 15
Proportion of natural gas used for other purposes 10% Annual turnover rate of industrial natural gas heating/
steam generation equipment 5%
Table 11: Technology Bin Data and Assumptions Used in the Industrial Vision Statement Calculations
Technology Bin Assumption Description Value
High efficiency industrial heating equipment
(boilers/steam generation/non-steam systems) Increase in efficiency of industrial systems from these technologies, by 2030. 5% Instrumentation and control Increase in efficiency of industrial systems from these technologies, by 2030. 2.5%
Industrial CHP systems Efficiency of commercialized CHP units in 2030. 88%
Heat to power ratio of industrial CHP units. 2
Increase in market size over business as usual due to increased CHP efficiency and lower cost.
6.4 Power Generation
Based on the prevailing market trends and input from key stakeholders, the following Vision Statement has been derived for the power generation sub-sector in Canada.
Power Generation Sub-Sector Vision Statement
By the year 2030, commercialization of new technologies in the power generation sub-sector in Canada will:
• achieve GHG emissions reductions of 6.2 Mt-CO2e per year from the business as usual emissions projection; • achieve annual CAC emission reductions of 15 kt-NOx, 0.11 kt-SOx, 0.51 kt-PM, 0.047 kt-VOCs, and 6.4 kt-CO.
A graphical representation of the Vision Statement is shown in Figure 18 for GHG emissions.
Figure 18: Power Generation Sub-Sector Vision Statement, GHG Emissions
2015 2020 2025 2030 GH G Em iss io ns (M t C O₂ -e q) Year 65 75 GH G Em iss io ns (M t C O₂ -e q) Business as Usual Power Generation 45 40 50 55 60 70 80 85 90
Business as Usual Details
Business as usual GHG emissions are based on the following projections contained within the NEB Energy Future Report:
• Natural gas consumption within the power generation sub-sector (referred to as electricity and steam generation in the NEB Report). In the business as usual case, GHG emissions increase from 39 Mt in 2014 to 81 Mt in 2030. Key drivers for this trend are discussed in Section 4.2.
Vision Details
The vision GHG and CAC emission reductions may be achieved through technological improvements to:
1. More efficient natural gas generators;
2. Emissions control technologies – operating conditions or downstream emissions management; 3. Carbon capture and storage.
Approximately 55% of the GHG reductions in 2030 are expected to come from the use of more efficient natural gas generator technology. The remainder of the reductions will come from carbon capture and storage (45%). These improvements translate to about 6.2 Mt-CO2e per year of total GHG emissions reduction from projected 2030 levels.
Input Data and Assumptions
Data and assumptions used to calculate GHG and CAC emission reductions are summarized in Table 12.
Table 12: Technology Bin Data and Assumptions Used in the Power Generation Vision Statement Calculations
Technology Bin Description Value
More efficient natural gas generators Improvement in generator efficiency by 2030. 10% Emissions control technologies – operating conditions or
downstream emissions management Reduction in CAC emissions intensity by 2030. 10% Carbon capture and storage Market uptake of CCS, 2025-2030. It is expected that regardless of the
regulatory context for CCS, some carbon capture will occur on its own economic merits driven by enhanced oil recovery.
5%
6.5 Transportation
Based on the prevailing market trends and input from key stakeholders, the following Vision Statement has been derived for the transportation sub-sector in Canada.
Transportation Sub-Sector Vision Statement
By the year 2030, commercialization of new technologies in the transportation sub-sector in Canada will:
• achieve GHG emissions reductions of 6.8 Mt-CO2e per year from the business as usual emissions projection; • achieve annual CAC emission reductions of 56 kt-NOx, 11 kt-SOx, 1.8 kt-PM, 5.9 kt-VOCs, and 129 kt-CO. A graphical representation of the Vision Statement is shown in Figure 19 for GHG emissions.
Figure 19: Transportation Sub-Sector Vision Statement, GHG Emissions
2015 2020 2025 2030 GH G Em iss io ns (M t C O₂ -e q) Year 240 245 250 255 260 265 270 275 280 Business as Usual Transportation
Business as Usual Details
Business as usual GHG emissions are based on the following projections contained within the NEB Energy Future Report: • Total fuel and electricity consumption within the transportation sub-sector;
• Breakdown of fuel consumption by vehicle/transport mode type.
In the business as usual case, GHG emissions increase from 245 Mt in 2014 to 275 Mt in 2030. Key drivers for this trend are discussed in Section 4.2.
Vision Details
GHG and CAC reductions are achieved in this sub-sector primarily through the market adoption of natural gas vehicles. Market adoption rates by transport mode used in the vision calculations are shown below in Table 13.
Table 13: Market Adoption Assumptions Used in Transportation Vision Calculations
Transportation Sub-Sector Market Adoption by 2030
Rail 40%
Marine 40%
Off-Road 10%
On-Road Light Duty Vehicles (LDVs) 5%
On-Road Heavy Duty Vehicles (HDVs)* Light (LHDV) Medium (MHDV) Heavy (HHDV)
10% 10% 25%
GHG emissions reductions were calculated based on the above market adoption rates and emissions reductions percentages arising from fuel switching to natural gas within each transport mode, which are shown below in Table 14.
Table 14: GHG Reductions Associated with Fuel Switching in Transportation Sub-Sectors
Transportation Sub-Sector GHG Emissions Reductions16
Rail 19%
Marine 14%
Off-Road Vehicles 21%
On-Road Light Duty Vehicles (LDVs) 16%
On-Road Heavy Duty Vehicles (HDVs) Light (LHDV) Medium (MHDV) Heavy (HHDV)
21% 21% 21%
Approximately 76% of the GHG reductions in 2030 are expected to come from on-road heavy duty vehicles. The remainder of the reductions will come from on-road light duty vehicles (10%), rail (9%), marine (5%), and off-road vehicles (1%). These improvements translate to about 6.8 Mt-CO2e per year of total GHG emissions reduction
from projected 2030 levels.
6.6 Renewable Natural Gas
Based on the prevailing market trends and input from key stakeholders, the following Vision Statement has been derived for the renewable natural gas sub-sector in Canada.
Renewable Natural Gas Sub-Sector Vision Statement
By the year 2030, commercialization of new technologies in the renewable natural gas sub-sector in Canada will:
• achieve GHG emissions reductions of 6.7 Mt-CO2e per year from the business as usual emissions projection.;
• due to data limitations, CAC emissions reductions were not calculated for the renewable natural gas sub-sector. A graphical representation of the Vision Statement is shown below in Figure 20 for GHG emissions.
Figure 20: Renewable Natural Gas Sub-Sector Vision Statement, GHG Emissions
2015 2020 2025 2030 GH G Em iss io ns (M t C O₂ -e q) Year 0 1 2 3 4 5 6 7 8 Business as Usual Renewable Natural Gas
Vision and Business as Usual Details
The amount of RNG produced in the Vision Statement scenario is based on information contained in the Biogas Association’s Canadian Biogas Study17, the CGA and
Alberta Research Council’s Potential Production of Methane from Canadian Wastes18, as well as input from key stakeholders. It has been assumed that in 2030,
approximately 120 PJ of RNG will be produced and consumed in Canada, which is equal to 3% of Canada’s natural gas consumption and 10% of Canada’s RNG production potential (as estimated by CGA and Alberta Research Council).
GHG emissions reductions were calculated by assuming that in the absence of RNG production and combustion, conventional natural gas production and combustion would occur. Production and combustion of RNG results in 90% fewer GHG emissions than production and combustion of conventional natural gas.19 This reduction is
a result of RNG combustion leading to ‘biogenic’ (from biological mater