NBER WORKING PAPER SERIES
PRIVATE EQUITY PERFORMANCE: RETURNS PERSISTENCE AND CAPITAL
Steven Kaplan Antoinette Schoar Working Paper9807
http://www.nber.org/papers/w9807
NATIONAL BUREAU OF ECONOMIC RESEARCH 1050 Massachusetts Avenue
Cambridge, MA 02138 June 2003
We thank Ken Morse and Jesse Reyes for making this project possible. We thank Eugene Fama, Alexander Ljungqvist, Matt Richardson, Rex Sinquefield seminar particiapnts at Alberta, Arizona State, Chicago, MIT, NBER Corporate Finance, NYSE-Stanford Conference on Entrepreneurial Finance and IPOs, NYU, and USC. All data for thei project were obtained from the VentureExpert database collected by Venture Economics. The views expressed herein are those of the authors and not necessarily those of the National Bureau of Economic Research.
©2003 by Steven Kaplan and Antoinette Schoar. All rights reserved. Short sections of text not to exceed two paragraphs, may be quoted without explicit permission provided that full credit including © notice, is
Private Equity Performance: Returns, Persistence and Capital Steven Kaplan and Antoinette Schoar
NBER Working Paper No. 9807 June 2003
JEL No. G12, G24, G30
ABSTRACT
This paper investigates the performance of private equity partnerships using a data set of individual fund returns collected by Venture Economics. Over the sample period, average fund returns net of fees approximately equal the S\&P 500 although there is a large degree of heterogeneity. Returns persist strongly across funds raised by individual private equity partnerships. Better performing funds are more likely to raise follow-on funds and raise larger funds than funds that perform poorly. This relationship is concave so that top performing funds do not grow proportionally as much as the average fund. Finally, market entry in private equity is cyclical. Funds (and partnerships) started in boom times are less likely to raise follow-on funds, suggesting that these funds subsequently perform worse. Several of these results differ markedly from those for mutual funds.
Steven Kaplan Antoinette Schoar
University of Chicago MIT
Graduate School of Business Sloan School of Management
1101 East 58th Street 50 Memorial Drive, E52-447
Chicago, IL 60637 Cambridge, MA 02142
and NBER and NBER
1
Introduction
The private equity industry, primarily venture capital (VC) and buyout (LBO) investments, has grown tremendously over the last decade. While less than $10 billion was committed to private equity partnerships in 1991, more than $180 billion was committed at the peak in 2000. (See for example Jesse Reyes, Private Equity Overview and Update 2002). The increased investment coincided with well-publicized returns to some private equity funds, especially at the end of the 1990s. Moreover, venture capital has received a great deal of attention for its role in the surge of entrepreneurship in the 1990s in the US.
Despite the heightened interest in the private equity asset class and the potential importance of private equity investments for the economy as a whole, we have only a limited understanding of the dynamics of fund returns and the flow of capital into the industry overall and into individual funds. One of the main obstacles has been the lack of available data. As the name private equity suggests, private equity firms are largely exempt from the disclosure requirements that public firms are subject to.
In this paper, we make use of a data set of individual fund performance collected by Venture Economics.1 The Venture Economics data set is based on voluntary reporting of fund returns by the private equity firms (or general partners) as well as their limited partners. This data set allows us to study three issues that have not been closely examined previously. First, we investigate the characteristics of fund performance in the private equity industry. Most strikingly, we find large heterogeneity in returns across funds and time periods. On average, LBO fund returns net of fees are lower than those of the S&P 500, while VC fund returns are lower than the S&P 500 on an equal-weighted basis, but higher than the S&P 500 on a capital weighted basis.2 These results combined with previous evidence on private equity fees, however, suggest that on average both types of private equity returns exceed those of the S&P 500 gross of fees.3
Second, we document substantial persistence in fund performance in the private equity industry, both for LBO and VC funds. We find strong persistence not only between two consecutive funds,
1
We thank Jesse Reyes from Venture Economics for making the data available.
2These results compare returns to the S&P 500 and, therefore, do not adjust for systematic risk. We discuss this
in some detail in the text.
3Jones and Rhodes-Kropf (2003), Ljungqvist and Richardson (2003), and Moskowitz and Vissing-Jorgensen (2002)
but also between the current fund and the second previous fund. General partners (GPs) whose funds outperform the industry in one fund are likely to outperform the industry in the next; GPs who underperform are likely to repeat this performance as well. The persistence does not appear to be caused by risk differences. These findings are markedly different from the results for mutual funds, where persistence has been difficult to detect and, when detected, tends to be driven by persistent underperformance rather than over-performance.4 We explore potential explanations for the difference from other asset classes in our discussion.
Third, we study the relation of fund performance to capital flows, fund size and overall fund survival. We analyze how a funds track record affects capital flows into individual partnerships and the industry overall. We document that fund flows are positively related to past performance. In contrast to the convex relationship in the mutual fund industry, however, this relationship is concave in private equity (see Chevalier and Ellison (1997), Sirri and Tufano (1998) and Chen et al. (2003)). Similarly, we find that partnerships are more likely to be started in periods after the industry has performed especially well. But funds that are raised in boom times (and partnerships which are started during booms) are less likely to raise follow-on funds, indicating that these funds probably perform poorly. The marginal dollar that flows into the industry in these times, therefore, does not appear to go to the top funds, but to funds that have a lower probability of being able to raise a next fund. Finally, we also show that the dilution of overall industry performance in periods when many new funds enter is mainly driven by the poor performance of new entrants. The performance of established funds is less affected.
In the last section of the paper, we discuss possible explanations for our findings in the private equity industry. Underlying heterogeneity in the skills and quality of general partners can lead to heterogeneity in performance and result in more persistence if new entrants have difficulties competing effectively with existing funds. There are a number of forces that might make it difficult to drive down the margins of established funds. First, many practitioners assert that unlike the case for mutual fund and hedge fund investors, private equity investors can have proprietary access
4
In fact, many recent papers in this literature question whether there is any evidence of actual persistence given the selection issues that many mutual fund data sets face. See Carhart et al. (2002) for a comprehensive review of this topic and Berk and Green (2003) for a model of mutual funds returns and capital flows. Our findings on persistence also differ from those for hedge funds, which provide little or modest evidence of persistence. See Bares, Gibson, and Gyger (2002), Brown, Goetzmann and Ibbotson (1999), Edwards and Cagalyan (2001), and Kat and Menexe (2002).
to particular transactions, i.e., proprietary deal flow. In other words, better funds may see better investments. Second, private equity investors typically provide management or advisory inputs along with capital. If high-quality general partners are a scarce commodity, differences in returns between funds can persist. (See Hellman and Puri (2002).) Third, there is some evidence that better venture capital funds get better deal terms (i.e. lower valuations) when negotiating with start-ups. (See the paper by Hsu (2002).) A start-up would be willing to do this if the investor provided superior management, advisory, or reputational inputs.
At the same time, if the persistence results are driven by heterogeneity in GP skills, it is puzzling that these returns to superior skill are not appropriated by the scarce input factor in the form of higher fees and larger funds as has been suggested for mutual funds. (See Berk and Green (2003).) From Gompers and Lerner (1999), we know that compensation was very homogeneous across private equity partnerships over our sample period. Most funds used a compensation scheme of annual management fees of 1.5% to 2.5% of committed capital and a 20% carried interest or share of the profits. Moreover, growing the size of the fund potentially leads to lower marginal and average productivity if funds operate with a concave production function. We find evidence that fund returns decline when partnerships grow their next fund abnormally fast. 5 But again, it appears that in our sample period, the top performing funds on average grew proportionally slower than the median and lower performing funds.
Our results suggest that the forces operating in the private equity industry have not been strong enough to drive away persistence. These effects might have changed in the late 1990s as this was a period of substantial growth in fund size (especially for top performing funds). Moreover, the top performing venture capital funds moved towards a carried interest of 30% during that period. Unfortunately, we will not be able to say anything definite about these effects for a number of years until the returns of those funds have been realized.6
5
For related evidence for mutual funds, see Chen et al. (2003).
6
It is also interesting that recently many of the top funds in the industry have voluntarily returned large fractions of the committed capital to their limited partners; most likely because they are concerned about the effect of poor performance on their reputation.
1.1 Related Literature on Private Equity
Private equity investing is typically carried out through a limited partnership structure in which the private equity firm or partnership serves as the general partner (GP). The limited partners (LPs) consist largely of institutional investors and wealthy individuals who provide the bulk of the capital. We refer to each individual limited partnership as a fund. The LPs commit to provide a certain amount of capital to the fund. The GP then has an agreed time period in which to invest the committed capital - usually on the order of five years. The GP also has an agreed time period in which to return capital to the LPs - usually on the order of ten to twelve years in total. Each fund or limited partnership, therefore, is essentially a closed end fund with a finite life. When the GP exhausts a substantial portion of a funds committed capital, the GP typically attempts to obtain commitments for a subsequent (and separate) fund.
There is a growing literature studying the economics of the private equity industry. Most of the existing studies either have focused on aggregate trends in private equity or have been interested in the relation between general partners and entrepreneurs. This restriction is mainly due to the difficulty of obtaining information on individual fund performance. Two recent exceptions are Jones and Rhodes-Kropf (2003) and Ljungqvist and Richardson (2003) who study private equity returns at the partnership level. We discuss their results and the comparison to the current study in some detail in our section describing average returns.
Gompers and Lerner (1998) look at aggregate performance and capital flows. The authors find that macroeconomic factors like past industry performance and overall economic performance as well as changes in the capital gains tax or ERISA provisions are related to increased capital flows into private equity. A paper that characterizes venture capital returns based on the economics of individual deals is Cochrane (2001). The author finds that venture returns are very volatile, but later stage deals are less risky than early stage deals.
Papers that focus on the relation between general partners and entrepreneurs include Kaplan and Stromberg (2003) who document the structure of incentive contracts between venture capitalists and entrepreneurs. Gompers and Lerner (2000) suggest that the valuation of individual deals is affected by overall macroeconomic conditions and the degree of competition in the venture capital industry.
2
Data
The data for this study have been obtained from Venture Economics. Venture Economics collects quarterly information on individual funds in the private equity industry. The Venture Economics data set is based on voluntary reporting of fund information by the private equity firms as well as by their limited partners. Venture Economics claims that because they receive information from both the GPs and LPs, there is “little opportunity for inconsistent reporting.” Given the private nature of the data, we cannot validate this statement. It seems likely, however, that any bias would be one toward over-reporting by better-performing funds. If present, this would create an upward bias on our results on average returns. At the same time this would make it more difficult to find persistence.
The sample covers the years 1980 to 2001. Because of the rapid growth of the industry in the 1990s, the earlier years contain fewer observations of funds than the later years. The Venture Economics data for each fund include the quarterly performance measures that were collected from GPs and LPs. These measures are the internal rate of return (IRR), the cumulative total value to paid-in capital (TVPI), and the distributed total value to paid-in capital (DPI). Venture Economics also collects the quarterly cash flows in and out of each fund for the life of the fund or through the end of 2001. All these performance measures as well as the cash flows are reported net of management fee and carried interest. We do not know the identities of the particular GPs, but we do know the sequence number of each fund, i.e., if the fund is the first, second, etc. raised by the particular GP.
Throughout the paper, we use two samples of the data. In the main part of the analysis, we include funds: (1) that have been officially liquidated; or (2) whose returns are unchanged for at least the final six quarters we observe; and (3) whose reported unrealized value is less than 10% of committed capital. These criteria make it highly likely that the funds we include are largely liquidated and that the performance measures we calculate are based almost entirely on cash flows to LPs rather than subjective estimates of value by the GPs. We also exclude funds with less than $5 million of committed capital in 1990 dollars to focus on economically meaningful funds. We obtain 746 funds that satisfy these criteria, consisting largely of funds started before 1995.
We also use a larger sample of funds that have either been officially liquidated or were started before 1997. This means that the fund has either been liquidated or has had at least five years to
realize returns on its investments. We also exclude funds with less than $5 million of committed capital in 1990 dollars. Using these sample selection criteria, we obtain a sample of 1090 funds. Because these funds are not all fully realized and we cannot reliably calculate performance for all the funds, we use the Venture Economics reported IRRs. This sample is less likely to be subject to the look ahead bias described in Carhart et al. (2002).
We report most of our results using the smaller sample. Unless otherwise noted, however, the findings reported in the paper are qualitatively unchanged when we use the second, larger sample.
3
Descriptive Statistics
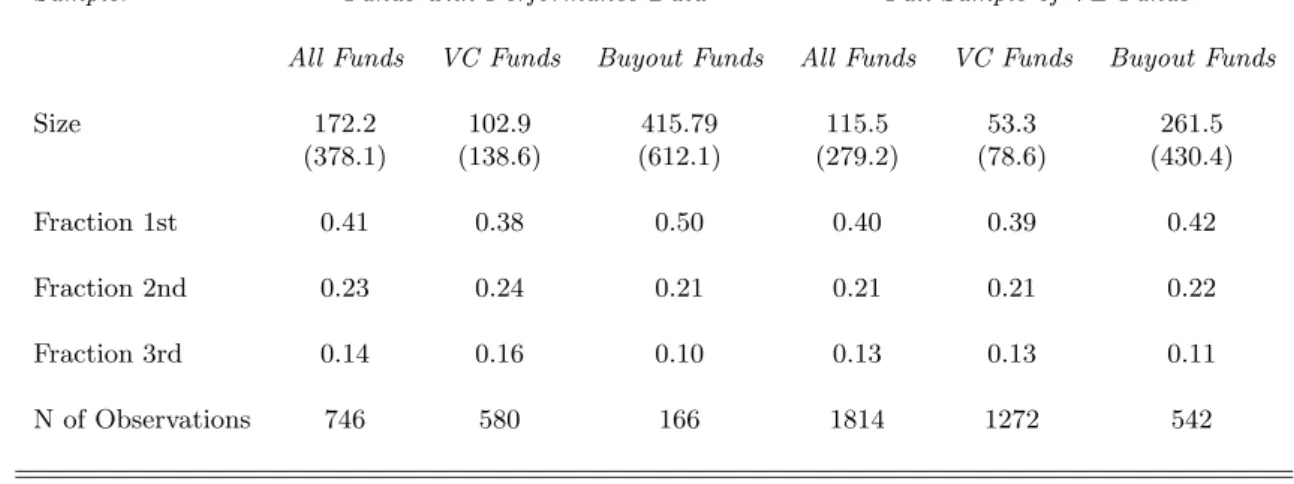
Columns (1) to (3) of table 1 report the descriptive statistics for the sub-sample of 746 funds that are largely liquidated and for which we have calculated performance measures. Roughly 78% of the funds in our sample are venture capital funds while 22% are buyout funds. To get a sense of any potential selection bias in our sample of fund returns, columns (4) to (6) of table 1 report the same statistics for all 1814 funds that are described in Venture Economics and were raised before 1995. We exclude funds that have a vintage year of 1995 or later to match the sample period of the funds we use in our analyses. Our sub-sample covers about 40% of the funds in Venture Economics over the same time period. Roughly 50% of the funds raised do not provide performance data. The remaining 10% of the funds are not fully liquidated. The funds for which we have performance measures are larger on average than the funds in the full sample. The average size of the funds in our sample is $172 million (all figures in 1990 dollars), with venture funds being substantially smaller than buyout funds, $103 million versus $416 million. These compare to average fund size in the full sample of $116 million for all funds, $53 million for venture funds, and $262 million for buyout funds. These averages imply that our performance sample includes 88% of capital committed to venture funds and 49% of capital committed to buyout funds. 7
Table 1 also documents the fraction of first time funds, second time and third time funds in the two samples. In the sample with returns, 41% of the funds are first time funds, 23% are second time funds and 14% are third time funds. The remaining 22% are funds with higher sequence numbers.
7As mentioned previously, we obtain similar results with the larger sample of 1090 funds. That larger sample
includes 92% of capital committed to VC funds and 54% of capital committed to buyout funds for the relevant time period.
The corresponding percentages for the full sample are very similar: 40% are first time funds, 21% are second time funds, 13% are third time funds, and 25% are funds with higher sequence numbers. The potential selection bias in our returns sample, therefore, is toward larger funds. As we show later, larger funds tend to perform better than smaller ones, potentially inducing an upward bias on the performance of funds with returns. We also over-sample first time funds for buyouts. As we show later, first-time funds do not perform as well as higher sequence number funds. Our results for average returns, therefore, should be interpreted with these potential biases in mind.
We are less concerned about any potential biases in our sample regarding the persistence and fundraising results. The mutual fund literature has shown that one important source of bias is that poorly performing funds stop reporting but resume reporting once their returns are better again. According to Venture Economics, this does not occur. We also observe in the data that once a fund is included in the data, it does not stop reporting performance before the fund is liquidated. A second type of bias would be that partnerships do not report returns for a fund all together, if they expect this fund to perform poorly. In this case, we should be less likely to find persistence at the lower end. We will show however that this is not the case in our data.
3.1 Private Equity Performance
In this section, we describe private equity performance and compare that performance to the performance of the S&P 500. We report performance in three ways. First, we report the internal rate of return of the fund calculated by Venture Economics. Second, we report the internal rate of return of the fund that we calculate using the fund cash flows. Third, we calculate what is referred to in the private equity industry as the public market equivalent, or PME. The PME measures the discounted value of the cash outflows of the fund relative to the discounted value of the cash inflows (all net of fees), where discounting is undertaken using the total return to the S&P 500. This calculation has the effect of comparing investing in the fund to investing in the S&P 500. A fund with a PME greater than one outperformed the S&P 500 (net of all fees). We (not Venture Economics) perform the PME calculations using fund cash flows.
Before proceeding, we want to point out three issues regarding PME and performance measures in private equity more generally. If private equity returns have a beta greater than one, PME will overstate the true risk-adjusted returns to private equity. In this study, we do not attempt to make
more complicated risk adjustments than benchmarking cash flows with the S&P 500 because of the lack of a true market value in the early years of a funds life. Jones and Rhodes-Kropf (2003) attempt such calculations using net asset values reported quarterly by Venture Economics. They find that VC funds have a market beta of 1.11 while LBO funds have a beta of 0.81. Ljungqvist and Richardson (2003) use a different methodology and find that both VC funds and LBO funds have a market beta of roughly 1.10 with relatively little variation across funds.
We believe it is possible that the results in these two papers understate the market risk of private equity funds because most venture capital funds invest in young companies in high technology industries with equity betas that exceed 1.00. Similarly, we believe that it is possible that the market risk for buyout funds exceeds one because these funds invest in highly leveraged companies. Ljungqvist and Richardson (2003) find portfolio betas of roughly 1.10 for buyout funds under the assumption that the typical buyout fund portfolio company has the same equity beta as the typical public company in the same industry. However, because of the high leverage used in the typical buyout deal, buyout firms’ equity betas are likely to be greater than those for public companies in the same industry.
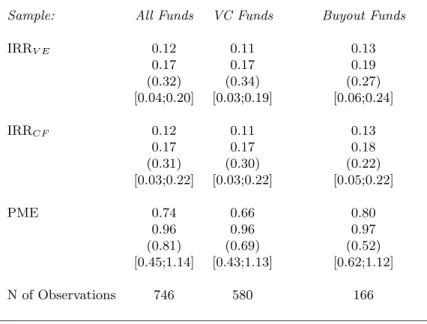
Table 2 reports the three different performance measures for all private equity funds, VC funds only, and Buyout funds only for the 746 funds with largely complete cash flow data. The first number in each cell is the median return, the next is the average return followed by the standard deviation. The last row in each cell contains the returns at the 25th and 75th percentile.
Panel A of Table 2 reports the performance measures on an equal-weighted basis while panel B reports them on a commitment value- or fund size-weighted basis. Panel A indicates that the equal-weighted median and average IRRs reported by Venture Economics over the sample period are 12% and 17%, respectively. Returns to buyout funds are slightly higher than the returns to venture funds. The IRRs that we calculate from the cash flows are virtually identical. Panel A also indicates that the median and average funds have PMEs of 0.74 and 0.96, respectively, indicating that private equity has returned slightly less then an investment in the S&P 500 over the sample period. The average PMEs to VC and buyout funds are roughly the same at 0.96 and 0.97.
Finally, the table is suggestive of one additional quality of private equity returns. There appear to be large differences in the returns of individual funds. The funds at the 25th percentile show a cash flow IRR of 3% while the funds at the 75th percentile exhibit a cash flow IRR of 22% per year.
The amount of variation seems qualitatively similar for all performance measures, and is greater for VC funds alone.
The value-weighted performance in Panel B of Table 2 is better than the equal-weighted per-formance. The Venture Economics IRRs are a median 14% and average 18% while the cash flow IRRs are a median of 12% and an average of 18%. The PMEs increase to a median of 0.82 and an average of 1.05, indicating that an investment in private equity slightly outperforms the S&P on average. There is a substantial difference between the average PMEs for VC and buyout funds. VC funds have average PMEs of 1.21 while buyout funds have average PMEs of 0.93. This difference is driven by the fact that the larger VC funds of the 1990s outperformed the smaller VC funds of the 1980s while the opposite was true for buyout funds.
It is worth pointing out that the average returns net of fees of 0.96 (equal-weighted) and 1.05 (value-weighted) suggest that the average returns to private equity gross of fees in both cases exceed the S&P 500. Unfortunately, we do not have information on GP compensation in individual funds. However, we know from Gompers and Lerner (1999) that GP compensation is fairly uniform for VC funds. They find that the carried interest or profit share for VC funds is almost always 20%. Our discussions with industry participants indicate that the same is true for buyout funds. Gompers and Lerner (1999) also find that the discounted value of management fees for VC funds (discounted at 10%) equals 16% to 19% of committed capital. Conservatively, the management fees would reduce the denominator of PME by 8% – half of the Gompers and Lerner estimate while adding back the private equity profit share of 0increase the numerator by at least 5PMEs well above one, both on an equal- and value-weighted basis for both VC and buyout funds.
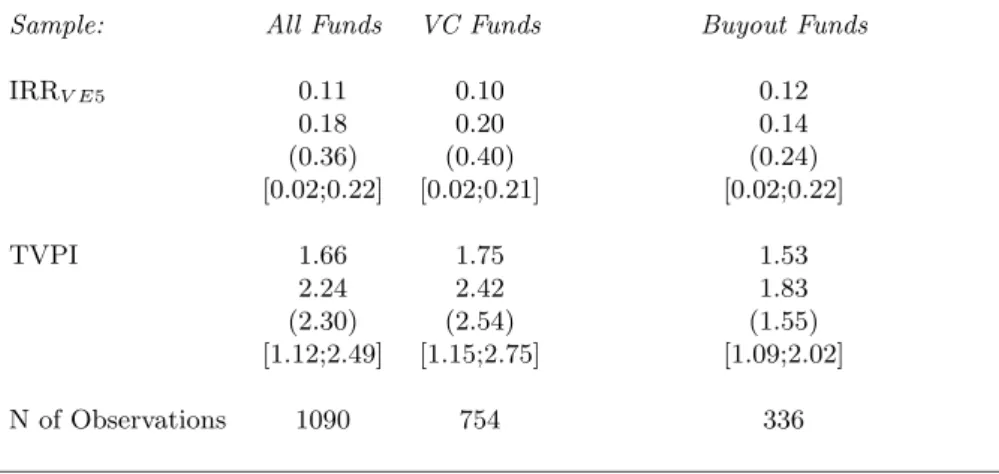
Table 3 presents performance results for the 1090 funds in the larger sample. To put all the funds on an equal footing, we use the IRR calculated by Venture Economics five years after the fund began. We also report the TVPI calculated by Venture Economics five years after the fund began where TVPI is the ratio of cumulative total value distributed value plus estimated residual value to paid-in capital. As we noted earlier, these measures are potentially subject to a reporting bias. These results also reflect a somewhat greater number of more recent funds. Relative to the results for the smaller sample, Table 3 shows that the VC returns are somewhat higher and the buyout returns somewhat lower reflecting the performance of more recent funds included in this sample. The TVPI results in table 3 also indicate that the average private equity fund returns
roughly twice the capital committed to it.
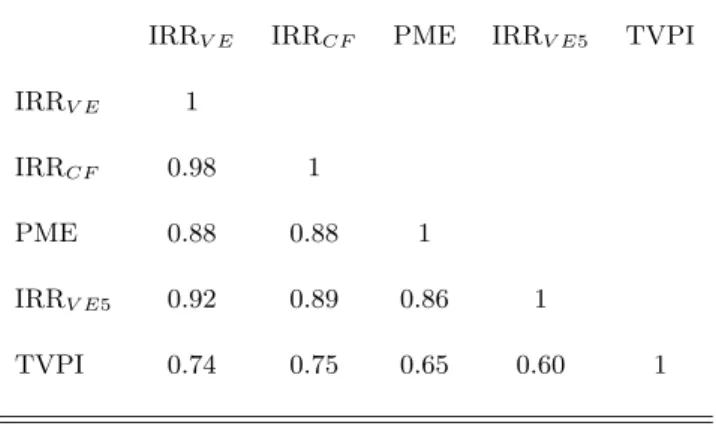
3.2 Performance Correlations
Tables 2 and 3 present five different measures of performance. Table 4 shows the correlations of those performance measures for the sample of 746 funds for which we can calculate all five measures. All five measures are highly correlated with each other. For example, the IRR we calculate from cash flows is strongly positively correlated with the IRR calculated by Venture Economics (at 0.98). PME is strongly correlated with both the IRR calculated by Venture Economics and the IRR we calculate (at 0.88). These results suggest that our IRR and PME calculations accurately reflect the actual performance of the funds. Finally, the IRR calculated by Venture Economics for a fund after 5 years of existence also is strongly positively correlated with PME (at 0.86) and the IRR we calculate from actual cash flows (at 0.89). This suggests that performance five years after a fund is a strong indication of the final or ultimate fund performance.
In the persistence and fundraising analyses that follow, we use PME and the IRR that we calculate from cash flows. As we mentioned earlier, we repeat all our tests using both Venture Economics IRR measures the final IRR and the five-year IRR and obtain qualitatively and statistically similar results.
3.3 Industry Returns Over Time
The performance of private equity overall in tables 2 and 3 masks a great deal of time series variation in that performance. In Table 5 we detail that variation by presenting the average performance of the funds started each year from 1980 to 1997, weighted by the capital committed to each fund. We do not include returns prior to 1980, because we have fewer than three observations per vintage year in most years prior to 1980. Table 5 presents three measures of performance. For the 746 funds that are largely liquidated, the table presents the IRR and PME we calculate. For the 1090 fund sample, the table presents the average Venture Economics IRR.
Column (1) of Table 5 shows a large increase in the number of funds in the mid-1980s as well as in the second half of the 1990s. The three measures of performance show a consistent pattern: VC funds performed relatively poorly in much of the 1980s with IRRs in the single digits and PMEs below 1.00. Since 1988, VC funds have had higher IRRs as well as PMEs that always exceed 1.00.
Buyout funds exhibit almost the reverse pattern with substantial IRRs and PMEs greater than 1.00 in the first half of the 1980s, followed by relatively poor performance in the first half of the 1990s.
3.4 Relation to Other Studies and Implications
As mentioned earlier, Jones and Rhodes-Kropf (2003) use the same Venture Economics data set that we employ in this paper. They use data from 1,245 funds and include returns calculated using GP estimates of value rather than actual cash flows. The focus of their paper, however, is different from ours in that they investigate whether and how idiosyncratic risk is priced in private equity. They also use a different empirical methodology. They estimate alphas that are positive 4.68% per year for venture funds and 0.72% per year for buyout funds but not statistically significant using value-weighted regressions. They also estimate betas of 1.11 for venture funds and 0.81 for buyout funds have. The results for venture funds are qualitatively similar to ours. Our average PME of 1.21 translates into an alpha of 21% cumulated over the life of the venture fund. Our results for buyout funds are slightly more negative with an average PME of 0.93. This may be driven by the different sample size, by their use of unrealized returns, and by their different estimate of beta.
Ljungqvist and Richardson (2003) study the returns to investments in 73 venture and buyout funds by one large limited partner in funds raised from 1981 to 1993. They find that the funds in their sample - 54 buyout funds and 19 venture capital funds - outperform the equity market and have positive alphas. Again, the results for venture funds, despite the small sample, are qualitatively similar to ours. The results for buyout funds are more positive than ours (and those of Jones and Rhodes-Kropf (2003)). The primary difference in our samples (aside from the number of funds) is that Ljungqvist and Richardson (2003) under sample first-time funds 29% of their funds are first time funds while our buyout sample over samples first-time funds 50% of our buyout funds are first time funds relative to the Venture Economics universe of 40% first time funds.
What can we conclude from these three studies? First, the results are consistent with venture funds having generated positive alphas over the estimated time period. This conclusion, however, is by no means certain, as all three studies potentially suffer from a positive selection bias and all three may understate the market risk of venture funds. Second, the results for buyout funds are more ambiguous. As noted earlier, however, these ambiguous results are based on the somewhat
questionable assumption that the equity betas of buyout portfolio companies are roughly equal to one.
4
Characteristics of Fund Returns
In this section, we explore how realized fund returns correlate with partnership and fund charac-teristics. The basic empirical specification is as follows:
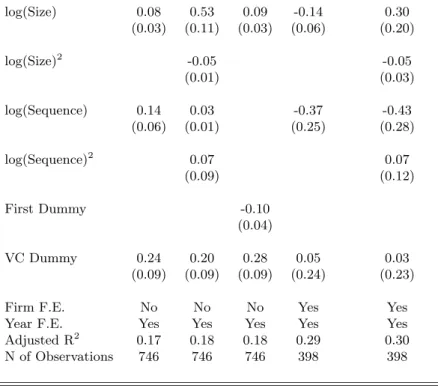
P M Eit=αt+β(F undSizeit) +λ(Sequenceit) +γV C +it (1) where P M Eit is calculated from the cash inflows and outflows of each fund, F undSizeit is the logarithm of the capital committed to the fund,Sequenceitis the logarithm of the sequence number of the fund (later funds of the same firm), and γV C is a dummy equal to one if the partnership is a venture capital firm and zero otherwise. We also include year fixed effects in all specifications to control for the large inter-year variation in returns. In the regressions we report, standard errors are corrected for heteroscedasticity and clustered at the general partnership level. We obtain, but do not report,lowerstandard errors when we cluster by year. 8
Columns (1) to (3) of Table 6 show the cross sectional relations between fund performance and fund characteristics. The estimates in column (1) indicate that larger funds and funds that have higher sequence numbers have significantly higher realized returns. The estimates also confirm that the VC funds in our sample perform better on average than buyout funds. The point estimate on the VC dummy is 0.24 with a standard error of 0.09.
In column (2) of Table 6, we include squared terms of Fund Size and Sequence number along with the direct effects in the regression to analyze the functional form of this relation. The point estimate on the linear term of (log) Fund Size increases significantly when including the squared term, and the coefficient on the squared (log) Fund Size is negative and significant. This suggests a concave relation between Fund Size and performance. While larger funds have higher returns, when funds become very large, i.e. mega-funds, their performance tends to decline.
The relationship between fund performance and the sequence number of the fund is convex, although not significantly so. The coefficient on the squared term of Sequence Number is positive,
8
but not significant while the coefficient on the linear term is smaller, but remains positive and significant. To check the robustness of this relation we also choose a different specification in column (3) where we include a dummy variable (First Time Fund) equal to one if the fund is a first time fund. The coefficient on this dummy is negative (-.10) and significant.
When we include firm (i.e., general partner) fixed effects in column (4) of Table 6, the signs on the Fund Size and Sequence Number variables switch. The coefficient on Fund Size is significant while the coefficient on Sequence Number is not. The Fund Size result indicates that while larger funds have higher returns in the cross-section, when a given GP subsequently raises larger and larger funds, its returns go down. The Sequence Number result has a similar interpretation. In the cross-section, higher sequence number funds have higher returns. However, when a given GP raises a subsequent fund, its returns decline, albeit not in a statistically significant way. When we add squared terms to the firm fixed effects regressions in column (5), we find the same concave pattern for Fund Size that we found in the cross section.
4.1 Persistence of Fund Performance
We now turn to persistence in fund performance. The results in Table 6 provide a first indication of the importance of persistence in the private equity industry. TheR2 of the regressions in columns (1) to (3) increase by about 13 to 14 percent when we include firm fixed effects, in columns (4) and (6). We also find that an F-test on the joint significance of these partnership fixed effects is strongly significant (not reported). The importance of firm fixed effects suggests that partnerships vary systematically in their average performance.
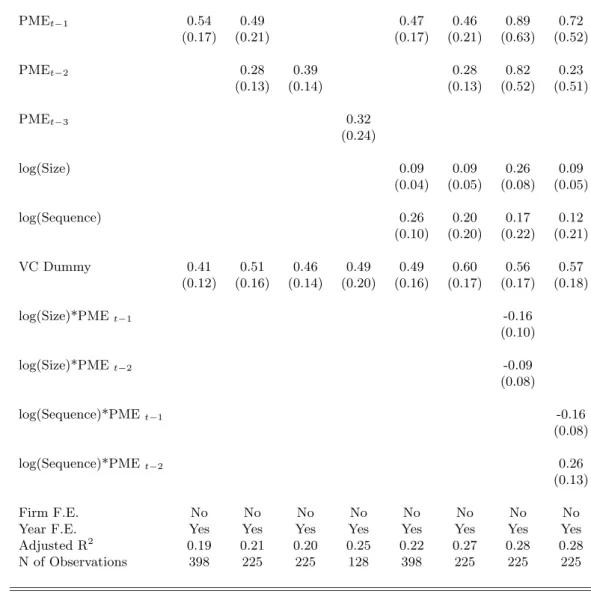
To test persistence more directly, we use a parametric approach. We extend the basic specifi-cation of the previous section to include lagged performance as right hand side variables. We use lagged PME of the first, second, and third previous funds raised by the GP. In table 9, we repeat our regressions using the IRR we calculate from cash flows.
P erf ormanceit =αt+β(F undSizeit) +λ(SequenceN umberit) +γV C+δ(P erf ormanceit−1) +it (2) Because we include the lagged return as a right hand side variable we cannot simultaneously control for firm fixed effects in this regression.
Table 7 presents our results. We find strong persistence in fund returns across different funds within the same partnership. Column (1) contains the results from a regression of PME on lagged PME only controlling for year fixed effects and a VC dummy. The coefficient on lagged PME is positive and strongly significant; the point estimate is 0.54 with a standard error of 0.17. The coefficient implies that a fund with 1% higher performance in the current fund is associated with 54 basis point better performance in the subsequent fund.9
The regression in column (2) includes the performance of both the previous fund and the fund before that. Again the coefficients on both performance measures are positive and significant. The coefficients imply that a 1% increase in performance is associated with a combined 77 basis point increase in performance in subsequent funds (the sum of the two coefficients on lagged performance). These persistence results also hold when we estimate the regressions for VC funds and buyout funds separately (not reported).
It is possible that the current fund and the previous fund of a particular GP have some in-vestments in common. This could mechanically induce persistence in our sample.10 To account for this possibility, column (3) of the table presents estimates of a regression that includes only the performance of the second previous fund. Because the second previous fund is typically raised six years before the current fund, there is likely to be little, if any overlap. The coefficient on the performance of the second previous fund is positive (0.39) and significant (at the 1% level). This coefficient compares to one of 0.54 on the first previous fund suggesting that overlap does not drive our results. In column (4), we include only the performance of the third previous fund. The point estimate on third previous fund performance is 0.32. Because this reduces our sample size to only 128 funds, that coefficient is not significant. It is worth noting that we do obtain a statistically significant result on the third previous fund when we begin with the larger sample of 1090 funds.
In addition to the possibility that GP investments overlap across funds, it also is possible that overlapping time periods across funds induce some persistence. If such overlaps are important, persistence should decline with the amount of time that elapses between funds. In unreported regressions, we test for this possibility by interacting the PMEs for the first and second previous funds with the log of the number of years between the current fund and the respective previous
9
As mentioned earlier, all the results for performance hold if we use last reported Venture Economics IRR, cash flow IRR, and TVPI as measures of performance.
10Investment across funds is likely to be more of an issue for venture funds than buyout funds. Buyout investors
fund. When we do this, the coefficients on the interaction terms are positive not negative (but statistically not significant). This result suggests that our persistence results are not caused by either investment overlap or time period overlap. If anything, this result is consistent with more persistence for GPs who invest more slowly.
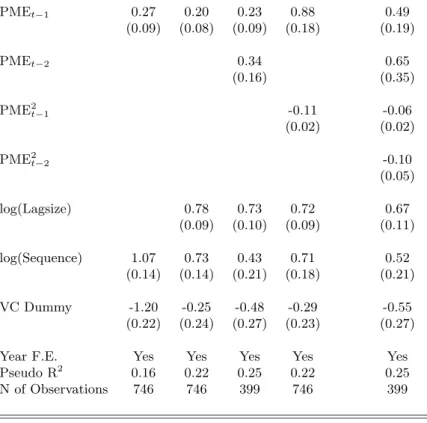
Next, we include controls for fund size and sequence number in columns (5) and (6). We know from the previous section that fund size and sequence number are positively related to fund performance. In column (5), we include only the PME of the previous fund. While the coefficient declines slightly to 0.47, it remains positive and significant. In column (6), we include both lags of performance and find, again, that both are positively and significantly related to current fund performance. These persistence results are, of course, conditional on a GP raising a follow on fund. We will show in Table 10 that the probability of raising a follow-on fund decreases with poor performance. Therefore it is likely that we understate the amount of persistence in returns, because our observations are left censored.
In column (7), we interact the lagged performance for the two previous funds with the log-arithm of fund size in the current fund. The coefficients on both of these interaction terms are negative although they are not significant. This result suggests that larger funds have lower short run predictability. We also ran this regression for changes in fund size and get the same results (not reported). However, the combined effect (direct effect and interaction term) is still positive and significant even for large firms, which means that for both groups we observe persistence in performance. We can interpret these results in light of our previous finding that when a partner-ship raises increasingly larger funds the returns of the new fund start to go down relative to the performance of prior fund of the partnership.
In column (8) of Table 7, we consider the interaction of lagged performance for the two previous funds and the sequence number of the current fund. The coefficient on the interaction term for the previous fund is negative and marginally significant while the coefficient on the interaction term for the second previous fund is positive and significant. We do not have a clear interpretation for these results.
4.2 Additional Robustness Checks
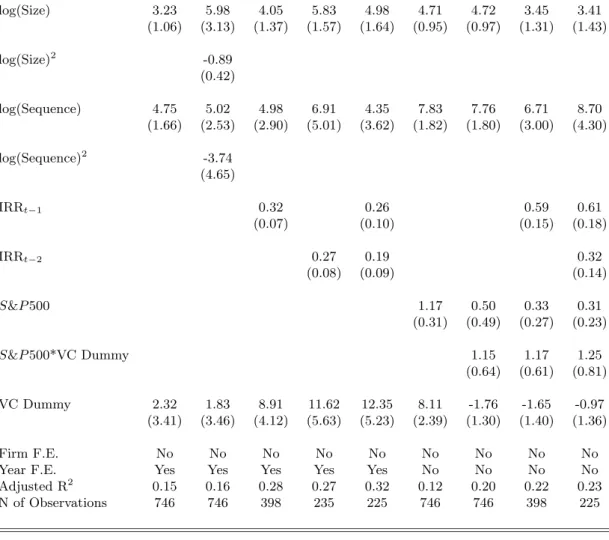
Because the persistence results are unusual relative to the findings for mutual funds and hedge funds, we go through a number of additional checks to test the robustness of our findings. In table 8 we re-estimate the persistence results using fund IRRs based on the cash inflows and outflows to the funds as performance measures. The regressions in columns (1) and (2) confirm that performance increases with fund size and with sequence number. When squared terms are included, fund size remains concave while sequence number becomes concave, but not significantly so. The regressions in columns (3) to (5) of table 8 show that our key persistent results continue to hold. The performance of the previous fund and the second previous fund are statistically significantly related to current fund performance, both individually and when included together.
One possible concern about the documented persistence is that some GPs could be taking on more systematic or market risk than others. In that case, higher systematic risk GPs would have persistently higher returns. In columns (6) to (9), we attempt a simple risk adjustment by including the average annual return to the S&P 500 in the five years after the fund is raised and excluding year fixed effects. Loosely speaking, this is an attempt to estimate the beta of the private equity industry. There are, however, a number of theoretical as well as empirical obstacles that make it very difficult to estimate a beta for private equity funds. First, private equity funds are highly illiquid and do not have a continuously traded market price. Any interim measures of return before the liquidation of a fund (like quarterly reported returns) are necessarily based on subjective valuations by the fund’s general partners. Second, the typical fund takes several years to invest its committed capital, making it difficult to exactly match the fund return to the analogous return on the S&P 500.
In column (6), we adjust for the S&P 500 return, but do not include past performance. The coefficient on the S&P 500 is 1.17. In column (7) we interact the S&P 500 return and the venture capital dummy. The coefficient on the S&P 500 is 0.50 and is insignificant while the coefficient on the interaction term is 1.15 (with a standard error of 0.64). These coefficients imply a market beta of 0.50 for buyout funds and one of 1.65 for VC funds. While they are admittedly measured imprecisely, the coefficient for buyout funds seems implausibly low. Interestingly, the specification in column (7) (with its lower risk for buyout funds) renders the dummy variable for venture capital returns qualitatively and statistically insignificant.
In the regressions in columns (8) and (9), we include, respectively, the returns of the previous fund and the returns of the two previous funds. Adjusting for risk using S&P 500 returns increases the estimates of persistence. In the regression in column (8), the coefficient on the previous fund increases to 0.59 from 0.32 (estimated including year fixed effects). In the regression in column (9), the sum of the coefficients for the first and second previous funds increases to 0.93 from 0.45 (estimated including year fixed effects). These results strongly suggest that differences in GP market or systematic risk do not drive our persistence results.
We also attempted to adjust for differences in risk by dividing the sample of private equity funds into early stage venture funds, later stage venture funds, and buyout funds. If these different stages are correlated with differences in market risk, we would expect to see decreases in persistence after controlling for the differences. We obtain (not reported) qualitatively similar persistence results for the three different types of private equity funds.
The last issue we consider is the possible effects of selection bias and data issues on persistence. A number of studies in the mutual fund industry analyze how persistence of fund returns can be affected by sample selection and data collection issues. Carhart et al. (2002) provide an in-depth discussion of these problems in mutual fund studies.
Our sample differs from the mutual fund studies because we use only realized returns of a fund at or near the end of its lifetime. We are able to use such a measure because private equity funds have limited lifetimes. The advantage in this research design is that observations are not dropped from the dataset if returns in a given period fall below a certain threshold as is sometimes the case in mutual fund data sets. In other words, we believe we are less likely to face this type of selection bias that is sometimes very serious in the mutual fund industry. In an interview in the Asset Alternative Newsletter (Asset Alternative 2002), Jesse Reyes from Venture Economics discussed this type of selection bias in the reporting of private equity funds. He claims that Venture Economics observes very few incidents of funds that stop reporting to Venture Economics when the returns worsen. Reyes supports his claim with the observation that Venture Economics does not rely solely on the private equity funds for performance information, but also collects such information directly from limited partners who are not prone to this type of selection bias.
It is worth pointing out that for mutual funds, Carhart et al. (2002) find that the presence of selection or survivorship bias causes overestimates of average returns and underestimates of the
extent of persistence. If such biases are present in our sample, then our results for average returns would become even more ambiguous, but our persistence results would become even stronger.
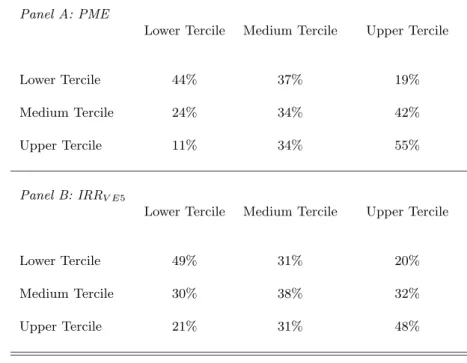
One additional possible bias involves a combination of risk and reporting bias. Perhaps there is some variation in the amount of total risk GPs take on, but no variation in expected performance. High risk funds with positive realizations will be able to raise a subsequent fund. High risk funds with (very) negative realizations will not be able to raise a subsequent fund and may tend to stop reporting. In the next fund (raised by the high risk funds with positive realizations), high risk funds that have negative realizations will again cease to report. If this combination of risk and reporting bias were true, the reported data would exhibit persistence of positive performance, but not negative performance.
We test for the risk and reporting bias story in Table 9 by sorting all the funds for which we have follow-on funds into performance terciles. We then calculate the conditional probability that a partnerships next fund will either stay in the same performance tercile, or move into one of the other two terciles. The results in Panel A measure fund performance using PME. The results in Panel B use the Venture Economics IRR at the end of five years. The results are consistent with persistence in both parts of the distribution. In both panels, funds in the top (or bottom) terciles have at least a 44% chance of remaining in those terciles and at most a 21% chance of moving to the bottom (or top) terciles. In both panels, a chi-squared test rejects the equality of all cells at the 1% level.
Overall, then, while we cannot completely rule out the possibility that differences in systematic risk or selection biases drive our persistence results, we believe that the evidence strongly favors the existence of persistence in private equity.
5
Capital Flows and Fund Performance
In this section, we analyze how fund performance and the track record of a partnership affect the flow of capital into funds. To take the mutual fund industry as a benchmark again, studies by Sirri and Tufano (1998) and Chevalier and Ellison (2000) indicate that funds which outperform the market experience increased capital inflows. This relationship tends to be convex in the mutual fund industry, meaning that mutual funds with above average performance actually increase their
share of the overall mutual fund market.
We estimate the relationship between fund size and performance using Tobit regression estimates to control for the left censoring in the size variable. If poorly performing GPs are unable to raise follow-on funds, a simple OLS estimator will be biased because poor first-time funds will drop out of the sample. Yet not being able to raise a fund at all is clearly an (extreme) outcome of poor initial performance.
In Table 10, we find that capital flows into private equity funds are strongly positively and significantly related to past performance. Column (1) of Table 10 shows the basic specification controlling only for sequence number and VC Dummy. (The logarithm of) Fund size is positively and significantly related to the performance of the previous fund. Funds with higher sequence numbers are larger than first time funds. This suggests that GPs of higher sequence number funds are better able to survive the poor performance of one particular fund. Finally, venture funds are smaller than buyout funds. In Column (2), we include lagged fund size to control for partnership specific effects given that we cannot use firm fixed effects in the specification with lagged return variables. The only effect of this control is to render the VC dummy insignificant. The coefficient on previous performance is still positive and significant.
Parallel to our analysis of persistence in returns we look at the relationship between fund size and performance in the second previous fund. Column (3) shows that current fund size is positively and significantly related to the performance of each of the two previous funds. These findings suggest that funds with persistently good performance are especially favored in the fund raising process. This timing effect makes sense given that returns take some time to realize in the private equity industry. When a GP raises the first follow-on fund, investors will not have learned completely about the true quality of the previous fund. By the time of the second follow-on fund, limited partners are better able to observe a longer track record of the GP.
Finally, we test whether the relation between fund size and prior performance is best charac-terized by a linear relation or whether we observe a different functional form. For this reason, we include a squared term of the PMEit−1 in the regression in column (4) of Table 10. The relation-ship between fund size and performance is positive but concave. The coefficient on the squared term is negative and significant. This result differs from that for the mutual fund industry where researchers seem to find a convex relation between fund size and excess returns. In column (5),
we repeat this exercise by including a squared term for the PMEs of the first two previous funds along with the linear terms. We find a concave relation between fund raising and returns for both previous funds. 11
These findings suggest that the top performing funds in the private equity industry grow less than proportionally with the increase in performance than do the lower performers. Given that most limited partners claim that the top funds are all highly oversubscribed, it seems likely that the better funds voluntarily choose to stay smaller. This result, in turn, might help explain the persistence in performance that we find. By growing relatively less rapidly than the market on a performance adjusted basis, top funds are able to avoid moving into regions of diminishing returns. There are at least two reasons why superior partnerships might choose to do so. On the demand side, it is possible that the number of good deals in the economy is limited at each point in time. If partnerships believe that they face diseconomies of some sort even on their infra-marginal deals when moving down the quality curve, it could be in their interest to grow slowly. On the supply side, better funds might face constraints if GP human capital is not easily scalable and new qualified general partners are scarce. Under either of these constraints, superior GPs have to trade off staying small (and having high returns) or growing at the same speed as the market (or at a higher speed), but moving down the marginal returns curve. In the next section, we look at the flow of funds and the entry and exit decisions of partnerships in more detail.
6
Market Dynamics and Entry of Funds
In this section, we analyze the overall dynamics of performance and capital flows in the private equity industry in more detail. So far, our results indicate that there is strong persistence in performance across funds (at the upper as well as at the lower end). But at the same time, we find evidence that mediocre and poor performing funds grow proportionally faster than the top funds, while the relationship of fund performance to returns is concave. This raises the question how capital is allocated to more poorly performing funds and whether this has a spill over effect on the industry overall.
11We also estimated, but do not report, probit regressions of the likelihood a GP raises a next fund. The likelihood
6.1 Timing of Entry and Cyclicality of Returns
We first consider the entry and exit of partnerships into the private equity market and the fundrais-ing activities of existfundrais-ing partnerships. To this end, we turn to the general database collected by Venture Economics. The benefit of this data is that it is more comprehensive in the coverage of funds than the performance data we used thus far. Venture Economics estimates that this data set covers 70 percent of the overall private equity market. The drawback, obviously, is that we do not observe performance for all of the funds. Therefore, in this section we rely on aggregate measures of industry returns as well as information on fund size and sequence number of funds that we found to be positively related to performance in the previous analysis.
In Table 11, we look at the timing of funds raised by new private equity partnerships. We regress the logarithm of the total number of partnerships started in a given year on different measures of market returns in the current and previous year. We have 26 years of data for this exercise. In column (1) of Table 11, we relate the number of partnerships that are started per year to the returns on the Nasdaq Composite index in the current and the prior year. Lagged Nasdaq returns have a coefficient of 1.46 and a standard error 0.9, while current Nasdaq returns have a smaller coefficient of 0.47 with a standard error of 0.88. Similarly, in column (2) of Table 11, we include current and lagged returns on the S&P 500. These have a positive and significant relation (at the 10the current S&P returns, and the coefficient on the lagged returns is 2.41 with a standard error of 1.4. Finally, we repeat this exercise for the aggregate returns of the venture capital industry. Column (3) of Table 11 shows that there is an increase in partnership starts when lagged venture capital returns are high, while the contemporaneous relation between industry returns and partnership starts is positive but not significant.
We also repeat these estimates using the aggregate amount of capital that is raised by first time partnerships in a given year. We report the results in columns (4) to (6) of the same Table 11. The results are consistent with the previous findings based on the number of new entrants. In fact, the relationship between lagged returns and partnership entry becomes stronger. This suggests that not only do more partnerships decide to start up after a period in which the industry performed well, but also, first time funds tend to raise bigger amounts of capital when the private equity industry performed well. Gompers and Lerner (1999) find similar results for private equity industry returns. This result is interesting because of our previous findings that first time funds
perform markedly worse than established funds.
6.2 Which Type of Funds are Raised in Boom Times?
We now consider the extent to which capital that flows into the private equity industry in boom times is allocated to worse funds than capital that enters in other periods. As mentioned before, we do not observe individual fund performance for the funds in the full Venture Economics data set. However, we do observe whether a partnership raises a follow on fund. Our earlier analysis indicates that the ability to raise a follow on fund is a rough proxy for fund performance.
In Table 12, we report the results of a linear probability model in which we relate the likelihood of raising a follow-on fund to market conditions at the time the initial fund was raised. We construct a dummy variable equal to one if a given partnership raises a follow-on fund and zero if the current fund is the last fund. Because we do not want to bias the results for partnerships that only recently raised a fund (and therefore, have not had enough time pass to need to raise a next fund), we drop any fund that was started after 1998. We regress this dummy variable on the measures of market performance we have used throughout the paper: S$P 500, Nasdaq Composite Index, and venture industry returns. We include contemporaneous performance at the time the current fund was raised, and market performance one year before the current fund started.
Columns (1) and (4) of Table 12 report that funds raised in years when market returns are high and in years after market returns are high are less likely to raise a follow on fund. This negative relation is significant for all four contemporaneous and lagged performance measures for Nasdaq and S&P. This suggests that funds raised in boom years are more likely to perform poorly and, therefore, are unable to raise a follow on fund. Column (7) uses the annual return to venture funds as calculated by Venture Economics. The results of this regression are more ambiguous. The coefficient on contemporaneous venture performance is positive and of the same magnitude as the negative coefficient on lagged performance.
In columns (2), (5) and (8) of Table 12, we also include a measure of market returns in the third year after the current fund was raised. From anecdotal evidence, we know that partnerships tend to raise new funds about every three years. Therefore, we include this three year leading market indicator to capture market conditions at the time the partnership is most likely to be trying to raise a next fund. The coefficient on the three-year leading market index is positive and strongly
significant for all measures of market returns. Again, this finding is consistent with private equity firms being able to raise capital more easily when overall market conditions are good.
Finally, we repeat the above estimation for follow on funds by new general partnerships or first-time funds (as opposed to follow on funds by an existing GP). We report the results in columns (3), (6) and (9) of Table 12. The same pattern we observe for individual funds holds true for GP starts. GPs that enter the market in boom times are less likely to raise a follow on fund. However, if the market conditions are positive three years after the initial funds were raised, the likelihood of being able to raise a follow-on fund improves significantly.
In sum, it appears that the marginal dollar invested in boom times goes towards financing funds which are less likely to be able to raise a subsequent fund, which we interpret a proxy for poor performance.
6.3 Are Fund Returns Affected by the Number of New Entrants?
Finally, we consider the effects of the entry of new partnerships and funds in boom times on overall industry performance and on the performance of particular types of funds.
In Table13, we regress the performance of individual funds on the number of new funds entering the industry in the year that the fund was started, as well as our usual controls (fund size, sequence number and VC Dummy). For this table, we use the larger sample of private equity funds and we measure performance using the Venture Economics IRR after five years. The variable Entry is the logarithm of the aggregate number of new private equity funds in a given year. We also control for the returns on the Nasdaq Composite Index in the year a fund was started, as we know from the results in the previous table that funds are more likely to get started in boom years.12
We report results for the overall industry in columns (1) and (2) of Table 13. Column (1) shows the correlation between fund returns and the logarithm of the number of new entrants. The point estimate is negative (-0.14) and statistically insignificant. However, if we include an interaction term between the entry variable and the logarithm of the sequence number of a fund, we find that the coefficient on the interaction term is positive and statistically significant (the point estimate is
12
We also repeat the regressions in Table13 when measuring entry as the number of newpartnershipsentering the industry in a given year. The results are qualitatively unchanged. Similarly, we also include annual returns on the S&P 500 or the venture capital index as measures of market performance. Again the results are qualitatively the same.
0.76 with a standard error of 0.28). And the coefficient on the direct effect of entry is now negative and statistically significant as well (point estimate of -0.61 and a standard error of 0.20). These results suggest that in periods of increased entry of funds into the industry overall, we observe a larger negative effect on the young funds (those with lower sequence numbers) than on the older, more established funds.
In columns (3) and (4), we repeat the above analysis only for the sub-sample of venture capital funds. In this specification, we base the aggregate number of new entrants only on new venture capital funds that enter the industry in a given year. We find that the effect is stronger in the VC industry. In column (3), we only include the direct effect of the number of new entrants. The coefficient on this variable is negative and barely significant (coefficient of -0.34 with a standard error of 0.18). In column (4), we again include the interaction term between the entry variable and the logarithm of the sequence number of a fund. The coefficient on this term is positive and significant, with a coefficient of 1.13 and a standard error of 0.42. When we combine the direct effect and the interaction effect, the returns of older funds are relatively unaffected by the inflow of new funds. The returns of the entering funds, however, are significantly lower in these periods. The overall effect on the industry returns, therefore, is negative in periods with a large number of new entrants.
Finally, in columns (5) and (6), we repeat these regressions for the sub-sample of buyout funds. We base the aggregate number of new entrants only on new buyout funds that enter the industry in a given year. In column (5), we find that the direct effect of the number of new entrants is negative and statistically significant for the buyout industry. The coefficient on the entry variable is -1.35 with a standard error of 0.25. Overall returns in the buyout industry are significantly diluted in periods where many new funds enter the market. In column (6), we again include the interaction term between the entry variable and the logarithm of the sequence number of a fund. The coefficient on this term is positive, but smaller than for the sample of VC funds and it is not statistically significant. This result suggests that unlike in the VC industry, the returns of older funds in the buyout industry (those with higher sequence numbers) are less isolated from the entry of new funds. Returns for all funds in the buyout entry seem diluted by the inflow of new funds.13
13
One could speculate about the reasons, why we observe such a difference between the returns in the buyout versus the venture capital industry. There are a number of practitioners as well as also academics who suggest that buyout returns are more sensitive to market timing and herding effects, see for example Kaplan and Stein (1993).
7
Summary and Implications
In this paper, we investigate the performance of private equity partnerships using a data set of individual fund returns collected by Venture Economics. Over the entire sample period (1980 to 1997), average fund returns net of fees are roughly equal to those of the S&P 500. Weighted by committed capital, venture funds outperform the S&P 500 while buyout funds do not. These results are similar to the findings of Jones and Rhodes-Kropf (2003) and Ljungqvist and Richardson (2003). Our estimates also suggest that gross of fees, both types of private equity partnerships earn returns exceeding the S&P 500. These conclusions, however, are not certain, as all three studies potentially suffer from a positive selection bias and all three may understate market risk.
Our results for persistence in performance, however, are not ambiguous. For all measures of fund performance and at both ends of the performance distribution, we find that performance persists strongly across funds by individual private equity partnerships. If there are survivorship or selection biases in our sample of funds, actual persistence would likely be greater than the persistence we measure.
Moreover, we document that performance increases with fund size and with partnership expe-rience. The relation with fund size is concave, suggesting decreasing returns to scale. Similarly, the track record of a partnership positively affects capital flows into new funds of the partnerships. But in contrast to the convex relationship in the mutual fund industry, this relationship is concave in private equity.
Finally, we find some evidence that funds that are raised in boom times and firms that are started in boom times are less likely to raise a follow-on fund, suggesting that these funds perform worse. In conjunction with our results on average returns, this suggests a boom and bust type cycle in which positive market-adjusted returns encourage entry that leads to negative market-adjusted returns, etc.
These empirical relations between performance and capital flows differ substantially from the ones found for mutual funds. We think the most likely explanation for these results is a model of In contrast, it is often stated that VC returns are crucially driven by the specific human capital or networks of a funds general partners. However, Since our sample of buyout funds is relatively small and less comprehensive than the sample of venture capital funds (336 versus 754 observations), we do not want to overstate the inference we can draw from the differences between the two industries. Our results also do not include returns on funds raised in 1999 and 2000, a period that appears to have particularly poor returns for venture funds.
underlying heterogeneity in the skills of GPs, and concavity in the production function. Successful partnerships might choose not to grow their funds until the excess returns have been diluted if there are strong diseconomies from scale and scope. This could be true for a number of non-mutually exclusive reasons. First, a successful private equity investor cannot easily scale up investments by either putting more money in any particular deal or investing in more companies, since he provides other inputs that are difficult to scale, such as time and advice. Second, it may also be difficult for a successful fund to hire partners who have equally strong skills as the existing ones. Third, it is possible that top GPs choose to raise less capital than they could because the number of good deals in the economy is limited at each point in time. However, passing up less profitable (but potentially still positive NPV projects) could only be an optimal choice for the GP, if there are negative spill-over effects on the infra-marginaldeals from engaging in these investments.
If, indeed, the persistence results are driven by heterogeneity in GP skills and limited scalability of superior human capital, it remains puzzling that these returns to superior skill are not appro-priated by the scarce input (i.e., the GP) in the form of higher fees and larger funds. On the other hand, it also is puzzling that the cyclical nature of the industry seems to result in capital flows to funds that subsequently have very lower returns.
One could conjecture that better performing funds also have better governance structures or limited partners with more bargaining power (see for example Lerner and Schoar (2002) for a possible mechanism). While these explanations are possible, we do not have a way to test them in the current paper. These findings highlight the need for future work that aims to better understand the organizational structure of the private equity industry.
References
Bares, P., R. Gibson, and S. Gyger, Performance in the Hedge Fund Industry: An analysis of short-term and long-term Persistence, Working paper, Swiss Banking Institute, University of Zurich, 2002.
Berk, J. and R. Green, Mutual Fund Flows and Performance in Rational Markets, Working Paper No. 9275, National Bureau of Economic Research, 2002.
Brown, Goetzmann, Ibbotson, Offshore Hedge Funds: Survival and Performance,Journal of Busi-ness, 72, 1999, 91-119.
Cahart, Mark M., On Persistence in Mutual Fund Performance,The Journal of Finance, Vol LII, 1997, 57-82.
Carhart, M., J. Carpenter, A. Lynch, and D. Musto, Mutual Fund Survivorship,Review of Financial Studies15(5), Winter 2002, 1439-1463
Chevalier, Judith and Paul Ellison, Risk Taking by Mutual Funds as a Response to Incentives,
Journal of Political Economy, vol 105, 1997, 1167-1200.
Cochrane, John, 2001, The Risk and Return of Venture Capital, Working paper, University of Chicago.
Edwards, E. and M. Cagalyan, Hedge Fund Performance and Manager Skill, Working Paper Columbia University, 2001.
Gompers, P., and J. Lerner, What Drives Venture Capital Fundraising? Brookings Papers on Economic Activity and Microeconomics(July 1998): 149-192.
Gompers, P., and J. Lerner, An Analysis of Compensation in the U.S. Venture Capital Partnership.
Journal of Financial Economics, 51, 1999, 3-44.
Gompers, P. and J. Lerner, Money Chasing Deals? The Impact of Fund Inflows on Private Equity Valuation,Journal of Financial Economics 55, 2000, 281-325.
Kaplan, Steven and Jeremy Stein, The evolution of buyout pricing and financial structure in the 1980s,Quarterly Journal of Economics, Vol 27, 1993, 215-246.
Kaplan, S. and P. Str´’omberg, Financial Contracting Theory Meets the Real World: Evidence From Venture Capital Contracts,Review of Economic Studies, forthcoming.
Kat, H. and F. Menexe, Persistence In Hedge Fund Performance: The True Value Of A Track Record, Working paper, University of Reading, 2002.
Khorana, Ajay and Henri Servaes, The Determinants of Mutual Fund Starts, The Review of Fi-nancial Studies, Vol 12, 1999, 1043-1074.
Moskowitz, Tobias and Annette Vissing-Jorgensen, The Returns to Entrepreneurial Investment: A Private Equity Premium Puzzle?,The American Economic Review, Vol 92, 2002, 745-778. The Private Equity Analyst., December 2001, Vol.11, Limited Partners Lack Complete Faith in
Sirri, Erik R. and Peter Tufano, Costly Search and Mutual Fund Flows, The Journal of Finance, Vol LIII, 1998, 1589-1622.
Toll, David M., December 2001, Vol.11, Venture Write-Downs Accelerate as hope of quick rebound fades,The Private Equity Analyst.
Table 1: Descriptive Statisticsa
Sample: Funds with Performance Data Full Sample of VE Funds
All Funds VC Funds Buyout Funds All Funds VC Funds Buyout Funds
Size 172.2 102.9 415.79 115.5 53.3 261.5 (378.1) (138.6) (612.1) (279.2) (78.6) (430.4) Fraction 1st 0.41 0.38 0.50 0.40 0.39 0.42 Fraction 2nd 0.23 0.24 0.21 0.21 0.21 0.22 Fraction 3rd 0.14 0.16 0.10 0.13 0.13 0.11 N of Observations 746 580 166 1814 1272 542 a
In Columns (1) to (3) we restrict the sample to funds for which we all relevant cash flows have been realized. This restricts the sample mainly to funds that were started before 1996. In the following we base most of the performance analysis on this sample of funds with realized performance. Size is measured as the dollar amount of capital that is committed to a fund. The first entry in this cell is mean fund size, and the second entry is the standard deviation. Sequence is the sequence number of a fund. Fraction 1st, 2nd 3rd indicates the fraction of funds in the overall sample that are first time, second time and third time funds respectively. Columns (4) to (6) are based on the full sample of private equity funds in the Venture Economics database over the equivalent time period. We exclude funds that are not private equity funds and those that have missing information on size and year of closing. Standard deviations are in parenthesis.