India Rising—Faster Growth, Lower Indebtedness
Gaobo Pang, Brian Pinto and Marina Wes1Abstract
Over the past 25 years, India’s economy grew at an average real rate of close to 6 percent, with growth rates in recent years accelerating to 9 percent. Yet, by 2005/06, the general government debt-to-GDP ratio was 34 percentage points higher than in the 1980s. We examine the links between the public finances and growth in the post-1991 period. We argue that the main factor in the deterioration of government debt dynamics after the mid-1990s was a reform-induced loss in trade, customs and financial repression taxes; over time, these very factors plus lower entry barriers have contributed to stronger microfoundations for growth by increasing competition and hardening budget constraints for firms and financial sector institutions. We suggest that the impressive growth acceleration of the past few years, which is now lowering government indebtedness, can be attributed to the lagged effects of these factors, which have taken time to attain a critical mass in view of India’s gradual reforms. Similarly, the worsening of the public finances during the late 1990s can be attributed to the cumulative effects of the tax losses, the negative growth effects of cuts in capital expenditure that were made to offset the tax losses and a pullback in private investment (hence growth and taxes), a situation which is now turning around. Insufficient capital expenditures have contributed to the infrastructure gap, which is seen as a constraint, especially for rapid growth in manufacturing. We discuss the ongoing reforms in revenue mobilization and fiscal adjustment at the state level, which if successfully implemented, will result in a better alignment of public finances with growth by generating further fiscal space for infrastructure and other development spending.
World Bank Policy Research Working Paper 4241, June 2007
The Policy Research Working Paper Series disseminates the findings of work in progress to encourage the exchange of ideas about development issues. An objective of the series is to get the findings out quickly, even if the presentations are less than fully polished. The papers carry the names of the authors and should be cited accordingly. The findings, interpretations, and conclusions expressed in this paper are entirely those of the authors. They do not necessarily represent the view of the World Bank, its Executive Directors, or the countries they represent. Policy Research Working Papers are available online at http://econ.worldbank.org.
1 Brian Pinto and Marina Wes are at the World Bank. Gaobo Pang was at the World Bank when this paper was written and is now at Watson Wyatt Worldwide. This paper draws liberally upon earlier work, notably the 2006 Development Policy Review for India, Pinto and Zahir (2004a, b) and Pinto, Zahir and Pang (2006). It was presented at the October 12-13 2006 “Sovereign Debt and Development: Market Access Countries” conference organized by PRMED under the title “India: East Asian Growth, Latin American Deficits”. We thank Dipak Dasgupta, Shanta Devarajan and especially John Williamson for helpful comments.
WPS4241
Public Disclosure Authorized
Public Disclosure Authorized
Public Disclosure Authorized
1. Introduction
Over the past 25 years, India’s economy grew at an average real rate of close to 6 percent, among the best performances in the world. Yet by 2005/06, the general government debt-to-GDP ratio was 34 percentage points higher than in the 1980s. For much of this period, high growth has coexisted with high deficits leading to nominal debt growing 2 percentage points a year faster than nominal GDP. This combination of high growth with high deficits for such a long period without a major economic crisis is unique among large emerging market countries.2
As Figure 1 shows, growing indebtedness (measured by the debt-to-GDP ratio) has coincided with high fiscal deficits.3 This is not necessarily cause for alarm: a country with high
growth potential might need to borrow in order to extract it. One consequence might be a temporary rise in indebtedness, but this need not lead to a solvency problem. An obvious case is increased government spending on infrastructure, which spurs private investment and future growth and taxes while raising short-run fiscal deficits. For India, however, indebtedness has risen even though government capital expenditure was cut by 3 percent of GDP after 1991.
One recent analysis argues: “The reasons India has remained fundamentally solvent despite the sustained fiscal deficits of the past twenty years are fast nominal GDP growth and financial repression.”4 But real GDP growth has been high too. A possible explanation is that the
reasons for high growth and high fiscal deficits overlap, as we shall argue. Besides, the scope for financial repression in recent years has diminished considerably compared to the second half of the 1980s or even the early 1990s.5 Singh and Srinivasan (2004) underline that “… a coherent
intertemporal model” is needed to understand India’s macroeconomic puzzles. We attempt to do this, albeit heuristically, while also trying to integrate the macro and the micro.
In focusing on the interdependence between macro-fiscal sustainability and the micro-foundations of growth, the theme of this paper, we show that a significant portion of the rise in indebtedness after 1991 is traceable to a reform-induced loss in revenues. The bulk of the loss came from cuts in indirect taxes (customs and excise) and implicit financial repression taxes. Over time, the resulting trade and domestic financial liberalization have increased competition and hardened the budget constraints of firms and financial sector institutions—the government-owned development finance companies in particular—stimulating deeper microeconomic restructuring and faster growth. But this has been a meandering process which has been gaining momentum only over the past few years. Taking an integrated view of the macro and micro and allowing for lagged effects leads to a more positive interpretation of India’s post-1991 economic outcomes and reforms. In particular, the deterioration in the government’s debt dynamics during the late 1990s can be interpreted as the fiscal costs of the reforms which have contributed to the resurgence in growth after 2003 by strengthening the microfoundations. This approach reinforces rather than diminishes the urgency of continued fiscal and structural reform, not least to address inadequate infrastructure as probably the most serious constraint on continued rapid growth.
2 In retrospect, the 1991 balance-of-payments crisis was more an embarrassment than a crisis when compared with Latin America’s lost decade. Its most important impact was that it served as a trigger for economic reform. For comparisons of India’s fiscal, debt and growth outcomes with other emerging market countries (many of which endured a serious crisis after 1997) see Ahluwalia (2002a) and Pinto, Zahir and Pang (2006, Annex 1).
3 Unless otherwise noted, debt and deficits will refer to the debt and fiscal deficit of the general government (center and states consolidated).
4 Buiter and Patel (2005, p. 18).
5 Kletzer (2004) estimates financial repression revenue for 1980-2002 and finds it to be negative in 2001 and 2002.
1.1 Deficits, debt and growth in a nutshell
Figure 1 Growth (%), Fiscal Deficit, and Debt Stock (% of GDP)
Eighth Plan 0 2 4 6 8 10 12 80/81 82/83 84/85 86/87 88/89 90/91 92/93 94/95 96/97 98/99 00/01 02/03 04/05 30 40 50 60 70 80 90
Debt stock Fiscal deficit Real GDP Growth
Fiscal deficit Real GDP growth Debt stock Eighth Plan (92/93-96/97) Ninth Plan (97/98-01/02) Tenth Plan (02/03-05/06) Benchmark (85/86-89/90)
Source: Handbook of Statistics on Indian Economy, Reserve Bank of India The impact of lags, which is critical to the preceding interpretation and which is discussed more completely below, is related to certain clearly demarcated stages in economic outcomes over the past 20 years. In Figure 1, we see a jump in the fiscal deficit to the 9-10 percent of GDP range in the late 1980s with the general government debt-to-GDP ratio displaying a sustained rise to a (local) peak of 81 percent in 1991/92 coinciding with the BoP crisis. The period 1985/86-1989/90, which was marked by high deficits and rising debt, offers a convenient benchmark for the assessment of economic outcomes after the crisis and reforms of 1991. The first subsequent period of interest is the reform-intensive Eighth Plan period, 1992/93-1996/97, during which growth recovered with deficits falling and the debt-to-GDP ratio shrinking to a (local) trough of 68 percent in 1996/97. The second period more-or-less coincides with the Ninth Plan period, 1997/98-2001/02, during which growth slowed relative to the last three years of the Eighth Plan period, deficits rose and debt climbed, returning to 81 percent of GDP. This is the period when accusations of fiscal profligacy, concerns about slowing reforms and misgivings about a crisis were at their strongest in recent years. The third period covers the first four years of the Tenth Plan period, 2002/03-2005/06, during which growth staged a significant acceleration starting in 2003 and deficits charted a downward course but debt rose to another peak, of 86 percent, in 2003/04, before beginning to fall. We shall pay particular attention to the unexpected resurgence in growth of the past three years, including emerging constraints to maintaining it and the related public finance implications.
General government fiscal data presented in this paper are only up to 2005/06, because of the time lag in the availability of reliable consolidated state-level fiscal data. Early estimates for 2006/07 suggest that the general government deficit estimated will decline to 6%, pointing to impressive fiscal consolidation in recent years, especially at the state level. This has also been recognized by the markets, which have started to take a relatively sanguine view, with all major ratings agency upgrading India’s long-term foreign currency ratings to investment grade since mid-2006.
1.2 A Policy Thought-Experiment
In understanding the interdependence between macro-fiscal sustainability and growth after 1991, consider that the economy was effectively closed until that year. The government’s debt-to-GDP ratio was over 80 percent and its tax system heavily reliant on customs and excise duties and implicit financial repression taxes. One could imagine a policy agenda dominated by three objectives: avoid another crisis; stimulate growth through better resource allocation and competition; and alleviate poverty, partly through faster growth and partly through subsidies (which turn out to be inefficient and politically motivated). The following policy instruments could be regarded as having been assigned to the crisis avoidance and growth objectives:6
• Crisis avoidance: shift to long-term rupee debt; build up foreign exchange reserves; go slow on capital account liberalization; don’t privatize banks.
• Faster Growth:
o Get the prices right: Cut import tariffs on machinery and inputs, go slow on consumer goods; reduce excise duties; reduce financial repression.
o Put pressure on incumbent firms to become more efficient while enlarging their ability to respond: Cut import tariffs (import competition); and reduce entry barriers—liberalize industrial licensing, foreign direct investment, foreign technology agreements.
There are difficult policy trade-offs: cutting import and excise duties would tend to raise the primary fiscal deficit, while reducing financial repression would raise interest payments. Given its vulnerability to a crisis, the government cuts capital expenditure to keep deficits in check, which is politically (and possibly institutionally) easier to do than cutting the wage bill or increasing direct taxes; but with inimical effects on growth down the road. Reforms are gradual. The chief constraints to going cold turkey (apart from political economy and vested interests) would be the high initial debt and sheltered firms and banks unaccustomed to competition from overseas. Today, the cumulative impact of India’s gradual reforms has been substantial, and we argue that the resurgence of growth over the past three years is based on strengthening
microfoundations in an environment of global competition.
Section 2 discusses the links between the public finances and growth. Section 3
elaborates upon the ongoing fiscal adjustment on the revenue side (to compensate for the reform-induced loss in taxes) and in the states (in response to the recommendations of the Twelfth Finance Commission). It closes with the challenge of creating fiscal space for infrastructure. Section 4 concludes.
2. Public Finances and Growth After 1991
Concerns about a looming fiscal crisis were repeatedly expressed by eminent economists towards the end of the Ninth Plan period (Acharya (2001, 2002a, 2002b), Ahluwalia (2002a), Srinivasan (2002)). Apprehension about fiscal profligacy in the form of the Central Fifth Pay Commission award (CFPC—implementation of which began at the center 1n 1997 followed a year later by the states)—and lost opportunities to spur growth and cut poverty came to the forefront.7 Srinivasan (2002, page 68) wrote, “When the economy seems to be at last on the
6 Acharya (2006) contains a fascinating account of India’s macroeconomic challenges and response. 7 The CFPC award was labeled the “single largest adverse shock to India’s strained public finances in the last decade” and an act of “fiscal profligacy” without parallel (Godbole (1997), Acharya (2001), quoted in World Bank (2003), page 36).
verge of achieving sustained and rapid growth, jeopardizing it is unconscionable.”8 Box 1 discusses how a crisis was avoided during the Ninth Plan period even as other emerging market countries with seemingly better fiscal fundamentals succumbed to crises.
Box 1. How a Crisis was avoided during the Ninth Plan Period
With the wisdom of hindsight, a crisis was avoided because: (i) as a deliberate policy, the government shifted towards long-term rupee debt and built up foreign exchange reserves to lower vulnerability after 1991;a/ (ii) it cut capital expenditure to limit fiscal deficits; and (iii) slow capital account liberalization, state-owned banks which willingly held government paper and gradual financial liberalization helped keep interest rates low while limiting avenues for a speculative attack.b/
Would not growth become a casualty of the effort at self-insurance (cut capex, raise reserves) described above? Accumulating reserves when fiscal deficits are high requires high real interest rates to generate the needed current account surpluses, and indeed, there were suspicions of private investment being “crowding out” during the Ninth Plan period.c/
a/ After the 1991 crisis, Acharya (2001, page 16) notes that there was a conscious decision to build up reserves to
“provide greater insurance against external sector stresses and uncertainties”. See also Reddy (2002).
b/ Williamson and Zagha (2002) stress the benefits of the gradualist approach to capital account liberalization. See also
Hausmann and Purfield (2004).
c/ Chapter 2, India (2001), Reserve Bank of India (2002), World Bank (2003), Pinto and Zahir (2004a). Lal, Bery and
Pant (2003) discuss crowding out as well as the growth effects of subsequent capital inflows sterilization. Ultimately, however, with India becoming increasingly integrated into the world economy, the only way to avoid a crisis would be to convince debt holders that the government will eventually generate the requisite primary surpluses to balance its intertemporal budget constraint. A sufficient condition would be assurance that future growth and taxes will be high enough—provided a temporary increase in deficits does not in the meanwhile lead to a crisis. On this latter point, India is in a good position because of its strong credit history and good inflation track record; in other words, it is “debt tolerant”, unlike many of the emerging market countries which fell prey to disruptive crises with better public finance indicators.9
Our explanation for the positive outcome on growth over the past three years is as follows. The main reason for the deterioration in debt dynamics during the fateful Ninth Plan period was not fiscal profligacy understood as an irresponsible increase in spending; rather it was a revenue loss associated with the reforms aimed at liberalizing trade and the financial system after the 1991 crisis. Cutting import tariffs and excise duties and eliminating industrial licensing lowered trade and domestic entry barriers, increasing competition for incumbent firms, reducing the scope for cost-plus pricing and forcing higher quality, i.e., hardening firms’ budgets.10 This
was an equally direct if less obvious macro-micro link than say increasing public infrastructure investment or cutting marginal corporate income tax rates. Moreover the ongoing liberalization of the financial system enlarged the financing options open to firms, increased competition for commercial banks and the development finance companies and reduced the scope for financial repression (which in all likelihood had involved government borrowing being cross-subsidized by firms). All this has forced firms and banks to become more efficient over time, creating a more solid micro foundation for growth. In this interpretation, the macroeconomic deterioration in debt dynamics is the fiscal cost of the reforms with the payoff in terms of higher future growth and
8 Professor Srinivasan was not alone in expressing misgivings about growth. See also Ahluwalia (2002b), India, Planning Commission (2001, Chapter 2), World Bank (2003) and Pinto and Zahir (2004).
9 On debt intolerance, see Reinhart, Rogoff and Savastano (2003). 10 The seminal paper on hard budget constraints is Kornai (1986).
taxes based on a stronger (i.e., more able to withstand global competition) micro foundation for growth.
2.1 Fiscal adjustment and growth
The trade and financial liberalization-related tax loss had two components: customs and excise; and implicit financial repression taxes. How this could affect debt dynamics may be seen from using the continuous time approximation of the difference equation for government debt shown in Annex 1:
(1)
d
&
=
pd
+
(
r
−
g
)
d
,
where d is the government debt-to-GDP ratio, pd is the ratio of the primary deficit to GDP, r is
the real interest rate, g is the real growth rate. The primary deficit can be written as capital
expenditure (k) plus non-interest current expenditure (n) minus the sum of customs and excise
duties (τ) plus other revenues (T), all expressed as ratios of GDP. Likewise, the interest rate can be written as
=
m−
φ
r
r
, where rmis the interest rate which would prevail in the absence offinancial repression and
φ
>
0
is the implicit financial repression tax. Equation (1) can now be rewritten as shown below, where the primary fiscal deficit has been decomposed into the terms shown in square brackets and the implicit tax from financial repression isφ
d
:(2)
d
&
=
[
k
+
n
−
(
τ
+
T
)]
+
([
r
m−
φ
]
−
g
)
d
.
The trade and financial liberalization after the 1991 BoP crisis led to a reduction in τ and
φ
. Therefore, absent other changes, we would expect (i) the primary deficit to rise and (ii) the gap between real interest rates and growth rates to narrow or even become positive, placing the debt-to-GDP ratio on a faster upward trajectory than before. In other words, the time derivative of the debt-to-GDP ratio would change as follows:],
.
[
d
d
d
=
−
Δ
−
Δ
+
Δ
Δ
&
τ
φ
φ
where the first term on the RHS is the reduction in import and excise taxes and the second term in square brackets the rise in interest payments consequent upon (partial) financial liberalization. Suppose for illustration that the reduction in taxes is 1.5 percent of GDP (the primary deficit rises by 1.5 percent of GDP) and the rise in interest payments an equal amount. Then other things held constant, the debt-to-GDP ratio would rise by an additional 3 percent of GDP per year compared
to a situation of no change. Now suppose the government cuts capital expenditure to offset the falling taxes and rising interest payments so that
Δ
k
=
Δ
τ
+
Δ
φ
.
d
+
φ
.
Δ
d
. Then the debt-to-GDP trajectory will not change.2.1.a. Capital Expenditure Cuts Offset Revenue Losses
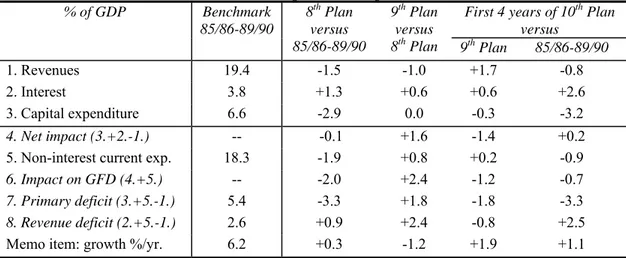
The preceding accounting framework captures the fiscal adjustment during the Eighth Plan period. Table 1 shows that when average outcomes are compared with the second half of the 1980s (the benchmark period), the cut in capital expenditure of 3 percentage points of GDP almost exactly offset the fall in revenues and rise in interest payments.11 In addition, growth
picked up slightly compared to the average over the last half of the 1980s and non-interest current spending was also cut. As a result, the debt-to-GDP ratio actually fell by some 2.5 percentage points of GDP per year over 1992/93-1996/97.
11 The crisis year, 1990/91, and the year following it, are omitted. Pinto and Zahir (2004) and Pinto, Zahir and Pang (2006) argue that the combined 3 percent of GDP hit in falling revenue and rising interest payments is a lower bound for the reform-induced loss in trade, customs and financial repression taxes (net of any increases in direct taxes).
Table 1. Fiscal Adjustment 1985/86-2005/06 (based on period averages)
Benchmark 85/86-89/90
First 4 years of 10th Plan versus % of GDP 8th Plan versus 85/86-89/90 9th Plan versus 8th Plan 9th Plan 85/86-89/90 1. Revenues 19.4 -1.5 -1.0 +1.7 -0.8 2. Interest 3.8 +1.3 +0.6 +0.6 +2.6 3. Capital expenditure 6.6 -2.9 0.0 -0.3 -3.2 4. Net impact (3.+2.-1.) -- -0.1 +1.6 -1.4 +0.2
5. Non-interest current exp. 18.3 -1.9 +0.8 +0.2 -0.9
6. Impact on GFD (4.+5.) -- -2.0 +2.4 -1.2 -0.7
7. Primary deficit (3.+5.-1.) 5.4 -3.3 +1.8 -1.8 -3.3
8. Revenue deficit (2.+5.-1.) 2.6 +0.9 +2.4 -0.8 +2.5
Memo item: growth %/yr. 6.2 +0.3 -1.2 +1.9 +1.1
Note: Rounding off error present.
Source: Authors’ calculations based on Handbook of Statistics on Indian Economy, Reserve Bank of India It is easy to see why the Ninth Plan period appears profligate compared to the Eighth: the gross fiscal deficit rose by over 2 percentage points of GDP while growth fell by over 1
percentage point. Non-interest current spending rose by about 1 percentage point of GDP. This was probably driven by the CFPC award. In spite of this increase, non-interest current spending remained 1 percentage point of GDP below the mid-1980s. Primary expenditure was cut by 4 percentage points of GDP during the Ninth Plan period compared to the mid-1980s—3 percentage points of GDP in capital spending and 1.1 percentage points in non-interest current spending. Large though this expenditure cut was, it was not enough to offset a cumulative fall in revenues of 2.5 percentage points and a rise in interest payments of 1.9 percentage points of GDP, so that the gross fiscal deficit grew to exceed the level of the mid-1980s. The rise in the deficit and slowdown in growth relative to the Eighth Plan period led to a rise in the debt-to-GDP ratio of 2.5 percentage points per year so that by 2001/02, debt-to-GDP was back to the level which prevailed at the time of the 1991 crisis.
The last two columns of Table 1 show outcomes over the first four years of the Tenth Plan period. Revenues grew substantially compared to the Ninth Plan period; but the continued upward trend in interest payments and stagnation in capital expenditure remain worrisome. Moreover, the chief symptom of the worsening expenditure composition, the revenue deficit (government dissaving) had increased by 2.5 percentage points of GDP relative to the benchmark. 2.1.b. Retracing the Debt-to-GDP Path
The debt-to-GDP ratio reached new highs over the first two years of the Tenth Plan period, but fell over the third and fourth year. Insights into what is driving this process can be gleaned from a standard debt decomposition exercise. This decomposition assigns changes in the debt-to-GDP ratio to primary fiscal balances, growth and interest rates, exchange rates and other factors, such as financial sector recapitalization costs and privatization. It is based on the flow version of the government’s budget identity shown in Annex 1.
In Table 2, data values over 1985/86-1989/90, the five years preceding the 1991 crisis, once again serve as a benchmark. Subsequent years are divided into the year of the BoP crisis and its aftermath, 1990/91-1991/92; the Eighth Plan period; the much-maligned Ninth Plan
period, 1997/98-2001/02; and the first four years of the Tenth Plan period 2002/03-2005/06. The impact of each determinant, shown in the first column of the table, is annualized.12
Table 2. Factors Accounting for Rising Indebtedness, 1985/86-2005/06 (Annual average, % points of GDP)
85/86-89/90 90/91-91/92 92/93-96/97 97/98-01/02 02/03-05/06 1. Increase in debt 3.5 3.6 -2.5 2.5 0.2 2. Primary Deficit 5.4 3.8 2.1 4.0 2.2 3. Real GDP growth -3.7 -2.4 -4.7 -3.6 -5.7
4. Real interest rate -0.3 -2.0 0.3 2.8 3.5
5. Real exchange rate change 0.2 1.9 0.1 0.3 -0.3
6. Financial Sector Recapitalization 0.0 0.0 0.3 0.0 0.1
7. Divestment 0.0 -0.2 -0.2 -0.1 -0.2
8. Residual (1. minus sum of 2. to 7.) 1.8 2.4 -0.4 -0.9 0.7
Source: Authors’ calculations based on Handbook of Statistics on Indian Economy, Reserve Bank of India We see that the debt-reducing impact of growth was strongest impact during the Eighth Plan period and the first three years of the Tenth Plan period. The real interest rate impact became positive during the Eighth Plan period and has been strongly positive since as financial repression eased. And in contrast to other emerging market countries, especially the ones suffering a serious crisis, the real exchange rate impact (except for the BoP crisis period and its aftermath 1990/91-1991/92) and costs of financial sector recapitalization have been
insignificant.13 Divestment has not played a major role.
The impact of the growth resurgence is shown in Table 3, which presents results by year for 2002/03-2004/05. Even though the average real interest rate impact over the past 20 years was at its strongest during first four years of the Tenth Plan period, Table 3 shows a small, declining trend as the low marginal interest rates (as a result of the record lows in global interest rates) at last began to kick in.14 Growth has lowered the debt-to-GDP ratio by almost 7
percentage points per year over the past three years. Equally importantly, by 2004/05, the primary deficit had dropped to levels lower than the Eighth Plan period.15
12 Thus, during 1985/86-1989/90, the debt-to-GDP ratio rose by 3.5 percentage points per year, with the primary deficit contributing 5.4 percentage points per year; whereas over 1992/93-1996/97, the debt-to-GDP ratio fell by 2.5 percentage points per year, etc.
13 Debt decompositions for the crisis emerging market countries show that real exchange rate collapses and the fiscal costs of bank bailouts were the main factors raising the debt-to-GDP ratio. Growth collapses played a small role. Budina and Fiess (2004) and IMF (2003).
14With India’s long maturity debt, the impact of low marginal interest rates takes time to be reflected in the average interest rate which drives debt dynamics.
15 For formal analyses of debt sustainability looking at primary fiscal deficits and the real interest rate -growth rate differential, see Rangarajan and Srivastava (2005), Pinto and Zahir (2004b), and Pinto, Zahir and Pang (2006).
Table 3. Changing Indebtedness, first 4 years of 10th Plan period (% points of GDP) 2002/03 2003/04 2004/05 2005/06 1. Increase in debt 5.1 0.0 -2.1 -2.0 2. Primary Deficit 3.2 2.7 1.4 1.3 3. Real GDP growth -2.8 -6.6 -6.7 -6.7
4. Real interest rate 4.0 3.5 3.1 3.2
5. Real exchange rate change -0.3 -0.5 -0.3 0.1
6. Financial Sector Recapitalization 0.1 0.2 0.0 0.0
7. Divestment -0.1 -0.6 -0.1 -0.1
8. Residual (1. minus sum of 2. to 7.) 1.1 1.4 0.4 0.1
Source: Authors’ calculations based on Handbook of Statistics on Indian Economy, Reserve Bank of India
2.1.c. From Rising Debt to Rising Growth
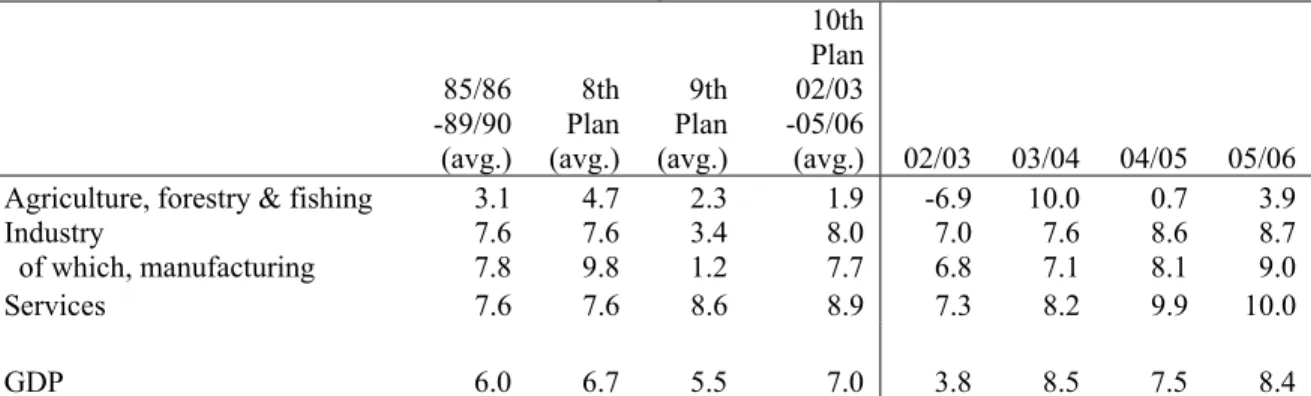
From Tables 2 and 3, it is obvious that the resumption of strong growth in 2003/04 has been the most significant factor driving the debt-to-GDP ratio in recent years. This growth has been broad-based and most significantly, has included manufacturing, which stagnated during the Ninth Plan period, as shown in Table 4. It is also the most tax-buoyant sector of the economy and could explain, via increased taxes, the big fall in the primary deficit also evident in Table 3.
Table 4. Real GDP growth at factor cost (%)
85/86 -89/90 (avg.) 8th Plan (avg.) 9th Plan (avg.) 10th Plan 02/03 -05/06 (avg.) 02/03 03/04 04/05 05/06
Agriculture, forestry & fishing 3.1 4.7 2.3 1.9 -6.9 10.0 0.7 3.9
Industry
of which, manufacturing 7.6 7.8 7.6 9.8 3.4 1.2 7.7 8.0 7.0 6.8 7.6 7.1 8.6 8.1 8.7 9.0
Services 7.6 7.6 8.6 8.9 7.3 8.2 9.9 10.0
GDP 6.0 6.7 5.5 7.0 3.8 8.5 7.5 8.4
Source: Authors’ calculations based on Handbook of Statistics on Indian Economy, Reserve Bank of India We hypothesize that the growth rebound since 2003/04 stems from a more efficient microeconomic environment than has prevailed at any time since 1991 (and probably since independence). IMF (2002) suggests that India’s trend growth had fallen to 5-6% of GDP during the late 1990s, and to perhaps as low as 5% in 2001/02, reflecting lingering structural distortions, infrastructure bottlenecks, and remaining industrial and agricultural controls. However, the transitional recession of the late 1990s led to a process of creative destruction that lay the basis for the subsequent manufacturing growth. The main impetus to growth has come from increased competition and hardened budget constraints as a result of the economic liberalization and cuts in trade and financial repression taxes, which have forced firms and banks to become more efficient, the microeconomic counterpart of the macroeconomic slide during the 1990s. The efficacy of hard budgets and competition in stimulating micro restructuring has been convincingly established in firm-level studies in the transition countries of Central and Eastern Europe.16
16 The first systematic evidence was presented in Pinto, Belka and Krajewski (1993), later confirmed by a 3000-firm survey conducted by EBRD reported in Carlin, et al. (1999).
While detailed firm-level studies do not exist for India, a combination of anecdotal evidence and data suggests three stages in India’s microeconomic transition leading to the recent growth surprise: in the first, India’s large business houses (“oligopolistic firms”) jockey for position in the new regime marked by the dismantling of the permit raj (elimination of industrial licensing) and lower import barriers after 1991 for machinery and inputs; tariffs on consumer goods have been brought down much more slowly. They do so by going on an investment binge. In the second stage, which more-or-less coincides with the Ninth Plan period, there is a slowdown after the private investment spree of the Eighth Plan period reinforced by the cuts in government capital expenditure: while private saving increased by 3 percentage points of GDP during the Ninth Plan period relative to the Eighth Plan period, private investment increased only by 0.6 percentage points of GDP.17 The third stage coincides with the resurgence in growth in 2003/04.
Figure 2 shows investment booming in recent years, with gross domestic investment increasing from 22.9% in 2001/02 to 33.8% in 2005/06, driven mainly by a pick up in private investment. Box 2 shows that TFP was positively affected by the post-1991 reforms, although it has taken time for a visible impact to emerge.18 Some of the reasons for this are discussed in further detail
below.
Figure 2: Investment as a share of GDP, 1985–86 to 2005–06
0.0% 5.0% 10.0% 15.0% 20.0% 25.0% 30.0% 1985-86 to 1989-90 8th Plan 9th Plan 2002-03 2003-04 2004-05 2005-06 Private Investment Government Capital Spending
Gross Fixed Capital Formation
Source: Economic Survey 2006-07.
17 This observation led to the argument that the growing fiscal deficit was swallowing up the increased private saving instead of letting it finance additional private investment; in other words, crowding out was taking place. See Table 4 and related discussion in Pinto and Zahir (2004b, pp. 1042-1043).
18 The growth impact of the post-1991 reforms has not been without controversy. Rodrik and Subramanian (2004) argue that the growth spurt took place during the 1980s. For an opposing view, see Panagariya (2004a, b). Most businessmen would probably side with Forbes (2002, p. 167) who writes: “The changes since 1991 have unleashed a new dynamic in Indian industry [..] that is forcing change in every sector as firms finally are forced by new firms and the availability of imported products to provide consumers with products, prices and service that are beginning to approach internationally competent levels.”
Box 2: Reforms and Total Factor Productivity (TFP) during the 1990s
Several studies have assessed the impact of the market opening after 1991 on TFP of firms as positive.a/ In a study of 131,558 factories, based on the Annual Survey of Industries, Tata Services Limited (2003) finds that TFP growth increased from 0.68% per year during the pre-reform period (1981-82 to 1992-93) to 0.97% during the post-reform period (1993-94 to 2001-02). Similar findings were reported in Unel (2003). The contribution of TFP growth to real output growth has increased; as has labor productivity growth. Pattnayak and Thangavelu (2003) find that reforms in India in the 1990s raised TFP in 10 out of 13 key industries, such as leather and leather products, chemical and chemical products, metal products and parts, machinery and equipment and electrical and related parts. In comparison, TFP growth in traditional industries such as food, beverage, basic metal and alloys, wool, silk and man-made fibres, textiles, and non-metallic minerals has remained either constant or declined. Their comparison of technical change before and after the 1991 reforms suggests that the TFP trend in most of the sectors is significantly higher after the 1991 reforms.
There are also indications that productivity has increased most in those sectors that have opened up to the global markets. Topalova (2004a) and Goldar and Kumari (2003) find that reductions in trade
protectionism lead to higher levels and growth of firm productivity. Interestingly, Topalova (2004a) shows that while this effect is robust and highly statistically significant for private companies, there is no evidence that trade liberalization leads to any productivity improvements for government-owned companies. This suggests that private companies are better able to take advantage of the new opportunities.
Further evidence of the links between productivity and reform has been provided in Dollar, Iarossi, and Mengistae (DIM, 2002) and in Veeramani and Goldar (2004) who analyze the influence of investment climate on TFP in Indian states. Based on a survey of over 1000 manufacturing establishments, and controlling for establishment size and industry, DIM (2002) find that value added per worker is about 45 percent lower in states that business managers consider to possess a relatively poor investment climate. Most of this gap is due to the lower TFP of firms in these states. The average rate of net fixed investment is less than 2 percent for firms from poor investment climate states against 8 percent in good investment climate states.
a/ Goldar (2004) and a number of other authors find that TFP growth in the 1990s decelerated. Goldar and Kumari
(2003) suggest that gestation lags in investment projects and slower agricultural growth in the 1990s had an adverse effect on productivity growth. The analysis reveals that underutilization of industrial capacity was an important cause of the productivity slowdown.
b/ DIM find that a quarter of the TFP gap can be traced to inferior power supply and poorer internet connectivity in poor
investment climate states. About a tenth is due to a higher regulatory burden in the same states.
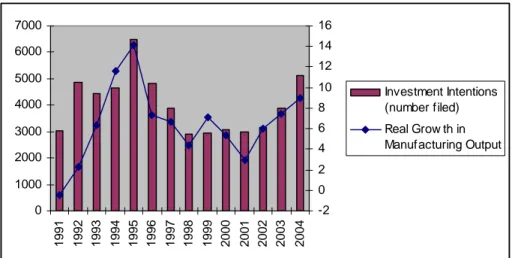
First stage Following the crisis in 1991, the initial post-crisis years witnessed a strong positive
response from investment and growth. In the first half of the nineties, deregulation of industry and foreign trade, strong export performance and the overall reform momentum drove investment higher. The fixed investment surge was particularly strong in the manufacturing sector. As shown in Figure 3 below, investment intentions filed in industry more than doubled from 3038 in 1991 to 6502 in 1995 and the proposed total investment also increased rapidly (from
Figure 3: Trends in Investment Intentions and Manufacturing Output 0 1000 2000 3000 4000 5000 6000 7000 1991 1992 1993 1994 1995 1996 1997 1998 1999 2000 2001 2002 2003 2004 -2 0 2 4 6 8 10 12 14 16 Investment Intentions (number filed) Real Grow th in Manufacturing Output
Source: Handbook of Industrial Policy and Statistics
As part of the liberalization process, quantitative trade restrictions were eliminated, and tariff levels and their dispersion came down. The number of private companies operating in India, also increased significantly, and nearly doubled in the 5 years post-1991, from 249,181 in 1992 to 449, 730 in 1997. As highlighted by Topalova (2004b) in her analysis of the Indian corporate sector, promising trends in liquidity, profitability and leverage of the sector also emerged in the early 1990s (Figure 4).
Source: Topalova (2004b)
The investment boom in the early 1990s appears to have been facilitated by the established business relationships between an oligopolistic real sector and a few large public financial sector institutions (Mohan 2004; and Mor, Chandrasekhar and Wahi 2005). Prior to 1991, a few large business houses relied on a few large development finance institutions, DFIs, to provide
long-Figure 4:
Aggregate and Median Operating Profit to Net Sales Ratio
0 0.01 0.02 0.03 0.04 0.05 0.06 0.07 0.08 1992 1993 1994 1995 1996 1997 1998 1999 2000 2001 2002 Aggregate Median
term investment finance in a system of industrial licensing and controlled interest rates. 19 Mor, Chandrasekhar and Wahi (2005) describe the initial response to the post-1991 liberalization as follows: “In part led by the consortium financing system but largely because neither industrialists nor bankers had any experience in operating in liberalised environments, almost every project that was submitted for financing was accepted. As a consequence, the system created capacity (which is quite possibly what showed up as growth numbers) in industry after industry – steel, man-made fibre, paper, cement, textiles, hotels, and automobiles received a major share of the large loans given principally by the DFIs and partly by the CBs (commercial banks).”
Second stage In the second stage, which more-or-less coincides with the Ninth Plan period, there
is a pull-back after the private investment spree of the Eighth Plan period. Many of the positive trends that had been observed in earlier years were reversed during the second half of the nineties and investment intentions and levels declined significantly (Figure 3). Financial trends at the firm level were also reversed: aggregate leverage increased, and the maturity structure of debt shifted slightly towards short-term borrowing (Topalova 2004b) and companies also suffered from declining profitability (Figure 4). Importantly, a number of studies using disaggregated data point to significant differences across companies. For instance, foreign firms consistently perform better than domestic firms; and private firms perform better than public firms.20 Moreover, these
performance gaps appear to be increasing over time, suggesting that different firms are
responding differently to the new challenges and opportunities provided by the reform process, and thus alluding to some process of creative destruction. (See more on this in the next section.)
We posit three reasons for the reversal in investment performance during the second half of the 1990s, all related to the complex transition process that took place in India.
(i) the Eighth Plan investment boom was facilitated by established business relationships and did not reflect internationally competitive business fundamentals;
(ii) large cuts in public investment which started during the Eighth Plan period, hurt private investment with a lag; and
(iii) given India’s gradual approach, key structural reforms have taken time to reach a critical mass. We consider these three issues in turn below.
A Low-Quality Investment Boom. NCAER (2001) shows that although the liberalization of the early 1990s led to some restructuring, this was of a limited nature and the investment decisions of the Indian private corporate sector were significantly different from foreign companies. The former essentially continued in similar activities as before – basic and intermediate commodities. These activities were not as profitable in the liberalized, more open economy, with large capacity additions further reducing profit margins. Foreign companies on the other hand, entered new areas like pharmaceuticals and certain consumer goods where profitability was higher thus improving their performance. According to CMIE data, the correlation of industry-wise distribution of gross fixed assets between 1992 and 1998 was 0.99 for domestic public firms; whereas it was only 0.79 for foreign firms.21 While domestic and foreign investment surged
19 DFIs were established by the government to provide long-term project finance for investments, while working capital came from the banks.
20As shown by Topalova (2004b), the interest coverage ratio (ICR, defined as earnings before interest, taxes, depreciation and amortization over interest expenses) dropped from 2.7 in 1996 to 1.9 in 1999, suggesting that Indian companies were facing increased strain in meeting their debt service obligations. The incidence of an ICR of less than one (the level at which a firm experiences difficulty in servicing its debt) was greatest among government-owned enterprises (55 percent).
during the first half of the nineties, the structure and operation of existing Indian firms was not significantly altered.
From the perspective of the financial sector, Mohan (2004) notes: “The exuberance of investment activity in the mid-1990s also led to the creation of over capacity in industry, including some uncompetitive capacity that led to erosion of profits which, in turn, perhaps explains the poor performance of the stock market during this latter period.” This investment boom was accompanied by a large increase in public equity issues. Data in Mohan (2004) indicate that such issues rose from 0.7 percent of GDP during the 1980s to 1.1 percent during the Eighth Plan period, 1992/93-1996/97, almost vanishing during the Ninth Plan period, 1997/98-2001/02, at 0.1 percent.22
And Mor et al. (2005, p. 5) describe the impact on the financial sector thus: “These mounting NPAs (non-performing assets) together with excess capacity, suggests a strong
possibility that these two developments were linked to each other in a causal fashion. Almost 4 in 5 projects experienced large delays in implementation and a few celebrated cases could not complete financial closure because of the collapse of equity markets. Three of the five major financial institutions, Unit Trust of India (UTI), Industrial Finance Corporation of India (IFCI) and Industrial Development Bank of India (IDBI) had to be given large infusions of capital by the Government of India.”
Large Cuts in Public Investment. In addition to the firm-level microeconomic restructuring, cuts in public infrastructure investment are likely to have contributed to the slowing of private investment as there appears to be a “crowding in” effect (RBI 2002). IMF (2002) estimates a model of private investment growth in India for 1970/71 – 1999/2000. The estimation results indicate that only public sector investment in infrastructure had a positive effect on private investment, a result corroborated by RBI (2002). Higher growth in public consumption or other public investment inhibited private investment growth. Almost 70 percent of the slowdown in private investment in the late 1990s was attributed to a deterioration in the composition of public expenditures, which shifted towards public consumption and non-infrastructure investments after 1995/96 compared to the earlier part of the decade. The estimated impact is roughly divided equally between the negative effect of weaker growth of infrastructure investments and of faster growth of other public spending.
Key structural reforms have taken time to reach a critical mass. It took some time for the stronger competitive pressures from trade liberalization and the entry of new firms to feed through. Forbes (2002, p. 149) wrote: “It is only in the last four years (i.e., 1996-99) as industrial growth has
fallen and industry has come under the dual pressure of competition from imports and falling margins that firms have been forced to look at which activities they really wish to retain.” (Material in italics added) Moreover, the most dramatic decline in effective tariffs did not take place until the early part of this century.
Third Stage The third stage coincides with the resurgence in growth starting in 2003/04. It
has its roots in the restructuring which began during the second stage, in which import
competition and the resultant compression of profit margins compelled firms to restructure and become more innovative. As noted previously, firm-level evidence from the transition countries indicates that hard budgets and competition—especially when they threaten firms’ survival—can lead to profound microeconomic restructuring. An interesting feature is that some element of
monopoly power (which has been plentiful in India) combined with a sufficient degree of competition (from imports in the first instance) could actually spur innovation because some of the rents from innovation can be captured by the innovating firm.23 This is good news for future growth in India. Recent indicative economic trends and informal interviews with big industrial houses and commercial banks suggest that firms have restructured their balance sheets and assets prior to the current round of expansion. This time, it has very much been with an eye on the global economy.24
In recent years, following a period of corporate restructuring, growth has become increasingly broad-based. After the manufacturing recession of the late 1990s, there has been a sustained and increasing resurgence of manufacturing activity, supported by domestic as well as export demand, strong corporate profitability and resilient business confidence. In the current year, manufacturing has been growing at nearly 12% of GDP. Strong service sector growth is now being supported by a rapid expansion in manufacturing, particularly of consumer durables, suggesting that the current upturn in growth might be more than just cyclical. The turnaround in the growth rate of corporate investment, which began in 2003/04, and peaked in 2004/05 and 2005/06, continues to be sustained in 2006/07.25 Investment as a share of GDP now exceeds 30%,
with infrastructure dominating the scene - its share in total capital investment being about a third in recent years. Investment in the manufacturing sector also remains strong, whereas the share of service sector industries in total capital expansion increased to about 15% in 2005/06.
Improved firm competitiveness is reflected in a number of ways. The financial performance of the corporate sector has improved dramatically in recent years, with the manufacturing sector in particular putting up impressive sales and profit performances.
Corporate sector sales have been increasing at double digit levels annually since 2002-03. Profit after tax has been increasing several times as fast, by 60% in 2003-04 and 31% in 2004-05, indicating an improvement in the profit margin of corporates.26 More recent data provide ground
for continued optimism: Indian corporates report a robust growth in profits of 43% in the quarter ending September 2006, on the back of a buoyant sales growth of 28%. Other corporate sector data provide a consistent picture of improved firm performance: a steep decline in the inventory to sales ratio is observed suggesting improved efficiency in inventory management; and interest expenses have declined significantly as high cost debt has been retired. The stronger corporate balance sheets have had a positive effect on private investment in the economy. The booming industrial activity has led to a rapid rise in non-food bank credit, whose growth rate has exceeded 30% in recent years. As a result, private sector credit as a share of GDP has been rising rapidly, and the share of private sector banks in providing this credit has increased. The improved industrial performance has also translated into an increase in the share of industry in GDP, from 23.3% in 1999/00 to 24.9% in 2005/06.
23 Carlin et al. (2004).
24 One economist working for a major industrial group described the change in attitude thus: In the past, the key concern of Indian companies was how to keep foreign competition out. Now, the key concern is how to gain access to overseas markets. This is a profound change for a country where the economy was effectively closed up to 1991.
25 Based on data from the CMIE CapEx Database and “Corporate Investment: growth in 2005-06 and prospects for 2006-07” RBI Bulletin August 2006, pp. 971-977. Indian corporates started announcing huge new investments in 2003-2004 and outstanding capital investments have been rising ever since: the flow of fresh investments increased by 73% in 2004-05 and then more than doubled to Rs. 8,05,083 crore in 2005-06. Fresh new industrial investments worth Rs. 2,31,164 crore were announced in the quarter ending July 2006, suggesting investment growth is continuing apace this year.
Along with its increased competitiveness, India is increasingly integrating with the rest of the world. Following stagnation in the late 1990s, export performance has taken off dramatically and double digit export growth is continuing. This growth is driven in part by new economic sectors in India, whereas the performance of the traditional sectors, like gems and jewellery, is more modest. India is now also becoming a global hub for several areas of light engineering: it is becoming a global sourcing, manufacturing and research and development hub for the automotive industry. Suzuki’s Indian-manufactured Maruti Alto hatchback accounts for nearly 20% of the small car market in The Netherlands.27
Figure 5: India’s Export Performance
0 500 1000 1500 2000 2500 3000 3500 1990-91 1991-92 1992-93 1993-94 1994-95 1995-96 1996-97 1997-98 1998-99 1999-00 2000-01 2001-02 2002-03 2003-04 2004-05 8% 10% 12% 14% 16% 18% 20% Exports (rupees billion, constant prices) Exports as a share of GDP
Source: CSO, RBI
2.2 Making the Public Finances More Pro-Growth
The description of the fiscal adjustment above as well as the identification of the three stages in microeconomic restructuring suggests one could tell the following plausible, more positive story about Ninth Plan period outcomes: private investment slowed partly because of overinvestment during the Eighth Plan period and the lagged impact of sustained cuts in government capital expenditure. As a result, growth and taxes slowed, widening the deficit and raising debt and real interest rates and forcing further cuts in capital expenditure. This
interpretation would ascribe Ninth Plan period outcomes to the transitional dynamics stemming from the post-1991 reforms rather than the more sinister-sounding effects of fiscal profligacy.28
Viewed from this perspective, the deterioration in debt dynamics after the mid-1990s and up to 2002/03 represented the fiscal cost of reforms, with the benefit emerging in the form of the
27 See Oxford Analytica, September 4th, 2006.
28 While commenting on this paper during the October 2006 “Sovereign Debt and Development” conference, John Williamson argued that implementing the CFPC award in 1997-98 at a time of falling revenue constituted fiscal profligacy; and further that the coexistence of fast growth and rising indebtedness could be explained by simple Keynesianism. Our point is that the revenue decline was a much more serious factor (a point John Williamson accepts) and further that the large compression in primary spending during the Ninth Plan period does not square with fiscal profligacy. Lastly, “simple Keynesianism” broke down during the Ninth Plan period (recall Figure 1 and Table 2), suggesting something else was at play.
subsequent growth rebound and stronger micro foundations for growth. In other words, it has taken some 12 years for the economic benefits from the post-1991 reforms to emerge.
But sustaining these benefits and the high growth will require continuing fiscal reform, not least to address the growing infrastructure constraint, which remains a major challenge for the public finances. One way to close the infrastructure gap is simply to borrow and spend on related projects; after all, infrastructure will pay for itself through faster growth and higher taxes. We caution against such reasoning because of the potential size of the investments involved and the risks this would pose in conjunction with the prevailing high indebtedness and the poor
performance record of existing infrastructure investments, captured by the egregious power sector losses. Further, a significant agenda of reform remains in the areas of revenue mobilization and subsidies, which when implemented will generate significant space for infrastructure. For example, Ninth Plan period outcomes might have been softened by more aggressive
implementation of tax reform, especially on direct taxes and the state-level VAT, which was finally introduced in 2005 in 24 out of 29 states and union territories after a 10-year delay (Poirson (2006)). Subsidy reform (electricity, food, fertilizer) is another area in which more could have been done. These reforms plus a clearer strategy for addressing the infrastructure problem (by dealing with pricing and regulation) might have led to smaller cuts in government capital expenditure and a bigger private sector role in providing infrastructure services.
It is a matter of debate why the preceding combination of low taxes, inefficient subsidies and bad infrastructure was not remedied during the Ninth Plan; however, the chances of
successfully implementing the necessary reforms now may be higher if they are seen as creating a stronger environment for supporting the rapid growth and accompanying euphoria which have emerged after the stagnation of the Ninth Plan period. In the next section, we address two transitions that are going on, both critical for reining in indebtedness and strengthening the links between the public finances and growth: (i) in revenues, completing the move away from trade, excise and financial repression taxes to a broad-based VAT and income taxes; and (ii) at the state level, a major fiscal adjustment in line with the 2004 Twelfth Finance Commission (TFC) report. It culminates in a discussion of the options for addressing the infrastructure gap.
3. Towards Sustained High Growth and Lower Indebtedness
This section discusses two major remaining challenges facing the public finances: further revenue reform; and the significant progress with the states’ fiscal adjustment. It closes by discussing the infrastructure gap.
3.1 India’s Revenue Adjustment
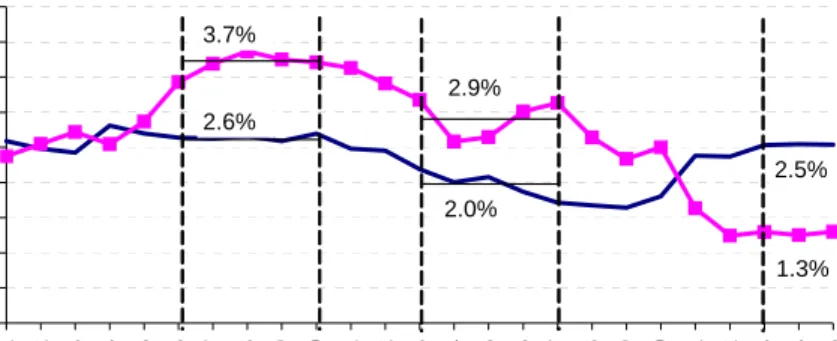
Table 5 shows the big decline in revenues after 1991, which has only been restored to pre-crisis levels very recently. We focus on a few main ideas in this section, as several good surveys exist.29 As alluded to above, there has been a major shift in the tax structure post-1991, and a fall in indirect taxes has been a major factor in lower revenues after 1991. Figure 6 shows that compared to 6.3 percent of GDP in the second half of the 1980s, customs and excise had fallen to 3.8 percent of GDP in recent years.
Table 5: General Government Fiscal Trends (% of GDP) 85/86-89/90 Avg. 8th Plan Avg. 9th Plan Avg. 10th Plan 02/03-05/06 Avg. 02/03 03/04 04/05 05/061/ Revenues 19.4 17.9 17.0 18.6 17.8 18.1 19.1 19.6 Current expenditure 2/ 22.0 21.5 22.9 23.7 24.6 24.0 23.5 22.9 Social services 5.4 5.0 5.5 5.3 5.3 5.1 5.4 5.3 Economic services 6.5 5.8 5.5 6.0 6.3 6.4 5.7 5.6 General services 9.5 10.3 11.6 12.1 12.6 12.1 12.0 11.7 Capital expenditure3/ 6.6 3.7 3.7 3.4 2.9 3.1 3.3 4.1
Gross fiscal deficit 9.2 7.2 9.7 8.5 9.8 9.1 7.6 7.4
Memo Primary deficit 5.4 2.1 4.0 2.2 3.2 2.7 1.4 1.3 Revenue deficit 2.6 3.6 6.0 5.1 6.8 6.0 4.4 3.3 Interest 3.8 5.1 5.7 6.3 6.5 6.4 6.2 6.1 Interest / Revenue % 19.4 28.5 33.6 34.0 36.8 35.6 32.5 31.3 (Irrigation+power+transport)/GDP 4.7 3.5 3.4 4.1 3.8 4.9 4.1 3.6
(Interest+ admin.+ pensions)/GDP 6.3 8.1 9.2 9.9 10.2 9.9 9.8 9.8 (Interest+ admin.+ pensions)/Revenue 32.6 45.1 54.2 53.5 57.6 54.9 51.5 50.0
Notes:
1/ Revised estimates for the center and budget estimates for the states
2/ Refers to Revenue expenditure in the budget
3/ Refers to Capital outlay and net loans and advances from the center to the states
Sources: GOI budget documents, Handbook of Statistics on Indian Economy (RBI)
Today, India’s tax system exhibits the following salient features:30 (i) a high reliance on
indirect taxes (notwithstanding the large decline); (ii) low average effective tax rates;31 and (iii)
high marginal tax rates. An encouraging feature of the 1990s is that AETRs on labor and capital have been gradually increasing even though statutory tax rates have been lowered. In other words, tax administration has improved and compliance has gone up. Nevertheless, there is still considerable scope for raising AETRs, which are low because tax productivity is low. For example, calculations for 2001 reported in Poirson (2006, Table 3a) show that corporate income tax (CIT) productivity measured as the ratio of the effective to the statutory CIT rate was less than 10 percent compared to an OECD average of 30 percent!
30 The discussion here is chiefly a summary of main results from Poirson (2006).
31 The AETR is actual tax collections divided by the potential tax base; or, equivalently, the statutory tax rate times the actual tax base divided by the potential tax base. If the ratio of the actual tax base to the potential tax base is very small, then raising this substantially could increase AETRs even if statutory (and hence marginal) tax rates are decreased, which typifies the Indian case.
Figure 6. Excise and Customs Duties (% of GDP) 0.0 0.5 1.0 1.5 2.0 2.5 3.0 3.5 4.0 4.5 1980 -81 1981 -82 1982 -83 1983 -84 1984 -85 1985 -86 1986 -87 1987 -88 1988 -89 1989 -90 1990 -91 1991 -92 1992 -93 1993 -94 1994 -95 1995 -96 1996 -97 1997 -98 1998 -99 1999 -00 2000 -01 2001 -02 2002 -03 2003 -04 2004 -05
Excise Duty Customs Duty
3.7% 2.0% 2.6% 2.9% 1.3% 2.5%
Source: Handbook of Statistics on Indian Economy, Reserve Bank of India
At the same time, marginal corporate taxation is high. Poirson (2006) computes two standard indicators based on the Indian tax code, the marginal effective tax wedge (METW) between the pre- and post-tax return on capital and the marginal effective tax rate (METR), defined as the ratio of the wedge to the required real pre-tax rate of return. These are low for India largely because of low personal taxes on dividends and the elimination of the tax on long-term capital gains; corporate tax rates tend to be higher than average. At the same, there is considerable variance across sectors and types of financing because of exemptions and
differences in depreciation allowances. In particular, Poirson (2006) argues that there is a bias against financing investment through new equity or retained earnings and in favor of debt financing. Reducing this bias is important because the DFIs, which have traditionally been the source of long-term investment funds, are restructuring to compete with banks and capital markets in the radically new environment of market-based pricing and allocation of funds. As Mohan (2004, p. 329) notes, “Lending by the DFIs has fallen continuously over the last 5-7 years.” This might mean a paucity of long-term funds to finance investment, especially for small and medium-size firms.
The fact that AETRs are low because of a low tax base suggests that direct tax revenues can be raised while lowering statutory and hence marginal tax rates. The way to do this would be to eliminate exemptions while improving tax administration, as both the Chelliah 1991, 1992, 1993 and Kelkar 2002 tax committee reports have recommended. The results could be striking— for example, GoI’s 2004 road map for implementing the Fiscal Responsibility and Budget Management Act (FRBMA) foresees a virtual doubling of corporate tax revenue from 2.3 percent of GDP in 2003/04 to 4.2 percent by 2008/09 even while the CIT rate is reduced to 30 percent from over 35 percent in 2004.32 On indirect taxes, the plan is to introduce a national VAT on
goods and services (goods and services tax, GST), which would replace the existing state VAT, central sales tax CST, central excise duties and central service tax. All these measures would help complete the shift towards a broader tax base with lower marginal rates and higher AETRs. While there is considerable potential for increased revenue, especially as services are brought more fully into the tax base, IMF (2006, chapter III) cautions that the GST should be regarded only as a medium-run solution because of the many administrative pitfalls.
3.2 States’ Fiscal Adjustment
In 2000, the ratio of debt to own revenues for all India’s states combined stood at 203 percent.33 Canada was next with 189 percent, followed by Brazil with 170 percent and Pakistan with 100 percent. In addition to reducing this indebtedness, which is a source of vulnerability, existing fiscal deficits leave the state governments with little fiscal space even for productive new spending to support the current rapid growth. In spite of significant recent progress in fiscal adjustment, these challenges remain particularly acute in the poorer states, which have suffered greater variability in revenues, are more indebted and have high salary bills. Interest payments as a share of own revenues are nearly twice as high in poor states as in other states.
As Figure 7 shows, India’s states had a fairly constant fiscal deficit for most of the 1990s; but in 1998/99, the fiscal deficit jumped from 2.9 percent of GDP the previous year to 4.3 percent catalyzed by the 1997 CFPC award, around which level it then stabilized for the next 6 years or so.34 Despite central government control over state government borrowings being enshrined in
the Constitution, state governments were able to increase their borrowing by drawing on sources over which GoI exercises no active control: ‘small savings’, central government-owned financial institutions, and state provident funds. As a result, the state-level debt stock increased from 22.5 percent in 1991 to 33.5 percent in 2005. Off-budget liabilities, mostly in the power sector, also grew quickly – as did state government guarantees. In September 2003, state governments issued “power bonds” of approximately 1 percent of GDP (Rs 29,000 cores) cover the arrears of SEBs to the central Public Sector Undertakings as of October 1, 2001 in accordance with the provisions of the Ahluwalia Committee (“Report of the Expert Group, Settlement of SEB Dues”, May 2001).
Figure 7: State Deficits and Debt Levels
Debt as a share of GDP (left axis) and fiscal deficit as a share of GDP (right axis)
-5.0 10.0 15.0 20.0 25.0 30.0 35.0 40.0 90 -9 1 91 -9 2 92 -9 3 93 -9 4 94 -9 5 95 -9 6 96 -9 7 97 -9 8 98 -9 9 99 -0 0 00 -0 1 01 -0 2 02 -0 3 03 -0 4 04 -0 5 05 -06 R E -0.5 1.0 1.5 2.0 2.5 3.0 3.5 4.0 4.5 5.0
Debt/GDP Fiscal Deficit/GDP
Source: Reserve Bank of India (2005) and World Bank States Database
As also highlighted by Reserve Bank of India (2005), India’s poorer states have seen larger increases in their debt ratios over the past decade (Figure 8). As of March 2005, the debt to GSDP ratio was 53 percent in the poor states, versus 38 percent in the other states. India’s poorer
33 For the general government, the ratio is even higher at over 400% whereas for the poor states it is about 600%. Interest payments / own revenues are in excess of 60% for the poor states.
34 While large pay awards and revenue shortfalls were the immediate cause for the abrupt fiscal deterioration, the worsening in the current balance of the state governments can be traced to the early 1990s. The growing revenue deficit was prevented from translating into a higher fiscal deficit until the second half of the 1990s only because capital expenditure was compressed.
states have been more reliant on central transfers, and so they have suffered more from a
reduction in these transfers during the nineties.35 They have also been proportionately harder hit by the implementation of the CFPC award, which began in 1998 in the states.
Figure 8: Debt stock as a share of GSDP
0 10 20 30 40 50 60 199 3/ 94 199 4/ 95 199 5/ 96 199 6/ 97 199 7/ 98 199 8/ 99 199 9/ 00 200 0/ 01 200 1/ 02 200 2/ 03 200 3/ 04 200 4/ 05 0 0.5 1 1.5 2 2.5 3 3.5 4 4.5 5
Debt / GSDP (poor states)
Debt / GSDP (other states) Interest payments / GSDP (poor states) Interest payments / GSDP (other states)
Source: Reserve Bank of India (2005) and World Bank States Database
While, there are signs that fiscal deficits are now coming down significantly, especially in 2006/0736, and the debt-to-GDP ratio is stabilizing, the remaining developmental needs also
remain huge. Many desirable initiatives have been launched including for rural infrastructure (Bharat Nirman, NURM), employment (NREGA), education (SSA) and rural health (NRHM).
These need to be financed with some combination of higher taxes (or user charges) or lower and restructures expenditures (cutting other existing funding). The 2004 TFC recommendations in particular appear to be already helping to facilitate the development process.
The TFC was given an exceptionally wide remit, in particular coming up with a plan to lower states’ indebtedness and reform the borrowing regime. Its recommendations include a package of interest rate reductions on existing loans from the center and debt write-downs in return for adopting fiscal responsibility legislation and eliminating revenue deficits by 2008/09 while reducing the overall deficit to 3 percent of GSDP (implying that states’ capital expenditure will be 3 percent of GDP).37 The TFC proposed that the center move to a system of 100 percent
grants to the states; the only loans will be the pure pass-through of external assistance. States would have to borrow directly from the market without any cross-subsidy. As a result of the TFC’s proposals, there is a one percentage point increase in total taxes transferred to all states as a share of the government of India’s center’s tax take (from 29.5 percent to 30.5 percent). An even bigger increase is projected in grants: the average annual grant for all states is 143 percent higher during the TFC’s tenure (2005/06 to 2009/10), compared with the previous five-year period (2000–05).
35 In poor states central transfers account for half of all revenues, versus about a third in the other states. 36 Early estimates suggest that the consolidated state-level deficit has come down to around 2.5% of GDP in 2006/07.
37 The TFC has set up a Debt Relief Facility to replace the Fiscal Reforms Facility. The objectives of the two funds are the same, although the reward is now in the form of debt relief or restructuring rather than the cash grants given earlier. And the corpus of the Debt Relief Facility is much bigger than that of the Fiscal Reforms Facility, although it is still small relative to the size of the overall debt.
Nine of the ten grants that the Finance Commission has awarded are tied. Tied grants for maintenance (separate grants for roads, buildings, and forests) are conditional on states’
increasing their own spending in these areas, as are the health and education grants, which are only for the poorer states. The obvious challenge for the states is to ensure that these funds are productively spent, including through further strengthening of public expenditure management and financial accountability.
An important remaining issue on the borrowing side for states pertains to the rapidly growing “small savings” funds (largely savings mobilized through India’s post offices). States are compelled to borrow all the proceeds of small savings raised in their states, on which the interest rate is set artificially high. This amounts to a form of “forced borrowing,” which is expensive even for the least creditworthy states, and which teaches the states that they should borrow whatever is available, not what they can afford. Reforming small savings is the next important area of center-state fiscal reform.
Buoyant tax collections, following the introduction of the state-level VAT by most of the major states, along with higher central government transfers owing to the TFC reforms have helped the states to significantly reduce their combined deficits in 2005/06 and 2006/07. In aggregate, states are likely to meet most of the targets set out by the fiscal responsibility acts in 2006/07, two years ahead of schedule. Estimates for 2006/07 suggest that states have already achieved the target of eliminating the revenue deficit; and the consolidated fiscal deficit is also forecast to be less than 3% in 2006/07. However, performance among states remains divergent. Although progress so far is significant, risks remain: progress so far could for instance be seriously impacted by the Sixth Pay Commission pay awards.38
3.3 Creating Fiscal Space for Infrastructure
Infrastructure remains a constraint on private investment, especially in the manufacturing sector, two others commonly identified being rigid labor laws and major restrictions on
bankruptcy and exit of firms.39 Mohan (2002) argues that the latter two constraints serve as a
brake on the reallocation of resources towards labor intensive manufacturing, and eventually, on more rapid employment growth, which is essential in view of India’s demographics. We focus on infrastructure because of its fiscal implications, and start by giving an idea of the size of
investments involved.
38 Other risk factors also remain, including the large debt overhang, losses of State Public Sector Undertakings, and a lack of proper user charges.
39 Besley and Burgess (2004) find a negative impact of pro-worker labor regulation on output, employment, investment and productivity in the formal sector based on an analysis of data from Indian states for the period 1958-92.
Figure 9. Infrastructure stocks in India and China, 1998 and 2003 0 100 200 300 1998 2003 1998 2003 1998 2003 electricity generation, watts per person
km of paved roads per 100,000 hab
Number of fixed lines per 1000 people
India China
Source: World Development Indicators.
Figure 9 compares India and China. In 1980 India had higher infrastructure stocks— power, roads, and telecommunication