Detecting Wash Trade in Financial Market Using
Digraphs and Dynamic Programming
Yi Cao, Yuhua Li, Senior Member, IEEE, Sonya Coleman, Member, IEEE, Ammar Belatreche, Member, IEEE,
and Thomas Martin McGinnity, Senior Member, IEEE
Abstract— A wash trade refers to the illegal activities of
traders who utilize carefully designed limit orders to manually increase the trading volumes for creating a false impression of an active market. As one of the primary formats of market abuse, a wash trade can be extremely damaging to the proper functioning and integrity of capital markets. The existing work focuses on collusive clique detections based on certain assumptions of trading behaviors. Effective approaches for analyzing and detecting wash trade in a real-life market have yet to be developed. This paper analyzes and conceptualizes the basic structures of the trading collusion in a wash trade by using a directed graph of traders. A novel method is then proposed to detect the potential wash trade activities involved in a financial instrument by first recognizing the suspiciously matched orders and then further identifying the collusions among the traders who submit such orders. Both steps are formulated as a simplified form of the knapsack problem, which can be solved by dynamic programming approaches. The proposed approach is evaluated on seven stock data sets from the NASDAQ and the London Stock Exchange. The experimental results show that the proposed approach can effectively detect all primary wash trade scenarios across the selected data sets.
Index Terms— Directed graph, dynamic programming, market abuse, wash trade.
I. INTRODUCTION
S
URVEILLANCE of a financial exchange market forpreventing market abuse activities has been attracting significant academic and industrial attention after the financial crisis in 2008 and especially since the flash crash in 2010. The abuse of financial markets can occur in a variety of ways, all of which can be extremely damaging to the proper functioning and integrity of the market. Trade-based manipulation, where the manipulation tactic is carried out only by simply buying Manuscript received June 20, 2014; revised July 8, 2015 and September 10, 2015; accepted September 17, 2015. This work was supported by the companies and organizations involved in the Northern Ireland Capital Markets Engineering Research Initiative.
Y. Cao is with the School of Computer Science and Electronic Engineering, University of Essex, Colchester CO4 3SQ, U.K. (e-mail: [email protected]).
Y. Li is with the School of Computing, Science and Engineering, University of Salford, Salford M5 4WT, U.K. (e-mail: [email protected]).
S. Coleman and A. Belatreche are with the Intelligent Systems Research Centre, University of Ulster, Londonderry BT48 7JL, U.K. (e-mail: [email protected]; [email protected]).
T. M. McGinnity is with the Intelligent Systems Research Centre, University of Ulster, Londonderry BT48 7JL, U.K., and also with the School of Science and Technology, Nottingham Trent University, Nottingham NG1 4BR, U.K. (e-mail: [email protected]).
Color versions of one or more of the figures in this paper are available online at http://ieeexplore.ieee.org.
Digital Object Identifier 10.1109/TNNLS.2015.2480959
and selling [1], is one of the primary forms. Price and volume are usually two major objects to be manipulated, and the former format, price manipulation, is thoroughly studied in [2]–[6]. Another format of trade-based abuse is volume manipulation, the manipulation actions intending to increase the transaction volume for the purpose of giving a false impression of high trading volume on the market [1], [7]. The major form of volume manipulation is wash trade, which occurs when the same individuals or a group of collusive clients are on both sell and buy sides of a financial instrument (i.e., stock) trading. While there is no beneficial change in ownership, wash trading has the effect of creating a misleading appearance of an active interest in the stock [8].
A wash trade usually does not contain any illegal actions, such as financial rumor spreading and market resource squeez-ing, but it is carried out only by legitimate trading activities. With carefully designed buy and sell order sequences, manipu-lators can make the transaction follow their expectation. In the wash trade tactics, a series of orders is often submitted as a number of order pairs. The monitoring of any single leg of one pair or part of a pair would not be concluded as collusive trad-ing. Most of the existing related literature studies the collusive cliques according to the activity similarity, which is defined under certain assumptions. Very few address the quantitative analysis of the features of different wash trade scenarios and the corresponding detection approaches. This paper follows on from our previous work on the trade-based manipulation [2] and proposes a detection approach that considers a complete spectrum of the wash trade detection. The main contributions of this paper are as follows. The problem of wash trade is thoroughly discussed, including the analysis of all possible scenarios, from which the key features are extracted and quantified. This provides a clear problem formulation and explains the significance of exploring the conceptual models. To the best of our knowledge, this is the first theoretical study of wash trade market manipulation. A two-step algorithm is proposed to detect wash trade activities. The proposed two steps, which consist of discovering the matching orders and further recognizing the collusions, are both formulated as a combinatorial optimization problem and solved by one unified algorithm. The extensive experiments have been conducted on real data from both USA and U.K. markets for testing the practicability of the proposed wash trade detection method in real life.
The remainder of this paper is organized as follows. Section II provides a review of wash trade manipulation This work is licensed under a Creative Commons Attribution 3.0 License. For more information, see http://creativecommons.org/licenses/by/3.0/
TABLE I LIMITORDERSEQUENCES
and the corresponding detection methods. The features of all types of wash trade scenarios as well as the proposed detection approach are analyzed, formulated, and characterized in Section III. The performance evaluation of the proposed approach is provided in Section IV. Finally, Section V con-cludes the paper and discusses potential improvements and future work.
II. WASHTRADE ANDITSDETECTION
A. Wash Trade
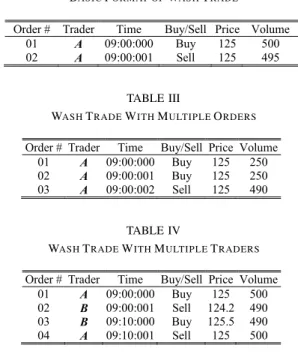
In capital markets, limit orders indicate the trading intention of the trader to buy or sell the volumes of a specific equity at a specific price or better [9] (better price refers to higher selling prices or lower buying prices). The transaction occurs when eligible orders meet order-matching rules. The outstanding unmatched limit orders are recorded in the order of books of the exchange market, in which the highest buying price decides the best bid price while the lowest selling price is the best ask price. The gap between the best bid and the ask price is defined as bid–ask spread [10]. In most of the exchange markets, the matching rule selects the earliest order with the matched price for execution. In the following examples in Table I, three limit orders, #01, #02, and #03, are submitted in sequence to the exchange market. According to the matching rule, order #03 is first executed by 300 shares with #01, which has the same price but is earlier than order #02, and then, the remaining 100 shares are executed with #02.
Wash trades follow the same matching rules as legitimate transactions with the special feature defined as the Financial Conduct Authority (FCA) as no change in beneficial interest or market risk, or the transfer of beneficial interest or market risk only between parties acting in concert or collision, other than for legitimate reasons [11]. The Committee of European Securities Regulators (CESR) further indicates that a wash trade is the deliberate arrangement in concert or collusion [12]. On August 28, 2014, Chicago Mercantile Exchange (CME) released a new rule [adopted by U.S. Commodity Futures Trading Commission (CFTC)], termed Rule 575 [13]. Rule 575 clearly states that no person shall enter messages to the market as prearranged collusion (wash trade) with intent to mislead other participants. The definition in Rule 575 in the U.S. shows the consistent regulation to CESR in Europe that the prearranged collusive trading is wash trade and shall be strictly prohibited. Although clearly defined the wash trade activity, the regulators (FCA, CESR, and CFTC) do not provide any quantitative approach on detecting such activities. As illustrated by the example in Table II, the simplest format of wash trade is the simultaneous submission of two opposite limit orders with identical price (125 in Table II) and similar
TABLE II
BASICFORMAT OFWASHTRADE
TABLE III
WASHTRADEWITHMULTIPLEORDERS
TABLE IV
WASHTRADEWITHMULTIPLETRADERS
volume (495 in Table II) from one trader A. By the matching rules, orders #01 and #02 match and 495 shares are executed immediately after the submission. In addition, the wash trade actions can also be carried out by multiple orders and traders as the example formats, as shown in Tables III and IV. In Table III, order #03 is matched and executed with #01 and #02 sequentially so that a transaction of 490 shares can be artificially created by trader A. In Table IV, two transactions are created by four matched orders between traders A and B. After the transactions (450 matched volumes), there is almost no effective transfer of beneficial interest among the two traders.
Summarizing the typical formats in Tables II and IV as well as the definitions from the regulators, we obtain three features of a successful execution of a wash trade manipulation as follows.
1) Tight submission intervals between the matched buy and sell orders (to minimize the risk of the orders being unintentionally picked up by other traders).
2) Executable prices (to make the orders an immediate execution).
3) Mostly matched volumes (to minimize the risk of loss from the unmatched volumes executed with other traders).
Perfect matching orders, which have the same price, volume and submission time according to the summarized features, guarantee the execution but are obviously easy to be suspected as market abuse trade by the regulators. Therefore, to avoid being easily detected, smart manipulators design the wash trade orders to be mostly matched, such as the examples in Tables II and IV, where around 99% volumes are executed, respectively. Similarly, due to the matching rules in most exchange markets [14], that is buy (sell) limit order matching sell (buy) limit orders with the same price or lower (higher), the limit prices in the examples in Table IV, which are
different but executable, are also deliberately designed to avoid inspection. In Table IV, order #02 can be executed with order #01 at price 125, and order #04 can be executed with order #03 at price 125.5. The 125 and 125.5 are the execution prices of the two possible transactions; we refer to such prices as transaction prices.
B. Wash Trade Detection
To the best of our knowledge, there is no related work on the detection of wash trade activities in capital markets. The only analogous research is work on the detection of collusive cliques based on certain similar trading behaviors, which are defined as the buy/sell activities of equities in a similar way. A spectral clustering-based approach was developed [15], where a trading-behavioral network is generated and any behavior that deviates from the network is reported as an irreg-ularity. The assumption of this paper is the strong consistency between trader’s current behaviors and his/her previous trading network. A graph clustering algorithm for detecting a set of collusive traders has been proposed in [16]. The relationship between traders is constructed as a stock flow graph, and those with heavy trading within their network are clustered as a collusion set.
A new trading collusion detection approach, the correlation matrix of one trading day, was presented in [17], where the trader behavior was represented by an aggregated time series of signed volumes of submitted orders. The similarities of behaviors among multiple traders are measured by Pearson’s product-moment coefficient, and the cliques with a coefficient higher than a user-specified threshold were considered as suspicious collusions. The experiments of this study evaluated the real order data of futures traded in the Shanghai Futures Exchange. The signed order volume is constructed by vol-umes and directions (buy/sell) of the order. The order price information is ignored according to the assumption that the order prices are not related to the trader’s behaviors [17]. However, the market impact measure shows that the order price significantly impacts the market [18] so that the market moves caused by the traders’ own actions (orders) become the principal part of the transaction costs [19]. It is, therefore, unacceptable to ignore the order price information, which not only distinguishes traders’ intention, but is a key feature of wash trade manipulation tactics.
A technique developed by the CME to prevent wash trades at the engine level was rolled out in the middle of 2011 [20] and updated in the summer of 2013 [14]. However, it only monitored the same-priced buy/sell orders from trading accounts with the same beneficial ownership [14] (example in Table II). The lack of the surveillance mechanisms for wash trades with multiple orders or traders (example illustrations in Tables III and IV) left it possible for collusive parties to create a number of transactions that give a false appearance of large trading volumes.
In December 2012, a wash trade case was manu-ally inspected and documented by the Securities and Exchange Commission of Pakistan [21]. In March 2013, the U.S. regulators started to investigate traders acting as both
buyer and seller in the same transactions and reported that several hundred potential wash trades occur each day on CME and Intercontinental Exchange [20]. In June 2012, the Hong Kong financial regulator claimed that the attempts of entering wash trade or matched trade were financial manipu-lation crimes whether or not the wash trade or matched trade in fact has, or is likely to have, the effect of misleading appear-ance [22]. This ruling was also accepted by Rule 575 [13] and the Market Abuse Directive II [23]. This rule provided an aggressive restriction: any attempts of wash trade or matched trade are financial crimes.
To date, academic research has mainly focused on detecting the overall trading collusions according to defined analogous behaviors. The detection of mass market behaviors can hardly reach a precise and determinable manipulation detection result, but it can show a collective correlation of trading activities among different trader clusters. Industry techniques merely covered the simple format of wash trade scenarios. A slightly improved manipulation tactic can bypass the wash trade monitoring. However, no efforts appear to have been made in the analysis of wash trade strategic behavior or the design of a detection approach identifying any tactics of attempts of wash trade. Given the gap in the field, it is this aspect of market manipulation that this paper seeks to address. This paper proposes a wash trade detection algorithm that monitors all incoming limit orders that can possibly attempt to compose a wash trade. Recognizing such attempts helps the regulators to prevent market abuse by a strict regulation.
III. WASH TRADEDETECTIONMETHODOLOGY
A. Analysis Terminologies
To analyze the wash trade strategic behaviors, the definitions and terminologies in [24] are adopted and revised to formalize the trading properties and market changes. The effect of wash trade can be represented by the position of the whole trading collusion, where position is the amount of equities held by a trader. As the wash trade is merely fraudulent activities rather than true trading actions, each participated trader tends to maintain his own positions unchanged for minimizing the unnecessary financial loss, and therefore, the position of the whole wash trade collusive group is also not changed. During the wash trade process, the position change is caused by a number of orders from the trader in the collusive group and can be defined as
Position+Orders→Position. Position is comprised of a sequence of orders
Position= {(Order1), (Order2) . . . (Ordern)} where each order is defined as
Order=(Trader_ID,Type,Price,Volume)
where Type=buy|sell. Representing the order Type buy and sell by positive and negative signs, respectively, and affixing the sign to the Trader_ID and Volume, a sell order can be represented as
By this, the orders in Table IV can be illustrated as Position= {(A,125,500), (−B,124.2,−450)
(B,125.5,450), (−A,125,−500)}. The buy/sell orders having matched prices can be merged as
Position = {(A−B,125,500−450=50)
(B−A,125.5,450−500= −50)}. As discussed in Section II-A, prices 125 and 125.5 are represented as transaction prices. The difference between the executable limit prices is calculated as the margins of the transaction prices. In this case, the transaction price 125 has the margin 125−124.2 = 0.8, and the transaction price 125.5 has the margin 125.5−125 = 0.5. We merge the potential transactions who price margins are overlapped, i.e., 125+0.8 and 125.5 + 0.5 are overlapped. After the merge, we rerepresent the positions, i.e., the margin between 124.2 and 125.5 is represented as: 124.85±0.65
Position= {A−B+B−A,124.85±0.65,50−50} = {“0,” 124.85±0.65,0}
where the Trader_ID calculation is carried out as a symbolic operation, and 0.65 is represented as the transaction marginδT and 124.85 is the transaction price PT. The zero-valued signed trader ID implies that each collusive trader transacts at both sides (buy and sell) of the market and the zero signed volume indicates the total amounts of the transactions in both sides are zero. No equity is really bought or sold. Therefore, the unchanged position, represented through zero-valued signed trader ID and signed volume, indicates the wash trade activities in certain collusion.
B. Wash Trade Among Multiple Traders
As the FCA and CESR pointed out in their consultation reports [11], [12], it is difficult to distinguish a wash trade, because the format of trading collusions varies and the collusive transactions can be buried in the mass numbers of normal trading activities, such as the complex network reported by NANEX on May 31, 2013 [25], where vertices illustrate traders and directional connections among vertices represent the transaction between traders. We utilize this idea in [25] and represent submitted limit orders (from a number of traders) by a graph, where vertices represent traders, and the short arrows affixed to the vertex represent the orders submitted by the trader (buying and the selling orders are represented by arrows pointing inward and outward, respectively) and the dotted arrow lines represent the possible executed orders according to the matching rule discussed in Section II-A. An example of wash trade action mixed up with legitimate trading orders is shown in Table V and illustrated by the graph in Fig. 1. Among the 14 orders submitted by 6 traders in this example, four pairs (#1–#4 in Table V) of wash trade orders are deliberately submitted by four traders with tight submission intervals, executable prices, and mostly matched volumes so that the orders in each pair are suspiciously easy
TABLE V
EXAMPLE OFWASHTRADE IN ASEQUENCE OFLIMIT ORDERSFROM ANUMBER OFTRADERS
Fig. 1. Closed connection cycle of traders and the possible execution flow along the cycle in wash trade action (14 orders in Table V are mapped to the graph).
to match and execute. In Fig. 1, the possible executions of the orders are illustrated by four dotted arrow lines: each dotted arrow line connecting one pair of matched orders, and the arrowhead indicating the transaction direction of the financial equity, i.e., A pointing to B means trader A sells shares of equity to trader B. From the illustration in Fig. 1, when participating wash trade activities, traders (A, B, C, and D) connect as a closed simple cycle (dotted arrow lines) and continuous transactions among the traders flow throughout the cycle in one single direction (either clockwise or counterclockwise) with each trader along the pathway passing the parcel [26]. After a complete transaction loop, the beneficial interest has been transferred across the collusive group, and no traders in the group have an actual position change.
The no beneficial interest change of all collusive traders in wash trade activities can also be calculated by the terminolo-gies defined in Section III-A as (2).
Equation (2) shows the possible execution [dotted arrow line (1) in Fig. 1] of two orders in pair #1 in Table V due to the matching rule, execution occurring on earliest orders with matched prices, as discussed in Section II-A. Similarly, the executions of matched pairs #2–#4 in Table V [dotted arrow lines (2)–(4) in Fig. 1] are represented by (2). The aggregated results of those executions are calculated in (2), where 50 shares of volumes are remained due to the mostly matched volumes tactic between any two smart manipulator neighbors to avoid regulatory inspections [26]. The unmatched volumes (for example, 2%) can then be defined
TABLE VI
EXAMPLE OFMATCHEDPAIRCOMPOSED OFMULTIPLE ORDERS INWASHTRADEACTIVITY
as the matching margin(δv). Similarly, the differences between the limit order prices and the transaction prices can be defined as the limit price margin(δp)and the transaction margin(δTp), respectively. In the following case, δTp =0.005:
Position= {(−A,125.00,−1450), (B,125.01,1500) (−B,124.95,−1500), (C,125.01,1450) (−C,125.00,−1450), (D,125.01,1500) (−D,125.01,−1450), (A,125.01,1450)} = {(−A+B,125.00+0.01,+50) (−B+C,124.95+0.06,−50) (−C+D,125.00+0.01,+50) (−D+A,125.01+0,0)} = {‘−A+B−B+C−C+ D−D+A 124.95+0.06,50−50+50+0} = {‘0’,125.005±0.005,+50}. (2) Furthermore, as shown in Table V, the time intervals between different pairs can vary as random events occurred in one single trading day. To avoid being detected as suspiciously trading action, in practice, smart manipulators tactically place the pairs at separated time points as the examples in Table V, where the time differences among any two pairs are completely different and random. To achieve this, manipulators carefully design each pair of matched orders to minimize the possible financial loss from price changes in the time period (i.e., from 9:00 to 10:50 in Table V) and to maintain the positions of their whole collusive group at zero. The separated arrangement of the matched pairs increases the complexity of detecting a wash trade under a mixture environment of both normal and manipulative trades.
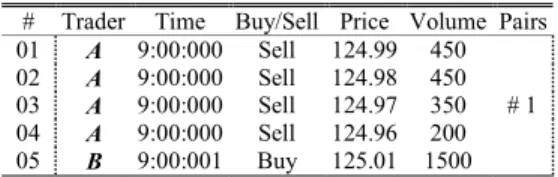
Additional to the example in Table V and Fig. 1, the matched pairs among any two manipulators can also be constructed by a number of limit orders, as shown in Table III, rather than simply matched one-to-one sell and buy orders (as the pairs in Table V). For example, the matched pair #1 in Table V can be constituted by four selling orders and one buying orders, as shown in Table VI and Fig. 2.
In the examples, the submission of four sell orders is followed tightly by one large buy order, which matches, potentially executes, and removes all (or most) volumes of previous four sell orders. The graph of the traders and the transaction flow are revised in Fig. 2, where the #1 matched pair between A and B is illustrated by four short outward arrows affixed to A connecting with one short inward arrows affixed to B through the dotted arrow and other parts of the structure of the whole closed cycle of the traders is remained.
Fig. 2. Multiple matched orders between two manipulators in wash trade action (14 orders in Table V and 5 orders in Table VI are mapped into the graph).
In the example in Table VI, since the buy order #05 is submitted later than the sell orders, it will be executed at the prices of four sell orders, i.e., order #05 will be first executed as 450 shares at 124.99 with order #01, and then, another 450 shares executed at 124.98 with order #02 and so on.
C. Wash Trade Features
From the discussion in Sections III-A and III-B, the strategy that constructs a wash trade activity has the following two key features.
Feature 1: Matched orders—as the first step of wash trade
manipulation, traders deliberately submit the matched orders to the market in tiny time intervals to guarantee the execution; those orders can be one-to-one (examples in Table V) or one-to-many matched (example in Table VI); this feature refers to dotted arrow lines in Figs. 1 and 2.
Feature 2: Closed transaction cycle—any single execution
of the matched orders does not refer to a wash trade manip-ulation unless those executions constitute a closed cycle as illustrated in the examples shown in Figs. 1 and 2; this feature refers to closed cycle of dotted arrows among the traders in Figs. 1 and 2.
Considering the example in Table V, the manipulators set up the matched orders from the #01 order at time 9:00:000, but the wash trade is not completely constructed until the submission of the #12 order at time 10:50:001, which closes the transaction cycle. Therefore, a wash trade can be detected through detecting the matched orders and closed cycle in two steps.
Step 1: Detect the suspiciously matched order pairs S
according to the matching rule and wash trade features, tight submission intervals, executable prices, and mostly matched volumes
Order Pair= Orders=+Tm−Tn,PT±δTp,±δv where+Tm−Tn represents trader Tn selling shares of equity to Tm andδv andδTp represent the matching margin of volume and transaction price PT.
Step 2: Among S, find the order pairs whose transaction
fulfill the condition Position= k∈S OrderPairk =“0,” PT±δTp,±δv a wash trade alert is triggered.
To further formulate those features, we define the #k order L submitted by trader Tn at time tk as
Lk=(tk,±Tn,Pk,±Vk)
where Pk and Vk are the #k order price and volume, respec-tively, and the positive and negative signs±represent buy and sell operation. The matching margin δ is defined as a vector
δ = [δp, δt, δv]with three small positive values for price, time, and volume, respectively. If buy order #K is matched with K−1 sell orders from #1 to #K−1, their features have the following.
1) Tiny time interval
|t1−tK|< δt. (3)
2) Executable tiny price difference
PK−min(P1, . . . ,PK−1) < δp. (4) 3) Mostly matched volume
K−1 k=1 Vk−VK < δv. (5)
If K orders among N traders construct wash trade action, their features meet the following condition, where rnk is the indicator that if order #k from trader Tn is a sell order, then
rnk = −1, and rnk= +1 for buy order: Position = N n=1 rnkTn,PT±δTp,±δv =“0,” PT±δTp,±δv . (6)
The features in (2)–(5) are detected in Step 1, and the feature in (6) is detected in Step 2.
D. Problem Formulation
To discover the wash trade before it completely occurs (fulfilling the recent regulations on preventing the attempts of wash trade), the detection approach is applied to the limit order streams instead of the trade records. The order stream is the sequence of limit orders received by the trading platform from numerous traders. The stream is updated by the order event, which could be submission, modification, cancellation, or execution. As shown in Table I, an order includes ID, trader ID, time, buy/sell sign, price, and volume. In this paper, we assume that the orders in the stream are on one specific stock. Thus, the stock information in the stream can be ignored once the specific stock is determined. This assumption, on one hand, narrows the scope of this study specifically on the underlying problem and, on the other hand, conforms the practical trading platform environment, where the algorithm can be easily applied to selected equity.
Step 1, detecting the suspiciously matched order pairs according to (3)–(5), is termed coarse detection, while
Algorithm 1 Wash Trade Detection – Pre-Organization
WASH_TRADE_DETECT(Lk) 1 Qs= ∅;Qb= ∅
2 while Lk is a valid limit order
3 if Lk is buy 4 Push Lk into Qb 5 while Qblength> θT 6 Pop Qb,1 to maintainθT 7 else 8 Push Lk into Qs 9 while Qs length> θT 10 Pop Qs,1to maintain θT
Step 2, recognizing the closed cycle based on (6), is termed fine detection. The limit order stream is then required to be preorganized to commence with those two tasks. A physical time sliding window sizedθT is specified, and the trading order stream can be split into two queues of consecutive orders: 1) buy order queue, Qb and 2) sell order queue, Qs each of which maintains a size θT. That is, if a new order Lk is a buy order, push it into Qb; otherwise push it into Qs. If the length of the updated queue is larger thanθT, pop the earliest orders to maintain the length of the sliding window. The algorithm is described in Algorithm 1. Since the order stream is measured in order event time,θT is maintained by calculating the difference between the physical time stamps of the first and the last orders in the queue. Hence, the number of orders in each queue ultimately depends on the underlying frequency of order activities and differs across time (Algorithm 1 is named WASH_TRADE_DETECT, because it will involve all detection subfunctions, which are discussed in follow-up sections).
The intention of the wash trade, increasing transaction volume, indicates that the wash trades are usually associ-ated with large-sized orders. Consequently, the orders with volumes smaller than a predefined threshold θV are ignored, where the threshold can be set up according to the require-ments of the detection solidness. Given the limit order queues Qb and Qs, the coarse detection can then be formu-lated as follows. For a large incoming order, examine in the opposite order queue for one or multiple potential matching orders, which are characterized by (3)–(5). The result of the coarse detection comprises all order combinations matched with the incoming order. Collusions may exist among those combinations.
Similarly, the fine detection can be formulated as follows. Given the matched order pairs, find certain sets of pairs in which the sum of signed trader ID and signed volume have zero values as the illustrations in (6). Defining coarse detection and fine detection as the function COARSE_DETECT and
FINE_DETECT, respectively, the wash trade detection is
further designed in Section III-E.
E. Coarse Detection—Matching Search
The matching relationship of wash trade order pairs is summarized in (3)–(5). In the coarse detection process, three
Algorithm 2 Wash Trade Detection Algorithm
WASH_TRADE_DETECT(Lk)
1 Qs = ∅;Qb= ∅; {Matched Pairs} = ∅; 2 while Lk is a valid limit order
3 if Lk is buy 4 Push Lk into Qb 5 while Qb length> θT 6 Pop Qb,1; 7 {MP}=COARSE_DETECT(Qs,Lk); 8 else 9 Push Lk into Qs 10 while Qs length> θT 11 Pop Qs,1; 12 {MP}=COARSE_DETECT(Qb,Lk); 13 if {MP} = ∅ 14 FINE_DETECT({MP});
Fig. 3. Coarse detection scheme.
conditions are sequentially checked to identify the potential matching.
The time matching marginδt in (3) shows the tiny interval between the orders in a pair. Setting the length of the order queue θT in Algorithm 2 and Algorithm 1 equivalent to δt, the coarse detection is designed as the illustration in Fig. 3: given the incoming order Lk, examining the opposite orders in previousδt(θT)period for potential matched orders, which are determined by price and volume margin, δp and δv. Algorithm 1 is then revised as Algorithm 2, which includes both the COARSE_DETECT and FINE_DETECT func-tions, where the {MP} is the detected matched pairs of
COARSE_DETECT.
In financial markets, only the orders following executable price rules [14] match and execute. Therefore, the price margin δpin (4) is constrained by the following rules.
Rule 1: Sell order matches buy orders with equal or higher
prices.
Rule 2: Buy order matches sell orders with equal or lower
prices.
The example in Table VI, where the #5 buy order price is slightly higher than all previous sell orders, shows Rule 2 of price marginδp. Considering the price marginδp, the coarse detection is designed as follows. Given the incoming buy (sell) order Lk, among all executable orders (in terms of the executable limit prices) in the previousδt(θT)period, find the order pairs having the best matching volumes.
The volume matching can be defined as a function
VOL_MATCH (Qt,p,Lk), where Qt,p is a set of orders
after being filtered by δt and δp. Given this,
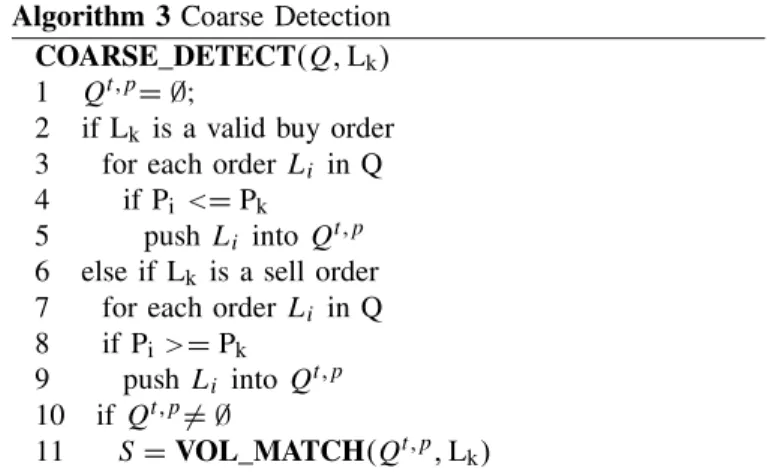
COARSE_DETECT (Q, Lk) is defined in Algorithm 3,
Algorithm 3 Coarse Detection COARSE_DETECT(Q,Lk) 1 Qt,p= ∅;
2 if Lk is a valid buy order 3 for each order Li in Q 4 if Pi <=Pk
5 push Li into Qt,p 6 else if Lk is a sell order 7 for each order Li in Q 8 if Pi>=Pk
9 push Li into Qt,p 10 if Qt,p= ∅
11 S =VOL_MATCH(Qt,p,Lk)
where Q contains all opposite orders in the previousδt periods and Lk is the incoming order. Based on the above discussions and the constraints in (5), the function VOL_MATCH
(Qt,p,L
k) is defined as follows: given incoming order Lk and a set of matched orders Qt,p, find subsets S of the order pairs from Qt,p such that
i∈S Vi −Vk ≤δv.
The number of limit orders in subset S is ns (nsis smaller than the size of Qt,p). In essence, the problem of VOL_MATCH is a practical case of a more general problem called the knapsack problem [27]–[29]. The name knapsack refers to the problem of filling a knapsack of capacity W using a subset of m items{1, . . . ,m}, each of which has a mass and a value, such as the total weight of the selected items is less than or equal W , and their total value is maximized. The volume matching problem can be viewed as a simplified form of the knapsack problem: given a capacity Vk (the knapsack size) and a set Qt,p of items, each having nonnegative size Vi, find all possible subsets S of items to eventually make
i∈S Vi −Vk ≤δv.
Due to the similarity of the two problems, the widely used approach solving the knapsack problem, dynamic pro-gramming, is employed in VOL_MATCH (Qt,p,Lk). The main principles of dynamic programming are that we have to come up with a number of subproblems so that each subproblem can be solved easily from smaller subproblems, and the solution of the original problem can be obtained easily once we know the solutions to all the subproblems [30]. Dynamic programming has been studied thoroughly in opti-mization problems in [31] and [32].
To solve the special form of the knapsack problem under
N limit orders and volume Vk, denoting the final subset of orders in an optimum solution for the original problem as SN, we then use the notation OPT (N,Vk) to denote the sum of the order volumes of the first N orders in the subset S under the constraint|OPT(N,Vk)−Vk| ≤δv. The sum in the first N −1,N −2, . . . ,1 orders can then be represented as OPT (N −1,Vk), OPT (N − 2,Vk), . . . ,OPT(1,Vk).
To determine OPT (N,Vk), we not only need the solution of OPT (N −1,Vk), but also need to know OPT (N −1,
Vk−VN), the best solution for the first N−1 orders with the remaining capacity Vk−VN, which constructs the constraint as |OPT(N−1,Vk)−(Vk−VN)| ≤δv. The recursion can then be summarized as follows: if LN is not one of the orders in the final subset SN, we can ignore the order N and determine
OPT (N −1,Vk); however, if LN is one of the orders, we need to seek an optimal solution for the remaining orders, 1, . . . ,N−1, which is OPT(N−1,Vk−VN). Using this set of subproblems, we are able to express the OPT(N,Vk)as a simple expression in terms of values from smaller problems. Therefore, the recursion is summarized as two conditions.
1) If Li∈/SN, then OPT(N,Vk)=OPT(N−1,Vk).
2) If Li∈SN, then OPT (N,Vk) = VN +
OPT(N−1,Vk−Vk).
This recursive process is reorganized based on the above two conditions to give Algorithm 4. This recursive algorithm can be used by invoking OPT(N,Vk)for N limit orders and the capacity Vk.
F. Fine Detection—Collusion Search
SN, orders from Q matched with the incoming order Lk, is the result of the coarse detection. To further detect the potential closed cycle of transactions, the orders in SN are represented by (1), where the trader ID and the volumes are affixed with trading direction signs. After the conversion,
SN is defined as ScN, the input of the fine detection algorithm FINE_DETECT. As discussed in Section III-A and (2), the order pairs with potential transaction prices with overlapped price margins are grouped together for potential collusion detection.
Detecting trader collusion is treated as discovering the combinations C from SNsuch that the sum of the signed trader equals zero as illustrated in (6). This process can be considered equivalent to a special case of the previously defined volume matching problem: given a capacity W = 0 (the knapsack size) and a set of signed trader pairs, each having a value (e.g.,{+A}and{−A}), select all possible subsets C of signed trader pairs are defined in Section A and can be implemented by operator overloading. The subset C is considered as trading collusion in a wash trade.
Algorithm 5, derived from Algorithm 4, provides the recur-sive solution for FINE_DETECT(ScN).
IV. EXPERIMENTS ANDEVALUATION
Evaluating a detection model usually relies on real data of both normal and abuse cases. However, due to the limited reports on wash trade manipulation and regulatory rules prohibiting the disclosure of illegitimate market data, the availability of the examples of wash trade behaviors in capital markets is far less than the availability of routine normal trading records. Therefore, to evaluate the proposed detec-tion model, it is acceptable to the financial industry that all the characteristic patterns of wash trade examples are reproduced, and then injected into original trading records to generate a mixed data set of normal and abuse cases [33].
Algorithm 4 Volume Matching Detection by Recursion
1 VOL_MATCH(Qt,p,Lk) // original limit order set Qt,p;
2 SN= ∅; // solution subset, initialized
to empty;
3 N =length(Qt,p); // N : size of Qt,p;
4 OPT(N,Lk) // N decreases on each
recursion step;
5 if N <1 or |Lk| ≤δv // if N reaches the last one orδv condition is satisfied;
6 return;
7 if |VN−Lk| ≤δv // if condition is satisfied, then orders
8 output SN; in SN is one solution;
9 push LN into SN // assume LN∈SN; 10 OPTN−1,VN−LN,v
;// recursively find solution by condition 2;
11 Discard LN from SN // assume LN∈/SN; 12 OPTN−1,Lnv; // recursively find solution
by condition 1; 13 end of OPT
14 return SN;
Algorithm 5 Collusion Search by Recursion
1 FINE_DETECTScN; // original signed trader set ScN
2 C= ∅; // solution subset, initialized to
empty;
3 N =lengthScN; sum =0; // N: size of ScN; 4 OPT(N,sum) // N decreases on each recursion
step;
5 if N<1 // if N reaches the last one, done
6 return;
7 if rT+sum=0 // if the sum of signed trader including current one is zero 8 outputC; // the signed trader in ScN is
a solution; 9 push rT into C; // assumetN∈
C;
10 OPT(N−1,sum+rT); // recursively find solution by condition 2;
11 Discard rT from C; // assumetN∈/
C;
12 OPT(N−1,sum); // recursively find solution by condition 1;
13 end of OPT 14 returnC;
Randomly synthesized exploratory manipulation cases can mimic any possibility of wash trade scenarios, i.e., we can generate the matched order at any time with any volume size as well as matching margins. Synthetic exploratory financial data are also accepted in academia for evaluating the proposed model when real market data are hard to collect [15], [16], [34]. In this paper, the experimental evalu-ation is composed of two parts.
Part 1: Experimental evaluation using original trading data
Part 2: Experimental evaluation using original trading data
sets injected with synthetically generated wash trade scenarios following the analysis in Section II-A.
A. Experiment Setup
The experimental data used in this paper involve real market data (trading orders) of seven stocks: Google (GOOG), Microsoft (MSFT), and Apple (AAPL) from NASDAQ, and First Quantum Minerals (FQM), Yamana Gold (YAU), Gazprom (OGZD), and Vodafone (VOD) from London Stock Exchange (LSE). The selection of these data sets is due to their active trading activities, relatively high trading volumes and more volatile price fluctuation, the factors that might increase the likelihood of market abuse across the exchanges [8], [35]. The data sets from NASDAQ cover messages over five trading days from June 11–15, 2012, and consist of more than 400 000 trading orders in total for each stock. The data sets from LSE cover May 23–27, 2011, and consist of more than 100 000 orders in total for each stock. Table I shows an excerpt of the trading records used in this paper. The wash trade detection algorithms are evaluated on the original seven data sets for detecting any transactions, which are suspiciously similar to wash trade manipulation. In addition, the typical wash trade activities are reproduced according to the discussions and examples in Tables V and VI and injected into those seven data sets for further experimental evaluations.
B. Determining the Marginal Parameters
As discussed in Section II-A, the submissions of the matched orders in a wash trade are usually within tiny time intervals δt so that the manipulated execution can compete against the action of normal traders who may pick the orders unintentionally [11], [14]. Consequently, the normal execution time shows a reasonable reference to the time interval δt, which otherwise is not available because of the lack of the statistical studies of the real wash trade cases.
Usually, the execution time of a limit order is strongly associated with its volume [8], [18], [36]. Therefore, a more reasonable measure of the average execution time of normal limit orders can be given by volume-weighted average execu-tion time (VWAT), defined as
TVWAT= j(Tj∗vj) jvj (7) where TVWATis the volume-weighted average execution time,
Tj is the execution time of order j , vj is the volume of order j , and j is each individual order [36]. In practice, if the wash trade orders are submitted with time intervals larger than
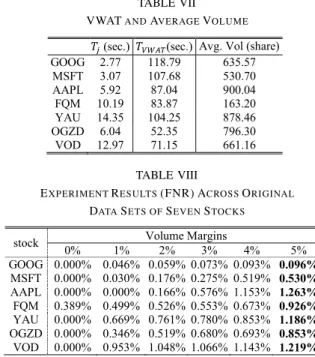
TVWAT, they are apparently easy to pick by other legitimate traders. Accordingly, by setting δt = TVWAT, this approach covers a time period for all possible wash trade activities. The order execution time Tj and TVWATacross the seven stocks in the test data set are calculated and summarized in Table VII.
Theoretically, the wash trade can be carried out by a large number of small orders. However, in practice, the wash trade orders are usually larger than the average volume of the normal trading orders, because a large number of orders can significantly increase the uncertainty of the order executions,
TABLE VII
VWATANDAVERAGEVOLUME
TABLE VIII
EXPERIMENTRESULTS(FNR) ACROSSORIGINAL DATASETS OFSEVENSTOCKS
which may bring a risk of loss if it does not follow the expected arrangements. Therefore, the average order volume of each stock is selected as the thresholdθV for the order volume filtering discussed in Section IV-D. The average volume across seven stocks is also calculated and summarized in Table VII. In addition, the volume matching margin δv is selected as percentages: 0%, 1%, 2%, 3%, 4%, and 5% indicating the ratio of not matching (1% refers identifying orders with 99% matching volumes). In the example, in Table VI, the #5 buy order volume (1500 shares) is∼96.7% matched with all previous sell orders (1450 shares). The price marginδp is unconstrained in the detection so that any orders following the price matching rules Rules 1 and 2 are scanned for possible matching pairs under the condition in (5).
Under the configurations ofδt, θV, δv, andδp, Algorithm 4 reflects the fact that given an order Lk, among all executable priced orders (unconstrained δp but following Rules 1 and 2) with volume not smaller than θV in a previous δt time period, find the matched orders that executed at least (1−δv)% volumes of Lk.
C. Part 1: Experiments on Original Datasets
In Part 1 experiment, the wash trade detection algorithm is evaluated on the original seven data sets using the parameters in Section IV-B. The evaluation shows the applicability of the proposed algorithms to real transaction data and also examines the legitimacy of the transactions in original data set. Since the original data sets do not contain any reported wash trade manipulation activities, it is assumed to only contain legitimate transactions. Thus, the evaluation measure is based on false negative rate (FNR)=(FN/FN+TP), which is based on false negative (FN), defined as normal cases detected as a wash trade, and true positive (TP), defined as normal cases detected as normal.
The results of the experiments (max FNR values on each stock data set are highlighted) are shown in Table VIII. It is clear that in each data set, some transactions are detected as
TABLE IX
FALSENEGATIVECASES OFSTOCKAAPL
suspicious wash trade actions, and the numbers of the detected actions increase across the increases of volume margins. Most of the data sets do not contain any suspicious actions when the volume margin is set to 0%, and the Apple stock shows the highest FNR rate (1.263%) at the 5% volume margin.
With careful inspection and consultation with the financial industry experts, we determined that the detected FN cases show very similar features to the wash trade actions although not reported by the regulators. The detected FN cases fall into two formats, as shown in Table IX.
In case #1, the trader Client12 sold 6600 shares to Client3 at price 58.0 and bought 6606 back 2 s later at the same price. The 99.9% matched transacted volumes, the 100% matched prices, and the closed cycle of the transaction directions between Client12 and Client3 make this case extremely suspicious and potentially be a wash trade action according to the regulation [9] although not reported yet. Detecting such suspicious activities shows the effectiveness of the proposed algorithms, although recognizing the real intention behind such cases requires more inspections from the regulators, which is out of the scope of our work. In case #2, Client1 sold 15 000 shares to Client5 at price 58.56 at market closing time and bought them all back at slightly higher price at market opening time on the next day. Those transactions also fulfill the conditions of a wash trade action except the trading dates. According to the suggestions from financial experts, case #2 refers to prearranged trading, which is defined as a sell is coupled with a buy back at the same or prearranged price that limits the risks [9]. The only difference between prearranged trading and wash trade is that the former is usually among merely two parties and may occur in different days and the latter can involve a number of collusive traders and usually occurs as intraday trading. When only targeting wash trade, the proposed algorithms can be applied on intraday transactions to avoid picking up the prearranged trading as case #2, although the prearranged trading is also illegal [9] and needs to be monitored and banned from the capital markets.
D. Part 2: Experiments on Data Sets With Injected Wash Trade
Testing with synthetic data can mimic any possible wash trade cases and can also evaluate the robustness of the pro-posed algorithms under any wash trade scenarios, i.e., random combinations of one or multiple traders wash trade activities.
1) Wash Trade Case Generation: The typical wash trade
activities are reproduced and injected in each stock data set. The activities are reproduced in two format groups:
Group 1: One order matched with single opposite order,
termed single-matching.
TABLE X
GENERATEDSINGLEMATCHEDWASHTRADECASES(δv=5%)
TABLE XI
GENERATEDMULTIPLEMATCHEDWASHTRADECASES(δv=5%)
Group 2: One order matched with multiple opposite orders,
termed multimatching.
Each group contains three different sets according to trader numbers in the wash trade collusion: 1) set #1 has examples with one trader in a trading collusion and 2) sets #2 and #3 have two and four traders in a trading collusion. To ensure a comprehensive assessment of the approach, in each set, volume matching marginδv is selected as a percentage of 0%, 1%, 2%, 3%, 4%, and 5% indicating the ratio of not matching (1% indicating the orders from two sides are 99% matching). There are ten examples for each combination of the above parameters.
The examples in Tables X and XI show an excerpt of the generated wash trade cases: 1) case #1: two traders with 5% single matched volumes; 2) case #2: four traders with 5% single matched volumes; and 3) case #3: two traders with 5% multiple matched volumes. The volume, time, and matching margin of the synthetic orders are all randomly generated. For example, in case 3 in Table XI, buy order volumevb in pair 1 is randomly generated (under condition:
vb ≥ θV), and all sell orders in pair 1 are also randomly generated under the condition that volume sum Vs of all sell orders satisfies:vb∗(1−δv)≤Vs ≤vb. The time of orders in pair 2 is also randomly generated as long as they are much later than the time of pair 1. Similarly, the prices of order in each pairs are randomly generated following the price matching rules discussed in Section III-E. Similar to the examples in Table VI, two order pairs in Table XI have different transaction prices. The buy order in pair #1 in Table XI will be executed with the previous four sell orders at 58, 58.01, 58.02, and 58.03, respectively. Therefore, the generated examples have different transaction prices within transaction margins.
Such random generation of synthetic cases provides the possibility of thorough evaluation of the proposed algorithms using any possible wash trade cases.
As discussed before, the models are tested on seven real stocks, each of which contains two groups of injected exam-ples. Each group has three sets (one, two, and four traders), and each set contains six margin configurations. Under each configuration, there are ten examples. There are overall 7×2×3×6×10=2520 different experiments carried out as a robust evaluation plan for the proposed detection model. The generated wash trade orders are then injected into the data of corresponding stocks making the test data a mixture of both normal and abuse patterns. The time intervals between different pairs are selected randomly as examples in Tables X and XI. For example, in case #1 in Table X, the time of pair 2 is randomly selected after the pair 1 occurs. In addition, the generated orders in each pair are separated by several normal orders in original data sets to mimic the practical case in the markets. This is a practical approach to simulate how these wash trade scenarios occur in the real world [37].
2) Performance Evaluation Metrics: The performance
eval-uation of the proposed model is based on two popular statisti-cal measures: 1) sensitivity (SEN) and 2) specificity (SPE). Both of them are based on the confusion matrix, where a false positive (FP) is defined as a wash trade case detected as normal; a true negative (TN) is defined as a wash trade case detected as wash trade, and an FN and a TP that are defined in Section IV-C. The SEN, defined as SEN=TP/(TP+FN), represents the rate of correctly detecting normal trading orders (also known as the TP rate), while the SPE, defined as SPE=TN/(FP+TN), refers to the rate of correctly detecting wash trade cases (also known as the TN rate).
3) Experimental Results: The experimental evaluations
across seven stocks are summarized in Fig. 4, where the average SEN and SPE values across different numbers of traders are illustrated against the margin values.
From Fig. 4, the SPE values for single matching show that the algorithm completely detects the single-matching cases, which is the simplest wash trade format and is appar-ently easy to detect. The SPE values for multimatching vary across the margins and the different stocks as the illustrations in Fig. 4.
The SPE values increase with the increase of the margins and approach 100% when the margin is higher than 5%. The result conforms to the design expectation of the detection approach. More possible collusions will be detected under bigger matching margins. As discussed in Section II-A, mostly matched (for example, 98%) orders might be built by smart manipulators for standing aside from the inspections. A big marginal value compensates this smart tactic, and the config-urability of the margin increases the practicability of the model in a real trading context.
The SEN values show more volatile results across the margins. In most experiments, the SEN values reduce as the margin increases indicating more normal activities incorrectly detected as wash trade cases. On the contrary, the highest SEN value appears at the zero margin value.
Fig. 4. Experiment results across seven stock data sets.
From the experimental results, it can be concluded that the proposed approach detects the primary wash trade scenarios effectively and consistently across the selected stocks with SEN values in a range of 97%–100%.
V. CONCLUSION
A wash trade activity detection approach is proposed after thoroughly studying the various scenarios of wash trade behav-iors. The analysis of the collusive activities in wash trades through a graph of traders with transactions represented by the directed connections among the vertexes shows the basic structure of the collusion among multiple traders following a closed cycle of the transactions among certain traders. Further studies also show that the limit orders in wash trades are usually submitted fast with mutually executed prices and matched volumes. According to the analyzed features, the proposed method is then split into steps defined separately in Algorithms 4 and 5.
There are two major innovations in the proposed method as follows.
1) Graph theory has been used to represent and model the collusive relationships of the traders in wash trade activities. The concluded fundamental structure of the closed-cycle structure within a trader graph simplifies the detection from the complexity of the collusive networks.
2) The wash trade order detection has been approached as a knapsack problem, which can be solved in two steps by the traditional dynamic programming approaches. Instead of only detecting the same-priced buy/sell orders in the engine level detection mechanism in CME, the proposed method determines the wash trade activities by considering the suspicious matched orders as well as the collusive groups, which are according to the trading activities in a certain time period rather than a tiny time interval in real-time detection. Therefore, the proposed approach best suits overnight detec-tion in real financial world. However, the rapidly growing trading frequency challenges detection mechanisms and hence implementing the proposed approach in real time in a compu-tationally efficient way will be the focus of future work.
REFERENCES
[1] F. Allen and D. Gale, “Stock-price manipulation,” Rev. Financial Stud., vol. 5, no. 3, pp. 503–529, Jul. 1992.
[2] Y. Cao, Y. Li, S. Coleman, A. Belatreche, and T. M. McGinnity, “Adap-tive hidden Markov model with anomaly states for price manipulation detection,” IEEE Trans. Neural Netw. Learn. Syst., vol. 26, no. 2, pp. 318–330, Feb. 2015.
[3] Y. Cao, Y. Li, S. Coleman, A. Belatreche, and T. M. McGinnity, “A hidden Markov model with abnormal states for detecting stock price manipulation,” in Proc. IEEE Int. Conf. Syst., Man, Cybern. (SMC), Manchester, U.K., Oct. 2013, pp. 3014–3019.
[4] Y. Cao, Y. Li, S. Coleman, A. Belatreche, and T. M. McGinnity, “Detecting price manipulation in the financial market,” in Proc. IEEE Conf. Comput. Intell. Financial Eng. Econ. (CIFEr), London, U.K., Mar. 2014, pp. 77–84.
[5] Y. Cao, Y. Li, S. Coleman, A. Belatreche, and T. M. McGinnity, “Detecting wash trade in the financial market,” in Proc. IEEE Conf. Comput. Intell. Financial Eng. Econ. (CIFEr), London, U.K., Mar. 2014, pp. 85–91.
[6] J. Zhai and Y. Cao, “On the calibration of stochastic volatility models: A comparison study,” in Proc. IEEE Conf. Comput. Intell. Financial Eng. Econ. (CIFEr), London, U.K., Mar. 2014, pp. 303–309. [7] F. Allen, L. Litov, and J. Mei, “Large investors, price manipulation,
and limits to arbitrage: An anatomy of market corners,” Rev. Finance, vol. 10, no. 4, pp. 645–693, Oct. 2006.
[8] D. Cumming, F. Zhan, and M. J. Aitken. (Sep. 2012). High Fre-quency Trading and End-of-Day Price Dislocation. [Online]. Available: http://dx.doi.org/10.2139/ssrn.2145565
[9] SEC. (Oct. 2011). Limit Orders. [Online]. Available: http://www.sec.gov/answers/limit.htm
[10] K. Menyah and K. Paudyal, “The components of bid–ask spreads on the London stock exchange,” J. Banking Finance, vol. 24, no. 11, pp. 1767–1785, Nov. 2000.
[11] FSA. (Mar. 2006). The Code of Market Conduct. [Online]. Available: http://www.fsa.gov.uk/pubs/hb-releases/rel52/rel52mar.pdf
[12] EU. (Jun. 2014). European Commission. [Online]. Available: http://ec. europa.eu/finance/securities/abuse/index_en.htm
[13] CME. (Aug. 2014). U.S. Commodity Futures Trading Commission. [Online]. Available: http://www.cftc.gov/filings/orgrules/ rule082814cmedcm001.pdf
[14] CME Group. (Jul. 2013). Market Regulation Advisory Notice: Wash Trades Prohibited—Rule 534. [Online]. Available: http://www. cftc.gov/stellent/groups/public/@rulesandproducts/documents/ifdocs/ rul070913cmecbotnymexcomandkc1.pdf
[15] M. Franke, B. Hoser, and J. Schröder, “On the analysis of irregular stock market trading behavior,” in Proc. Data Anal., Mach. Learn. Appl., Freiburg im Breisgau, Germany, 2007, pp. 355–362.
[16] G. K. Palshikar and M. M. Apte, “Collusion set detection using graph clustering,” Data Mining Knowl. Discovery, vol. 16, no. 2, pp. 135–164, Apr. 2008.
[17] J. Wang, S. Zhou, and J. Guan, “Detecting potential collusive cliques in futures markets based on trading behaviors from real data,” Neurocomputing, vol. 92, pp. 44–53, Sep. 2012.
[18] N. Hautsch and R. Huang, “The market impact of a limit order,” J. Econ. Dyn. Control, vol. 36, no. 4, pp. 501–522, Apr. 2012.
[19] ITG. (Jul. 2013). Global Cost Review Q1/2013. [Online]. Available: http://www.itg.com/marketing/ITG_GlobalCostReview _Q12013_20130725.pdf
[20] S. Patterson, J. Strasburg, and J. Trindle. (Mar. 2013). The Wall Street Journal. [Online]. Available: http://online.wsj.com/article/ SB10001424127887323639604578366491497070204.html
[21] N. Jamal. (Dec. 2012). LSE Broker Fined for ’Wash Trade’. [Online]. Available: http://dawn.com/news/771335/lse-broker-fined-for-wash-trade
[22] T. Loh and G. Cumming. (Jun. 2012). Market Manipulation: Safe Har-bour for Wash Trades and Matched Orders Upheld. [Online]. Available: http://www.timothyloh.com/publications/120606_market_manipulation_ cfa.html
[23] EU. (2015). European Commission. [Online]. Available: http://ec.europa.eu/finance/securities/prospectus/index_en.htm
[24] E. Tsang, R. Olsen, and S. Masry, “A formalization of double auc-tion market dynamics,” Quant. Finance, vol. 13, no. 7, pp. 981–988, Jul. 2013.
[25] NANEX. (May 2013). Chicago PMI. [Online]. Available: http://www.nanex.net/aqck2/4304.html
[26] M. J. Aitken, F. H. Harris, and S. Ji, “Trade-based manipulation and market efficiency: A cross-market comparison,” in Proc. 22nd Austral. Finance Banking Conf., Sydney, NSW, Australia, Nov. 2009, p. 18. [27] R. Andonov, V. Poirriez, and S. Rajopadhye, “Unbounded knapsack
problem: Dynamic programming revisited,” Eur. J. Oper. Res., vol. 123, no. 2, pp. 394–407, Jun. 2000.
[28] V. Poirriez, N. Yanev, and R. Andonov, “A hybrid algorithm for the unbounded knapsack problem,” Discrete Optim., vol. 6, no. 1, pp. 110–124, Feb. 2009.
[29] M. Zukerman, L. Jia, T. Neame, and G. J. Woeginger, “A polynomially solvable special case of the unbounded knapsack problem,” Oper. Res. Lett., vol. 29, no. 1, pp. 13–16, Aug. 2001.
[30] J. Kleinberg and É. Tardos, Algorithm Design, 1st ed. London, U.K.: Pearson, 2005.
[31] Z. Ni, H. He, J. Wen, and X. Xu, “Goal representation heuristic dynamic programming on maze navigation,” IEEE Trans. Neural Netw. Learn. Syst., vol. 24, no. 12, pp. 2038–2050, Dec. 2013.
[32] Y. Jiang and Z.-P. Jiang, “Robust adaptive dynamic programming and feedback stabilization of nonlinear systems,” IEEE Trans. Neural Netw. Learn. Syst., vol. 25, no. 5, pp. 882–893, May 2014.
[33] NANEX. (Jul. 2013). Exploratory Trading in the eMini. [Online]. Available: http://www.nanex.net/aqck2/4136.html
[34] Y. Ou, L. Cao, C. Luo, and C. Zhang, “Domain-driven local exceptional pattern mining for detecting stock price manipulation,” in Proc. PRICAI, Trends Artif. Intell., Hanoi, Vietnam, Dec. 2008, pp. 849–858.
[35] E. J. Lee, K.-S. Eom, and K. S. Park, “Microstructure-based manip-ulation: Strategic behavior and performance of spoofing traders,” J. Financial Markets, vol. 16, no. 2, pp. 227–252, May 2013.
[36] N. Hautsch and R. Huang. (Aug. 2011). Limit Order Flow, Market Impact and Optimal Order Sizes: Evidence From NASDAQ TotalView-ITCH Data. [Online]. Available: http://dx.doi.org/10.2139/ssrn.1914293 [37] L. Cao, Y. Ou, and P. S. Yu, “Coupled behavior analysis with applica-tions,” IEEE Trans. Knowl. Data Eng., vol. 24, no. 8, pp. 1378–1392, Aug. 2012.
Yi Cao received the B.Eng. degree in navigation
and control in aeronautics from Beihang University, Beijing, China, in 2002, the M.S. degree in com-puter science from Florida International University, Miami, FL, USA, in 2005, and the Ph.D. degree in financial machine learning from the University of Ulster, Londonderry, U.K., in 2015.
He was an Integrated Circuit and Hardware Engineer with Vimicro, Beijing, and Conexant Beijing Design Centre, Beijing, from 2005 to 2008. From 2008 to 2011, he was a Senior System Engi-neer with Ericsson, Beijing. He is currently a Lecturer in computational finance with the Centre for Computational Finance and Economic Agents, School of Computer Science and Electronic Engineering, University of Essex, Colchester, U.K.
Yuhua Li (SM’11) received the Ph.D. degree in
general engineering from the University of Leicester, Leicester, U.K.
He was a Senior Research Fellow with Manchester Metropolitan University, Manchester, U.K., and a Research Associate with the University of Manchester, Manchester, from 2000 to 2005. He was a Lecturer with the School of Computing and Intel-ligent Systems, University of Ulster, Londonderry, U.K., from 2005 to 2014. He is currently a Lecturer with the School of Computing, Science and Engi-neering, University of Salford, Salford, U.K. His current research interests include pattern recognition, machine learning, data science, knowledge-based systems, and condition monitoring and fault diagnosis.
Sonya Coleman (M’11) received the B.Sc. (Hons.) degree in mathematics, statistics, and com-puting, and the Ph.D. degree in mathematical image processing from the University of Ulster, Londonderry, U.K.
She has experience managing research grants (with respect to technical aspects and personnel) as both a Principal and Co-Investigator. In addition, she is a Co-Investigator on the EU FP7 funded projects RUBICON and VISUALISE. She is currently a Reader with the University of Ulster. She has authored or co-authored over 80 research papers in image processing, robotics, and computational neuroscience.
Ammar Belatreche (M’09) received the Ph.D. degree in computer science from the University of Ulster, Londonderry, U.K.
He was a Research Assistant with the Intelligent Systems Engineering Laboratory, University of Ulster, where he is currently a Lecturer with the School of Computing and Intelligent Systems. His current research interests include bioinspired adaptive systems, machine learning, pattern recognition, and image processing and understanding.
Dr. Belatreche is a fellow of the Higher Education Academy, a member of the IEEE Computational Intelligence Society (CIS), and the Northern Ireland Representative of the IEEE CIS. He is also an Associate Editor of Neurocomputing, and has served as a Program Committee Member and a Reviewer of several international conferences and journals.
Thomas Martin McGinnity (SM’09) received the
B.Sc. (Hons.) degree in physics and the Ph.D. degree from the University of Durham, Durham, U.K., in 1975 and 1979, respectively.
He was a Professor of Intelligent Systems Engi-neering and the Director of the Intelligent Systems Research Centre with the Faculty of Computing and Engineering, University of Ulster, Ulster, U.K. He was the Director with the University of Ulster’s Technology Transfer Company, Innovation Ulster, and a spin out company, Flex Language Services. He is currently a Dean of Science and Technology with Nottingham Trent University, Nottingham, U.K. He has authored or co-authored approximately 300 research papers and has attracted over £24 million in research funding.
Prof. McGinnity is a fellow of the Institution of Engineering and Technology and a Chartered Engineer.