TESIS DOCTORAL
The value of patent knowledge: Internal and
external valuation
Autor:
Juliana Pavan Dornelles
Directora:
Neus Palomeras Vilches
Doctorado en Empresa y Finanzas Departamento de Economía de la Empresa
TESIS DOCTORAL
The value of patent knowledge: Internal and external valuation
Autor: Juliana Pavan Dornelles
Directora: Neus Palomeras Vilches
Firma del Tribunal Calificador:
Nombre y apellidos Firma Presidente:
Vocal:
Secretario:
Calificación:
© 2017
Juliana Pavan Dornelles All Rights Reserved
CONTENTS
Acknowledgements ... 10
Abstract ... 11
1. Why are they hiding? Patent secrecy and patenting strategies 1.1 Introduction ... 14
1.2 Theory and hypotheses development ... 17
1.3 Data and measures ... 22
1.3.1 Data ... 22
1.3.2 Dependent variable... 23
1.3.2 Independent variables... 24
1.3.2 Control variables ... 25
1.4 Empirical Results ... 27
1.5 Additional analysis and robustness tests ... 31
1.6 Discussion and conclusion ... 36
2. Patent value in financial markets: An Event Study 2.1 Introduction ... 41
2.2 Theoretical background ... 43
2.3 Data and methodology ... 47
2.3.1 Event study ... 47
2.3.2 Patent grant data ... 49
2.4 Empirical Results ... 50
2.4.1 Patent grant event ... 50
2.4.2 Market anticipation hypothesis ... 53
2.4.3 Product announcement ... 55
2.5 Discussion and conclusion ... 57
3. When diversification meets value: Technological diversification, technology categories, and firm value 3.1 Introduction ... 61
3.2 Theory and hypotheses ... 63
3.2.1 Technology diversification... 63
3.2.2 Technology diversification and firm value ... 65
3.3 Methods ... 69
3.3.2 Measures ... 69 3.4 Empirical Results ... 71 3.4.1 Descriptive statistics ... 71 3.4.2 Regression results ... 72 3.4.3 Robustness ... 77 3.5 Discussion ... 79 3.6 Conclusion ... 82
A. Appendix for “Patent value in financial markets: An Event Study” ... 84
A.1 Definition of variables ... 84
A.2 Descriptive statistics... 85
A.3 Correlations ... 91
A.4 Extended models ... 98
A.4.1 Variables... 98
A.4.2 Control Variables ... 99
3.4.3 Empirical results... 100
A.5 Cumulative abnormal returns by industry ... 105
LIST OF FIGURES
1.1 Percentage of patent applications published and not published before grant– Granted patents up to 2010 ... 23
LIST OF TABLES
1.1 Descriptive statistics ... 28
1.2 Correlation Matrix ... 29
1.3 Drivers of opting-out. Dependent variable: Published(0) or not-published(1) .. 30
1.4 Drivers of opting-out. Dependent variable: Published(0) or not-published(1). Interaction ... 31
1.5 Drivers of opting-out. Singletons. Dependent variable: Published(0) or not-published(1) ... 32
1.6 Drivers of opting-out. Dependent variable: Published(0) or not-published(1). Full sample and singleton subsample ... 33
1.7 Drivers of opting-out. Dependent variable: Published(0) or not-published(1). Full sample ... 34
1.8 Drivers of opting-out. Dependent variable: Published(0) or not-published(1). Singleton subsample ... 35
2.1 OLS Estimation. Dependent variable: Cumulative abnormal returns (CAR). Patent grant ... 51
2.2 OLS Estimation. Dependent variable: Cumulative abnormal returns (CAR). Orange Book patents ... 52
2.3 OLS Estimation. Dependent variable: Cumulative abnormal returns (CAR). NME patent grant (Canadian DrugBank) ... 53
2.4 OLS Estimation. Dependent variable: Cumulative abnormal returns (CAR). Patent applications publication (Panel A) and Notice of Allowance (Panel B) ... 54
2.5 OLS Estimation. Dependent variable: Cumulative abnormal returns (CAR).FDA Announcements ... 56
3.1 Descriptive statistics ... 72
3.2 Correlation matrix ... 74
3.3 Random effects panel models for Tobin’s q ... 76
3.4 Random effects panel models for Tobin’s q (Additional controls) ... 78
3.5 Random effects panel models for Tobin’s q (Alternative measures of technological diversification) ... 80
A.1 Definition of variables ... 84
A.2.1b Patent grant. 30 days estimation window ... 85
A.2.2a Orange book patents’ grant. 60 days estimation window ... 86
A.2.2b Orange book patents’ grant. 30 days estimation window ... 86
A.2.3a Patent grant. 60 days estimation window. Canadian DrugBank ... 87
A.2.3b Patent grant. 30 days estimation window. Canadian DrugBank ... 87
A.2.4a Patent application. 60 days estimation window ... 88
A.2.4b Patent application. 30 days estimation window ... 88
A.2.5a Patent allowance. 60 days estimation window ... 89
A.2.5b Patent allowance. 30 days estimation window ... 89
A.2.6a FDA announcements. 60 days estimation window... 90
A.2.6a FDA announcements. 30 days estimation window... 90
A.3.1a Correlation matrix. Patent grant. 60 days estimation window ... 91
A.3.1b Correlation matrix. Patent grant. 30 days estimation window ... 92
A.3.2a Correlation matrix. Orange book patent’s grant. 60 days estimation window ... 93
A.3.2b Correlation matrix. Orange book patent’s grant. 30 days estimation window ... 94
A.3.3a Correlation matrix. Patent publication. 60 days estimation window ... 95
A.3.3b Correlation matrix. Patent publication. 30 days estimation window ... 96
A.3.4a Correlation matrix. Patent allowance. 60 days estimation window ... 97
A.3.4b Correlation matrix. Patent allowance. 30 days estimation window ... 97
A.4.1 OLS Estimation. Dependent variable: Cumulative abnormal returns (CAR). Patent grant ... 101
A.4.2 OLS Estimation. Dependent variable: Cumulative abnormal returns (CAR). Orange book patents ... 102
A.4.3 OLS Estimation. Dependent variable: Cumulative abnormal returns (CAR). Patent application publication ... 103
A.4.4 OLS Estimation. Dependent variable: Cumulative abnormal returns (CAR). Notice of allowance ... 104
A.5.1 OLS Estimation. Dependent variable: Cumulative abnormal returns (CAR). Patent grant ... 105
A.5.2 OLS Estimation. Dependent variable: Cumulative abnormal returns (CAR). Patent application publication ... 106
A.5.3 OLS Estimation. Dependent variable: Cumulative abnormal returns (CAR). Notice of allowance ... 107
Acknowledgements
Completing a Ph.D. thesis has been a long journey, leaving back my family and friends and taking on a new and unpredictable challenge far from home. Many people helped me during these years, whom I am greatly indebted with.
I want to thank my supervisors, Ayfer Ali and Neus Palomeras, for the time you have dedicated to me and all the support throughout theses years. I want to thank Ayfer for challenging my ideas and for stimulating in me the development of critical thinking. Thank you Neus for support, guidance, and for being there when I most needed. In addition, I also want to thank the university and the program for this opportunity to learn and to complete my Ph.D. Thank you Carlos Bellón for helping me with econometrics of event studies. Thank you Samira Dias for comments on the thesis, for the project, and teaching support.
I want to thank Suelen Ferreira, Carla and Vinicius Maturano, who were my friends in a critical moment of my life. I will not forget it. Dr. André Girotto who was very important for me to continue in Spain, thank you.
The best part of the Ph.D. are the friends that supported and encouraged me. Just citing the names is not enough to show how important you were and are. Cachivaches friends: Ana Laura, Amaranta, Audra, Carlo, Demian, Diego, Guillermo, Nicolás and, Mahmoud, who made me to forget about the Ph.D. many times and were a source of endless laugh and fun, thank you for the very good moments and a sincere friendship. The girls from Getafe (las Getachicas): Carita, Georgina, Maria and, Vane, for all conversations, intellectual and emotional support, thank you girls. Not to forget to mention, Silvina and Luciana my thesis co-advisors, thank you for your shoulders and ears. Other friends and officemates: Abi, David, Elvira, Facundo, Imola, João, Manuel, Matias, Mehdi, and Pedro, thank you for being there and making work lighter and happier. Thank you all for being friends and making the bad moments insignificant compared with the uncountable good moments and good memories I am going to carry with me.
Last but not least, I want to thank my parents, Vilson and Esdenir, and my brother Tarcísio. Thank you for all the support, for believing in me and for backing my dreams up.
Abstract
This dissertation consists of three essays analyzing how patenting firms and external investors value the knowledge describe in the patent document. A patent is a document that bestows a temporary exclusivity right (20 years from the filing date) over the described invention. In the patent document, one can find information about assignees, inventors, application date, priority date, a list of prior art (backward citations), the invention technological classification, and the claims describing the invention. Therefore, a patent disclose a rich set of information, which might reveal a firm’s valuable technological information and be used by competitors. Therefore, I study the patenting firm valuation of the information conveyed by the patent and how external investors value the patented knowledge.
In the first chapter, I study publicly firms’ motivations to delay patent disclosure. The enactment of the American Inventors Protection Act (AIPA), in November 29, 2000, required U.S. patent applicants to have their patent application published 18 months after filing date but allowed them to opt for keeping it secret if they relinquished foreign patent protection. Using a sample of granted patents applied for by publicly traded companies, between 2000 and 2009, I investigate what drives large companies’ decision to keep a patent secret up to grant. Particularly, in this chapter I investigate the effect of technological crowdedness, strategic use of in-house knowledge stock, and invention radicalness on the decision of opting out of pre-grant publication. Results show a negative association between technological crowdedness and pre-grant secrecy, while radicalness and the use of in-house knowledge stock are positively associated with the likelihood of a patent application being secret until grant.
In the second chapter, we use an event study methodology to investigate whether the stock market values innovation milestones. First, we investigate abnormal returns generated due to a patent grant event. Results point to investors, on average, not valuing the information disclosed in the patent document. We then test several explanations about why investors do not value patent grants on average: patent value is highly skewed, the number of patents granted is ever increasing and only some patents protect technology that results in successful products. By analyzing stock market reaction to the
approval of a drug by the U.S. Food and Drug Administration (FDA), we show that the stock market is able to value innovation that results in a product. This suggests that innovation that will clearly generate sales revenue in the short run are highly valued by investors. We point out some implications of these results.
Finally, in the third chapter, I look at the effect of firm’s technological diversification on firm value (Tobin’s q). Firm’s technological knowledge base contributes to identifying technological opportunities and answering demand changes. Therefore, a firm with broader technology base might be better able to cope with technology uncertainties achieving higher future returns. Technological classes of the firm’s patents were used to calculate an entropy index of technological diversification. Using a sample of 1,304 R&D intensive US firms over 16 years (1992-2007) I find that on average technological diversification has a positive and significant impact on firm value. Further, diving into industry level differences, results indicate that technological diversification matters to investors’ assessment of firm’s future cash flows in the electronic industry. On the other hand, in the chemical industry, technological diversification does not have a significant effect on Tobin’s q.
Chapter 1
Why are they hiding? Patent secrecy and
patenting strategies
1.1 INTRODUCTION
A patent provides a mechanism to protect inventors from competitors’ imitation of their invention in exchange for a detailed disclosure of the patented invention so that any interested and skilled audience may be able to understand and replicate the knowledge conveyed by the patent document. The temporary exclusivity right bestowed by the patent rights urges inventors to strategically manage their patents to maximize the profits generated by the invention (Jell, 2011) and to sustain a competitive advantage that may be derived from the innovation (Teece, 1986).
The literature on patenting strategies focuses on the motivations driving the strategic uses, filing (Jell, 2011; Van Zeebroeck, 2009) and management of patents (Somaya, 2012). According to de Rassenfosse et al. (2008) and Jell (2011), in addition to the traditional motive to protect an invention against competitors’ imitation, motives to patent include: blocking others, securing freedom to operate, and enhancing reputation. On the strategic management of patents, Somaya (2012) singles out some issues such as “signaling and information disclosure strategies, managing patents as real options, nonmarket strategies, and patent-related managerial capabilities” (Somaya, p. 1086, 2012). Filing strategies are related to procedural choices made by patentees in filing their patent applications. These choices may accelerate or delay the grant of a patent. Van Zeebroeck (2009) identifies patent filing strategies – the craft of a patent by making it longer and cumbersome to examiners to evaluate the patent, international filings, and the filing of divisional patents.
This study contributes to the patent filing strategies literature by analyzing patentees’ decision, when filing a patent application, to delay the disclosure of the patent document. Enacted on November 29, 2000, the American Inventors Protection Act (AIPA) established the automatic publication of US patent applications 18 months after the earliest filing date1. Nonetheless, an inventor may choose to have the patent application secret up to grant2. However, this choice poses a trade-off: having the patent application secret up to grant requires relinquishing foreign patent protection. The AIPA law harmonized US patent law with international patent law. Although patentees faced
1 Patent applications filed in a foreign jurisdiction were published by the foreign patent office before
AIPA enactment; however, AIPA established the patent application publication by the US Patent and Trademark Office (USPTO) making patent applications available in the US at the same time they are published abroad.
2 AIPA’s opt out option requires applicants to certify that the invention disclosed in the application will
not be subject of an application in another country or under an international multilateral agreement that requires publication 18 months after the filing date (35 U.S. Code § 122)
14
international publication before AIPA – when filing an international patent application, after AIPA this decision has to be taken together with the patent filing. In addition, in case the patentee wants to withdraw an intitial pre-grant publication choice, this is associated with nontrivial costs (Graham and Hedge, 20153).
The option to keep the patent secret until grant was justified as a mechanism to protect small US inventors who may not have enough resources to protect themselves against competitors’ imitation (Ragusa, 1992; Johnson and Popp, 2001; Graham and Hedge, 2012), because usually small inventors have limited resources to identify patent infringers and sue them. Graham and Hedge (2012) in their analysis of successful US patent applications filed between 1996 and 2005 find that 7.5% of the applications filed during 2001 and 2005 chose pre-grant secrecy. Interestingly, small inventors are not more likely to opt out than large ones (Graham and Hedge, 2012, 2015).
In this study, I investigate what drives large companies to opt out of pre-grant publication. In my sample of patents applied for by publicly traded firms, about 8.15% of the granted patents, during 2001 and 2010, were opted out of earlier patent application publication. Moreover, patents that were opted out of patent application publication had, on average, 20 months more secrecy time than those published pre-grant.
Choosing pre-grant application publication allows patentees to pursue foreign patent protection. Graham and Hedge (2012) report that 51% of US patent applications filed between January 1, 1995 and November 28, 2000, were also applied for in a foreign country. Unsurprisingly, inventors are more likely to seek foreign patent protection for their valuable inventions (Graham and Hedge, 2012). Moreover, earlier publication allows the patent owner, once the patent is granted, the right to seek reasonable royalties from the publication date to the grant (Hedge and Luo, 2016). Thus, inventors may be willing to have the application disclosed before the grant of the patent right in order to benefit from earlier royalty revenues and foreign patent protection.
In addition to foreign patent protection, patentees derive value from patent application publication as it signals firms’ innovation capabilities (Hsu and Ziedonis, 2007; Ganglmair and Oh, 2014) and may preempt R&D rivals from introducing a substitute innovation and competing with the patenting firm (Ceccagnoli, 2008). Moreover, pre-grant publication of a patent application may assist managers, of
3Online Supplementary Materials.
15
competitor firms, in making more informed decisions about R&D investment and avoiding hold up (FTC, 2003). Additionally, as AIPA aims to harmonize US patent law with the patent system of other developed economies4, pre-grant publication may be driven by (especially multinational) firms’ willingness to conform to international standards. Furthermore, pre-grant publication fosters knowledge disclosure, increases business certainty and promotes rational planning (FTC, 2005).
Conversely, AIPA’s opt out option provides an opportunity to, to some extent, combine secrecy and the exclusivity right allowing for strategic use of a combination of formal and informal intellectual property (IP) protection (Graham, 2004; Schneider and Veugelers, 2013). Foregoing earlier publication gives patentees more time to develop the invention without having the patent application disclosed. Pre-grant secrecy might give inventors a competitive advantage as competitors have access to the invention in a detailed5 way only when the uncertainty regarding the patent award is solved favorably6, hindering imitation and inventing around activities. Indeed, the major argument against patenting is that the knowledge disclosed in the patent document may give valuable information to competitors undermining innovators’ profits (Scotchmer and Green, 1990) and stimulating competitors to design around the patent (FTC, 2003). According to Anton and Yao (2004), disclosing enabling knowledge, included in the patent description, increases the probability of imitation or inventing around the patented invention.
In evaluating publicly traded firms’ choice to opt out of earlier patent application publication, the present study shows that not only invention characteristics but also strategic concerns are relevant to the decision to keep the patent application secret up to grant. Furthermore, I propose that companies’ filing strategy of keeping the patent application secret up to grant, takes into account the competition the technology faces, the hazard of disclosing firm’s internal valuable knowledge, and the invention specific characteristics. Results show that there is a negative association between technological crowdedness and pre-grant secrecy, whereas the more radical an invention the more
4 Most of industrialized economies, like Japan and European countries, have adopted the 18 months
publication rule long before it was implemented in U.S. (Ragusa, 1992)
5 “The specification shall contain a written description of the invention, and of the manner and process of
making and using it, in such full, clear, concise, and exact terms as to enable any person skilled in the art to which it pertains, or with which it is most nearly connected, to make and use the same, and shall set forth the best mode contemplated by the inventor of carrying out his invention” (35 U.S.C.112).
6 Uncertainty is not totally mitigated by the patent grant as, after grant, U.S. patents can be challenged by
litigation or by a patent re-examination requested to the USPTO (Graham et al., 2002; Lemley and Shapiro, 2005; Gans et al., 2008)
16
likely is the patent to be kept secret up to grant. Further, the more an invention builds on companies’ in-house knowledge stock7 the more likely it is to opt out of pre-grant patent application publication.
1.2 THEORY AND HYPOTHESES DEVELOPMENT
This section discusses the drivers of patentees’ decision regarding earlier application publication and derives some hypotheses. In particular, I discuss large entities’ incentives to disclose or not the inventions through earlier patent publication and how disclosing or not is linked to companies’ overall patenting strategies.
When applying for a patent many factors may determine the earliest filing date8 and, therefore, the publication date. However, this study investigates the motivations to opt out of patent application pre-grant publication, which has to be stated together with the filing of the patent application.
Assuming that firms maximize their profits (Arrow, 1962) then the choice of pre-grant secrecy is made always when it yields higher returns than publishing the patent. Besides motives to keep an invention secret as profit maximizing, minimizing competition, or further developing the invention (Anderson, 2011), delaying disclosure reveals inventor’s believe that domestic (US) protection is enough.
In choosing pre-grant secrecy, patentees may evaluate this choice considering three main aspects of the invention protected by the patent: the competition faced by the invention (technological crowdedness), firm’s technology strategy and how much internal knowledge the patent application publication discloses, and the invention specific characteristics (radicalness).
Technological crowdedness
Appropriating returns from an invention depends on the inventor’s ability to exclude others from making, using or selling the invention (Arrow, 1962). In case the invention is bound to be incorporated in a firm’s process or product, excluding competitors is an upmost requirement in order to achieve profits maximization. Therefore, the willingness
7 In this chapter, I refer to in-house knowledge stock as the extent that a patent builds on a firm’s previous
patents, relying on the knowledge generated inside the company.
8 John F. Martin (August 3, 2015) points out several reasons why patent application publication may
occur in less than 18 months or even in more time. http://www.ipwatchdog.com/2015/08/03/the-myth-of-the-18-month-delay-in-publishing-patent-applications/id=60185/ - Access: September 11, 2016.
17
to patent depends on the effectiveness of the patent as an instrument to exclude and to appropriate returns from the innovation (Cohen et al., 2000).
Even though a patent exclusivity right enables innovation returns appropriation, it has been shown in the empirical literature that managers mostly rely on informal innovation appropriability mechanisms such as secrecy, instead of on formal mechanisms such as patents (Cohen et al., 2000; Levin et al., 1987; Arundel, 2001). Zaby (2010) and Heger and Zaby (2013) stress that the invention disclosure required by the patent implies heterogeneous costs for the patenting firms. The former argues that an inventor’s propensity to patent depends on the extent of her technological lead, being more likely to rely on secrecy the more the inventor can appropriate monopoly rents without patent protection, i.e., the more difficult it is for a rival to imitate or reverse engineering the invention. The latter states that the propensity to patent depends on market barriers and on the relevance of the information disclosed.
Patents, by requiring the disclosure of the invention, represent a huge threat to innovating firms and may shrink innovators’ competitive advantage and technological lead (Zaby, 2010). Opting-out of pre-grant patent application publication the patentee is delaying the disclosure of the invention, what in a higly competitive environment may give to the patentee similar benefits as secrecy. However, in case disclosure represent an important threat it is reasonable to expect that the inventor is going to opt for secrecy instead of delaying disclosure.
On the other hand, the literature has identified a set of motives to patent beyond the traditional motive of protecting an invention against competitors’ imitation. These motives include: blocking competitors from using an invention (Cohen et al., 2000), securing freedom to operate (Henkel and Jell, 2009), gaining time to find a licensee or to evaluate an invention’s potential (Henkel and Jell, 2010), signaling the firm’s research capabilities (Hsu and Ziedonis, 2008; Ganglmair and Oh, 2014), and protecting a firm against infringing others’ patents and incurring infringement suit costs (Hall and Ziedonis, 2001).
On patents as a tool to secure freedom to operate9 (Henkel and Pangerl, 2008; Henkel and Jell, 2009; Jell, 2011), Henkel and Pangerl (2008) interviewed 56 IP experts from Germany’s large companies asking about defensive publication strategies. The authors find that companies use publications such as peer-review journals, firm’s
9 Jell (2011) defines freedom to operate as freedom to make and use the invention in the first place.
18
reports, and patents in order to establish prior art10 and secure freedom to operate, and then, hindering competitors from patenting similar technology(Jell, 2011).
Parchomovski (2000) and Litchman et al. (2000) point to strategical disclosure of research results, where in a patent race, firms may disclose intermediate results in order to raise the patentability bar for competitors. When such research outcomes become publicly available, they may hinder novelty and nonobviusness11 of an otherwise patentable invention.
Gilbert and Newbery (1982) have highlighted a strategic use of patents – incumbents preempt innovators from entering the market through patenting. According to the authors, preemptive patenting is a strategy to assure monopolistic profits. Furthermore, Ganglmair and Oh (2014) claim that by announcing a pending application the innovator (leader) may derive a value of deterrence, i.e., deterring the competitor (follower) from innovating if the threat of infringement is sufficiently strong, giving the leader a competitive advantage.
On preemptive patenting, Gullec et al. (2012) use patent examination outcomes at the European Patent Office (EPO) to access patents applied for in order to preempt competitors. They find evidence of preemptive patent filing – patentees file patents that may not comply with patenting requirements (novelty and nonobviousness) but aim to block competitors, ensuring freedom to operate. Also empirically, Ceccagnoli (2008), using the Carnegie Mellon survey (CMS) (Cohen et al. 2000), shows that preemptive patenting improves R&D returns appropriability for incumbents, especially when they have greater market share, when there is a threat of market entry, or when the R&D competition is based on incremental innovations.
Considering the AIPA’s option to opt out, patentees may be willing to have their patent published before grant, deriving value from preempting competitors from inventing a similar invention. Earlier publication does not mean that the patent will be granted. However, by publishing the patent application it signals, to rivals, patentee’s research developments and may stop competitors from investing in the same
10Prior art refers to the knowledge publicly available at the time the patent is applied for. For an invention to be patented it has to be novel and non-obvious. Novel means that the invention has not been patented before and under the non-obviousness bar, an invention cannot be patented if "the differences between the subject matter sought to be patented and the prior art are such that the subject matter as a whole would have been obvious at the time the invention was made to a person having ordinary skill in the art to which the subject matter pertains" (35 USC § 103a).
11 35 U.S.C. § 102 and 35 U.S.C. § 103, respectively.
19
technological area (Litchman et al., 2000). In addition, pre-grant patent application publication, besides disclosing private information, bears the uncertainty regarding the award of the property right and it may also add uncertainty to the marketplace regarding the rights entitled to the patent (Van Zeebroeck, 2011).
If the invention belongs to a technological area where the competition faced is high, publishing the patent application the patentee may derive a higher value by preempting rivals or securing freedom to operate than keeping the invention secret. Therefore, if the patentee is operating in a crowded technological area (in which there are many competitors inventing), she may be willing to publish the patent application before the patent is granted. Following the above argument, the first hypothesis states that:
Hypothesis 1: Firms are less likely to opt out of pre-grant publication of a patent application if the technology space is more crowded.
Firm’s internal knowledge
When designing patent filing strategies to maximize invention’s returns, inventors might consider the trade-off imposed by AIPA. By forgoing pre-grant publication an assignee also forgoes foreign patenting, i.e., foreign patent protection and the revenues she can get from the exclusivity right or licensing it out in another country. Balancing this trade-off, a patented invention that relies on firms in-house knowledge stock might influence firms’ disclosure choice in two opposite directions.
On the one hand, an invention that builds on firm’s internal knowledge indicates that the firm has an advantage at follow-on innovations as the firm has already developed the underlying tacit knowledge. Then, having internal expertise that probably involves tacit knowledge, the published knowledge is protected in the sense that the tacit part is necessary in order to replicate the invention. Therefore, there is no danger on publishing the patent application because of this protection.
On the other hand, earlier patent application publication reveals a firm’s technology direction without the assurance of exclusivity rights, giving to competitors the possibility to invent around or to imitate it. In this case, if the invention builds on external knowledge, there is a higher likelihood that others detect similar directions using this knowledge by their own means. However, if the patented invention relies more on a firm internal knowledge, by publishing the patent the firm might reveal interesting directions to use the firm’s knowledge.
In this sense, a follow-on invention might be kept secret until the patent grant in order to protect a core invention or to mask firm’s innovative and research direction. Moreover, publishing the patent without the exclusivity right might put at risk firm’s competitive advantage, even more when the invention relies on internal knowledge. Tacitness also means that the invention can be kept secret more effectively, i.e., an inventor would probably prefer to keep it secret if the patent is finally not granted
Graham (2004) shows that firms inventing upon internal knowledge and valuing secrecy as an appropriability mechanism are more likely to delay the invention disclosure. Therefore, a firm building on its own knowledge may forgo earlier patent application publication, hiding internal knowledge and postponing spillovers from the application disclosure. By hiding its technology direction, choosing patent application pre-grant secrecy, a firm might secure or increase its competitive advantage as competitors get to knowing later in which direction the firm is innovating. This motivates hypothesis 2:
Hypothesis 2. Relying on internal knowledge has a positive effect on the likelihood of a patent application to be opted out of pre-grant publication. Radicalness and technology uncertainty
Besides firms’ strategies and technology characteristics, invention specific characteristics also might influence firms’ choice of opting out of earlier patent application publication. Moreover, the decision to keep the invention secret up to the patent grant comes once the decision to patent the invention is made. Keeping the patent application secret assures that the invention will be disclosed when the uncertainty regarding the patent grant is favorably solved.
In addition to the property right uncertainty, patentees bear the uncertainty associated with the patented technology, the patent value, and the market for the protected invention (Somaya, 2012). The further the invention departs from the knowledge and capabilities established inside the firm and in the industry, the greater the uncertainty and the risk, requiring the adoption of new technical skills and routines (Nelson and Winter, 1982; Schoenmakers and Duyster, 2010). Likewise, inventions are said to be radical, as opposed to incremental, when they significantly differ from the state-of-the-art technology. Hence, a radical invention means moving away from established techniques to a new combination of knowledge (Fleiming, 2001).
Laukkanen et al. (p.5, 2013) argue that “when the creation to be protected is notably different from earlier ones, lead time, secrecy, or tacitness, for instance, are effective forms of protection since it takes more time for others to overcome causal ambiguities related to the innovation”. Therefore, the uncertainty borne by radical inventions might prevent firms from pre-grant publication, opting to have more time to further develop the technology before it is disclosed. Accordingly, hypothesis 3a states:
Hypothesis 3a. Radicalness has a positive effect on the likelihood of a patent to be opted out of pre-grant publication.
On the other hand, market uncertainty might prompt inventors to publish a radical invention before grant. To accelerate the adoption and the development of complementary assets, companies with radical inventions may be willing to disclose the invention. Innovating firms may profit from free revealing the invention by accelerating innovation diffusion and user adoption (Harhoff et al., 2003b).
Furthermore, radical inventions are more complex and might be more difficult to imitate (Hurmelinna-Laukkanen et al., 2008); therefore, pre-grant publication may be less of a concern regarding returns appropriability. In addition, earlier publication allows foreign patenting, broadening invention geographical span. Based on this, the following hypothesis presents the opposite prediction to the former one:
Hypothesis 3b: Radicalness has a negative effect on the likelihood of a patent to be opted out of pre-grant publication.
1.3 DATA AND MEASURES
1.3.1 Data
The patent data comes from EPO’s Worldwide Patent Statistical Database April 2012 (“PATSTAT”) that contains patent information from all major patent offices, including the USPTO. From January 2, 2001, the USPTO adopted “kind codes” to differentiate between granted patents that were kept secret up to grant and patents that were published before grant, B1 and B2, respectively.
As the focus of this study is publicly traded companies and their choice of publishing or not the patent application, the sample contains patents applied for by publicly traded
firms. Using Kogan et al. (2016)12 database, I merged USPTO patents to CRSP permnos and then merged permnos to gvkeys (Compustat). These merging procedures yield a final sample13 of 468,556 granted patents, applied for from November 29, 2000 to December 29, 2009 and granted up to November 02, 2010. The sample period is bounded by the AIPA enactment and database limitations (footnote 13). The merged patents were applied for by 2,645 different companies. In this sample, on average, 8.15% of the patents were opted-out. Figure 1.1 displays the proportion of opted-out patents along the analyzed period.
FIGURE 1.1 - Percentage of patent applications published and not published before grant– Granted patents up to 2010.
1.3.2 Dependent variable
To understand the drivers of opting out of pre-grant patent publication, patents were identified as published and not published before grant by the USPTO kind codes. The
12 Kogan et al. (2016) provide a match for all USPTO granted patents up to 2010 and CRSP permnos. 13 When merging with Compustat data I also dropped patents that had corresponding negative sales
values. 0% 10% 20% 30% 40% 50% 60% 70% 80% 90% 100% 2000 2001 2002 2003 2004 2005 2006 2007 2008 2009 PE RC EN TA GE PA TE N T APPL IC AT ION APPLICATION YEAR Series1 Series2 23
dependent variable is equal to one if the patent’s kind code is B1 (not published) and zero if it is B2 (published).
1.3.2 Independent variables
Technological crowdedness
To test hypothesis 1 I follow Hedge et al. (2007) and measured technological crowdedness by counting the number of different assignees of the patents listed as reference (backward citations) and that are not the same as the assignee(s) of the focal patent. It indicates that the inventor is operating in a crowded technological area with a number of “nearby” patents and competitors (Hall et al., 2009). Cockburn and MacGarvie (2006) use the number of cited assignees to proxy for the number of potential licensors. Accordingly, as this number increases, the costs for a potential entrant increase.
Internal knowledge (Self-citation Ratio)
To test hypothesis 2, I use the ratio of self-citations to the backward citations to proxy for the degree to which each patent builds on in-house knowledge. Self-cited patents are patents assigned to the same assignee of the focal patent. Graham (2004) uses the backward self-citation ratio as a measure of the technology control a firm has over the technology trajectory in which the focal patent lies in and finds that the backward self-citation ratio combined with secrecy (measured by managers’ response when secrecy is considered as an effective appropriability mechanism) is positively associated to patent filing strategies (filing continuation applications).
Radicalness
I use two variables to proxy for invention radicalness (hypothesis 3). First, I use the radicalness index provided by the OECD REGPAT Database14. Based on the patents cited by the focal patent, this index measures the number of different four-digits IPC (International Patent Classification) classes into which the focal patent is classified and to which the cited patents are not classified. It follows Shane (2001)’s definition but the OECD indicator (Squicciarini et al., 2013) is normalized by the total number of classes listed in the backward citations, considering the most disaggregated level available. Thus, the higher the index the more the focal patent builds on distinct knowledge and, therefore, represents a radical innovation. However, the radicalness index represents
14 OECD, REGPAT database, February 2015
24
how radical is an invention to the firm, it does not imply that this technological novelty is on the invention level (Verhoeven et al., 2016).
Additionally, as a proxy for novelty in the invention level, I use the dispersion index proposed by Melero and Palomeras (2015) and create a variable NEW COMBINATIONS. This variable is a binary variable equal one when there was no previus IPC classes combination to calculate the index. The dispersion index measures the variance of the importance of past innovations in a given technological domain by the number of citations received (forward citations). The index is defined as follows
𝐷𝐷𝐷𝐷𝐷𝐷𝐷𝐷𝐷𝐷𝐷𝐷𝐷𝐷𝐷𝐷𝐷𝐷𝐷𝐷 𝐷𝐷𝐷𝐷𝑖𝑖𝐷𝐷𝑖𝑖(𝐷𝐷𝐷𝐷) =𝜎𝜎𝜇𝜇2
where 𝜎𝜎2 represents the variance and 𝜇𝜇 the mean of the standardized forward citations
(Hall et al. 2001) received by previous patents assigned to the same combination of IPC 8-digits, the most disaggregated level. Following Melero and Palomeras, I assigned the index calculated using patents applied for during the previous five years before the focal patent was applied for.
1.3.4 Control variables
First, I control for patent characteristics – number of claims, patent scope (number of unique four-digit IPC subclasses) (Lerner, 1994), number of assignees, whether the patent is not part of a patent family, whether the assignee is from the US, and indicator variables for discrete and complex technologies15.
Patent characteristics were found to be positively correlated with patent value (Harhoff et al., 1999, 2003a; Lanjow and Shankerman, 1999) and more valuable patents are internationally protected (Putnam, 1996). Hence, valuable patents might be published before grant as it also allows foreign patent protection. Controlling for patent characteristics, variables that might affect the likelihood of an application to be published before grant are held constant. Additionally, the model includes a dummy variable identifying patents that were not applied for outside the US and do not have any related international patent, i.e., singleton patents16,17.
15 Von Graevenitz et al. (2011).
16 Singletons patents are defined as “single patent applications that form patent families on their own
because they are not related to any other application” (Martinez, p. 2, 2011)
17 PATSTAT record data for DOCDB patent family and INPADOC patent family. DOCDB patent
families referred to a set of patents that protect the same technical content, defined by European Patent Office’s (EPO) examiners. Differently, INPADOC patent families, also called INPADOC extended
25
The claims define the invention to which protection is sought. The claims are the legally protected part of the patent document, over what the patentee can be sued or sue a possible infringer. Therefore, the number and content of claims can be seen as a measure of the breadth of a patent. With respect to patent scope, a patent allocated to more subclasses means that it has a greater technological potential and a greater market value (Lerner, 1994).
To identify the technological field of a patent I use the OECD classification, which is based on Schmoch (2008), and provides an IPC-technology concordance by main technology field.18 First I identified four main technology groups, semiconductors, computers, biotechnology, and pharmaceutics. Also, I included a dummy variable when the patent is classified in more than one technology field, what may broaden the use of the given invenvion. Further, I classified patents by discrete or complex19 technologies following Von Graevenitz et al. (2011). This classification does not include all technology fields; it means that there are some patents that are neither discrete nor complex.
Furthermore, I use some indicators based on patent characteristics, basic research and originality. Basic research is the ratio of non-patent literature (NPL) to backward citations, reflecting how much the patented invention relies on scientific knowledge. The originality index, first proposed by Trajtenberg et al. (1997), “refers to the breadth of technology fields on which a patent relies” (Squicciarini et al., p. 49, 2013). It is based on the different classes to which backward citations are allocated. Besides building on Hall et al. (2001), the OECD’s originality index uses IPC 8-digits classification. The originality index reflects patents building on a wide array of technology classes.
On the firm level, I control for some firm characteristics. Firm size is proxied by the natural logarithm of sales. Firm size may also capture firms’ financial constraints as smaller firms have bigger restrictions to access financial markets. I use the pre-tax foreign income (PIFO20 in Compustat) and assign the value 1 if PIFO is greater than zero or 0 otherwise as a proxy for firms’ foreign activities21. Having foreign operations priority patent families, referred to a broader set of patents direct or indirectly linked by patent application priorities. In our main analysis, I used the DOCDB patent family definition.
18 I use the technological field classification included in the OECD, REGPAT database, February 2016. 19 According to Cohen et al. (2000), discrete technologies refer to products that are protected by few
patents, whereas, complex technologies require many patents to protect a single product.
20 Missing values were replaced by zero (Hanlon et al., 2015)
21 As a robustness check I also include the continuous variable and results were similar.
26
makes foreign patenting more relevant and, therefore, can be related to the decision to have the patent application published 18 months after filing and protected in multiple countries. In addition, I control for the industry’s competition intensity by the Herfindahl-Hirschman index (HHI)22. I also control for the total number of patents applied for by the company in the respective year.
1.4 EMPIRICAL RESULTS
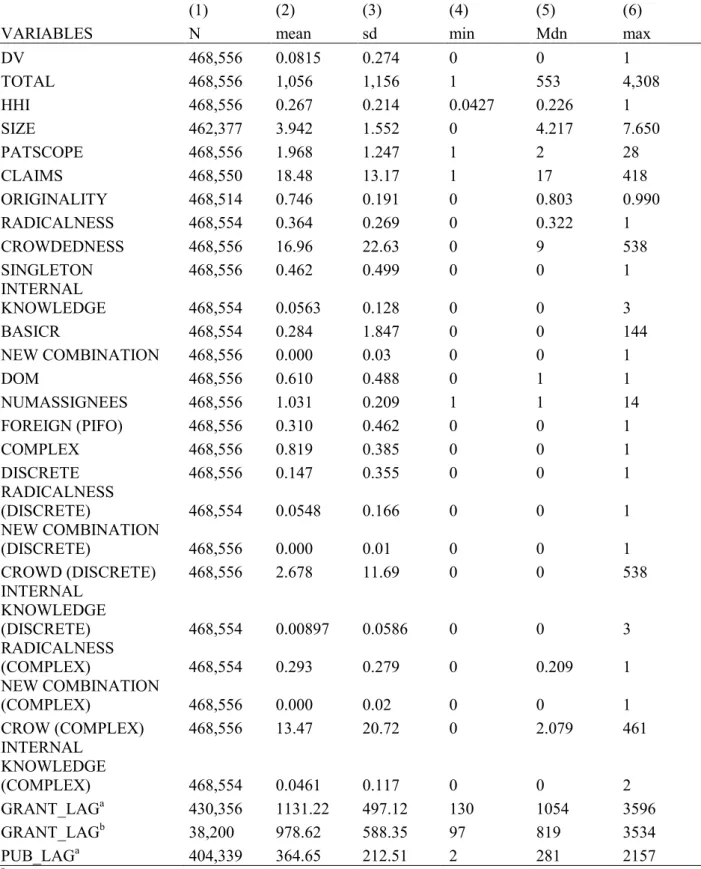
Table 1.1 presents descriptive statistics and table 1.2 presents the correlation matrix. As already noted in the literature, patent characteristics – claims, patent scope, backward citations, have a very skewed distribution (Scherer and Harhoff, 2000; Harhoff et al., 2003a). In our sample, it can be seen from table 1.1 that, on average, patents that were opted out of pre-grant publication were secret for about 20 months more than patents that were published before grant23.
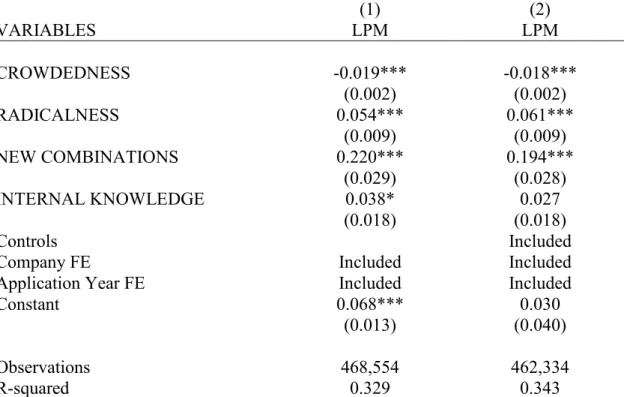
In order to test the hypotheses I estimate a linear probability model (LPM) where the dependent variable is a binary variable equal to 0 if the patent application was published before grant and equal 1 if the patent application was not published before grant 24. A LPM provides a simple and good approximation to the average partial effects (Wooldgridge, p. 563, 2010), moreover, the objective of this study is not to make forecasts but to identify the effect of the explanatory variables on the decision to publish or not a patent application. Table1. 3 reports the results, model 1 refers to the baseline model and model 2 presents the results including the control variables. The independent variables, crowdedness, internal knowledge (self-citation ratio), and radicalness are in logarithm. All estimations include company fixed effects, application year fixed effects and the standard errors are clustered by company.
Results show that hypothesis 1 cannot be rejected, as patents belonging to a crowded technological area are more likely to be published before grant. However, the size of the coefficient suggests that the effect of preemption is only marginally important in driving the choice of having the patent application published before grant. Regarding hypothesis 2, estimated results show that the more a patent builds on in-house knowledge stock the more likely it is to be kept secret up to grant. However, results
22 Calculated using Compustat by three-digit SIC codes.
23 Grant lag (not-published) = 979 days (mean), 819 days (median); publication lag (published) = 365
days (mean), 281 days (median).
24 I estimate all models using a random sample of 10% of the full sample, accounting for the proportions
of the dependent variable, singleton patents, and technology fields, applying a logit specification, Results are robust and consistent with the ones presented here. Results available on request.
27
show a weakly support for hypothesis 2 as when adding the controls internal knowledge is not statistically significant anymore.
TABLE 1.1 – Descriptive statistics
(1) (2) (3) (4) (5) (6)
VARIABLES N mean sd min Mdn max
DV 468,556 0.0815 0.274 0 0 1 TOTAL 468,556 1,056 1,156 1 553 4,308 HHI 468,556 0.267 0.214 0.0427 0.226 1 SIZE 462,377 3.942 1.552 0 4.217 7.650 PATSCOPE 468,556 1.968 1.247 1 2 28 CLAIMS 468,550 18.48 13.17 1 17 418 ORIGINALITY 468,514 0.746 0.191 0 0.803 0.990 RADICALNESS 468,554 0.364 0.269 0 0.322 1 CROWDEDNESS 468,556 16.96 22.63 0 9 538 SINGLETON 468,556 0.462 0.499 0 0 1 INTERNAL KNOWLEDGE 468,554 0.0563 0.128 0 0 3 BASICR 468,554 0.284 1.847 0 0 144 NEW COMBINATION 468,556 0.000 0.03 0 0 1 DOM 468,556 0.610 0.488 0 1 1 NUMASSIGNEES 468,556 1.031 0.209 1 1 14 FOREIGN (PIFO) 468,556 0.310 0.462 0 0 1 COMPLEX 468,556 0.819 0.385 0 0 1 DISCRETE 468,556 0.147 0.355 0 0 1 RADICALNESS (DISCRETE) 468,554 0.0548 0.166 0 0 1 NEW COMBINATION (DISCRETE) 468,556 0.000 0.01 0 0 1 CROWD (DISCRETE) 468,556 2.678 11.69 0 0 538 INTERNAL KNOWLEDGE (DISCRETE) 468,554 0.00897 0.0586 0 0 3 RADICALNESS (COMPLEX) 468,554 0.293 0.279 0 0.209 1 NEW COMBINATION (COMPLEX) 468,556 0.000 0.02 0 0 1 CROW (COMPLEX) 468,556 13.47 20.72 0 2.079 461 INTERNAL KNOWLEDGE (COMPLEX) 468,554 0.0461 0.117 0 0 2 GRANT_LAGa 430,356 1131.22 497.12 130 1054 3596 GRANT_LAGb 38,200 978.62 588.35 97 819 3534 PUB_LAGa 404,339 364.65 212.51 2 281 2157
a Published patents (B2). Number of days. b Not-published patents (B1). Number of days.
TABLE 1.2 – Correlation Matrix VARIABLES (1) (2) (3) (4) (5) (6) (7) (8) (9) (10) (11) (12) (13) (14) (15) (16) (17) (18) (19) (20) (21) (22) (23) (24) (25) (26) (1) DV 1 (2) CROWD (COMPLEX) -0.02 1 (3) NC (COMPLEX)a 0.03 0 1 (4) RADICALNESS (COMPLEX) 0.09 0.21 0.02 1 (5) IK (COMPLEX)b 0 -0.05 0 0.02 1 (6) IK (DISCRETE)b -0.01 -0.1 0 -0.16 -0.06 1 (7) CROWD (DISCRETE) -0.04 -0.15 0 -0.24 -0.09 0.1 1 (8) NC (DISCRETE)a 0.01 -0.01 0 -0.01 0 0.01 0.01 1 (9) RADICALNESS (DISCRETE) -0.04 -0.21 -0.01 -0.35 -0.13 0.24 0.5 0.03 1 (10) COMPLEX 0.05 0.31 0.01 0.49 0.19 -0.33 -0.49 -0.02 -0.7 1 (11) DISCRETE -0.06 -0.27 -0.01 -0.44 -0.16 0.37 0.55 0.03 0.79 -0.88 1 (12) RADICALNESS 0.07 0.05 0.02 0.76 -0.08 -0.03 0.05 0.01 0.24 -0.05 0.01 1 (13) NEW COMBINATION 0.03 -0.01 0.8 0.01 0 0 0 0.43 0.01 -0.01 0 0.02 1 (14) CROWD -0.04 0.82 0 0.03 -0.1 -0.05 0.37 0 0.05 -0.05 0.02 0.08 0 1 (15) INTERNAL KNOWLEDGE -0.01 -0.09 0 -0.06 0.88 0.4 -0.04 0 -0.01 0 0.01 -0.09 0 -0.12 1 (16) FOREIGN (PIFO) 0.01 -0.04 0 -0.03 0.01 0.03 0 0 0 -0.01 0.02 -0.04 0 -0.04 0.02 1 (17) NUMASSIGNEES -0.03 0.08 0 -0.03 -0.02 -0.01 0.08 0 0.02 -0.03 0.04 -0.02 0 0.11 -0.03 0.03 1 (18) DOM 0.17 0.17 0.01 0.06 -0.07 -0.02 0.11 0.01 0.07 -0.08 0.06 0.12 0.01 0.24 -0.07 -0.22 -0.08 1 (19) SINGLETON 0.22 0.09 0.01 0.06 -0.01 -0.01 0.03 0 0 0 0 0.07 0.01 0.1 -0.01 -0.03 -0.04 0.38 1 (20) BASICR 0 -0.04 0 -0.06 -0.02 0.01 0.02 0 0.08 -0.11 0.13 -0.01 0 -0.03 -0.01 0.04 0.01 0.06 0.05 1 (21) ORIG -0.05 0.14 0 0.32 -0.09 -0.01 0.13 0 0.18 -0.13 0.13 0.46 0 0.2 -0.09 0 0 0.08 0.01 0 1 (22) CLAIMS 0.07 0.14 0 0.04 -0.03 -0.02 0.06 0 -0.01 0.01 -0.01 0.04 0 0.17 -0.04 -0.01 -0.03 0.21 0.09 0 0.06 1 (23) PATSCOPE -0.14 -0.01 -0.01 -0.14 -0.06 0.05 0.15 -0.01 0.11 -0.2 0.22 -0.09 -0.02 0.07 -0.03 0.05 0.04 -0.08 -0.1 0.1 0.29 -0.01 1 (24) SIZE -0.17 -0.12 -0.01 0.01 0.1 -0.01 -0.11 0 -0.08 0.13 -0.11 -0.05 -0.01 -0.19 0.08 -0.17 0.06 -0.31 -0.19 -0.08 -0.05 -0.18 -0.02 1 (25) HHI -0.07 -0.05 0 0 0.05 0.02 -0.04 0 -0.01 0.01 -0.04 0 0 -0.05 0.06 0.01 0.06 -0.19 -0.13 -0.06 0 -0.09 0.04 0.34 1 (26) TOTAL -0.15 -0.06 -0.01 -0.01 0.14 -0.03 -0.14 -0.01 -0.14 0.21 -0.18 -0.12 -0.01 -0.15 0.11 -0.05 0.06 -0.28 -0.07 -0.05 -0.07 -0.13 -0.03 0.63 0.27 1
*Dependent variable (DV): 0 if patent published; 1 if patent not published. Note: All correlations are significant at 5% except the ones in bold. Obs.:498,556.
aNC= NEW COMBINATION bIK= INTERNAL KNOWLEDGE
I test hypothesis 3a and 3b by using two variables, radicalness and the new combination dummy. This variable accounts for first time IPC 8-digits combinations, therefore, this patents bear the highest uncertainty. Considering both variables, hypothesis 3a cannot be rejected meaning that the more radical is the invention the more likely is the patent to be opted out of pre-grant publication.
In addition, I test differences among the two broad types of technologies, complex and discrete, reported in table 1.6. Model 1 shows results for the complex technology patents compared to others technologies, not classified in any of the two main categories. Model 3 displays results for discrete patents compared to other technologies. Results show that the effect of the independent variables on the likelihood of opting out of pre-grant patent application publication do not qualitatively differ between technology categories. The differences between the technology categories appear on the size of the coefficients. However, the effect of all variables have the same direction and are statisticaly significant.
TABLE 1.3 – Drivers of opting-out. Dependent variable: Published (0) or not-published (1) (1) (2) VARIABLES LPM LPM CROWDEDNESS -0.019*** -0.018*** (0.002) (0.002) RADICALNESS 0.054*** 0.061*** (0.009) (0.009) NEW COMBINATIONS 0.220*** 0.194*** (0.029) (0.028) INTERNAL KNOWLEDGE 0.038* 0.027 (0.018) (0.018) Controls Included
Company FE Included Included
Application Year FE Included Included
Constant 0.068*** 0.030
(0.013) (0.040)
Observations 468,554 462,334
R-squared 0.329 0.343
Robust standard errors in parentheses. Standard errors are cluster by company in all models. *** p<0.001, ** p<0.01, * p<0.05.
1.5 ADDITIONAL ANALYSIS AND ROBUSTNESS TESTS
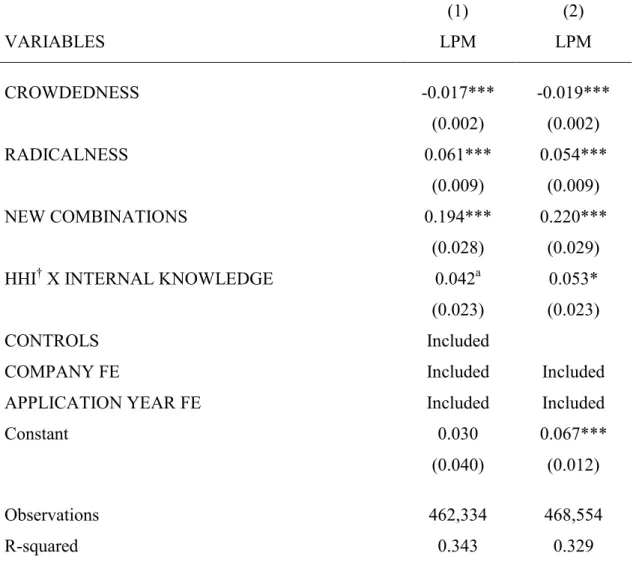
In this section, I present some additional analysis to further investigate the robustness of the results. In order to do that, I add an interaction term between internal knowledge and the industry competition, estimate the models using different samples, and investigate the motives to opt-out of earlier patent application publication by technology categories.
TABLE 1.4 – Drivers of opting-out. Dependent variable: Published (0) or not-published (1). Interaction (1) (2) VARIABLES LPM LPM CROWDEDNESS -0.017*** -0.019*** (0.002) (0.002) RADICALNESS 0.061*** 0.054*** (0.009) (0.009) NEW COMBINATIONS 0.194*** 0.220*** (0.028) (0.029)
HHI† X INTERNAL KNOWLEDGE 0.042a 0.053*
(0.023) (0.023)
CONTROLS Included
COMPANY FE Included Included
APPLICATION YEAR FE Included Included
Constant 0.030 0.067***
(0.040) (0.012)
Observations 462,334 468,554
R-squared 0.343 0.329
Robust standard errors in parentheses. Standard errors are cluster by company in all models. *** p<0.001, ** p<0.01, * p<0.05, a p<0.1.
†HHI=1-HHI
First, I estimate the previous models adding an interaction between the degree of competition (HHI) and the self-citation ratio (Table 1.4). This interaction is included to test the hypothesis that when an invention relies more one internal knowledge firms face the threat of losing competitive advantage. Thus, more competition would
increase the likelihood of a patent application to be secret up to grant. The coefficient of the interaction term is positive and significant, even when adding the control variables. It suggests that the effect of building on internal knowledge on the likelihood of a patent being opted-out is more pronounced when the inventive firm is operating in a more competitive environment.
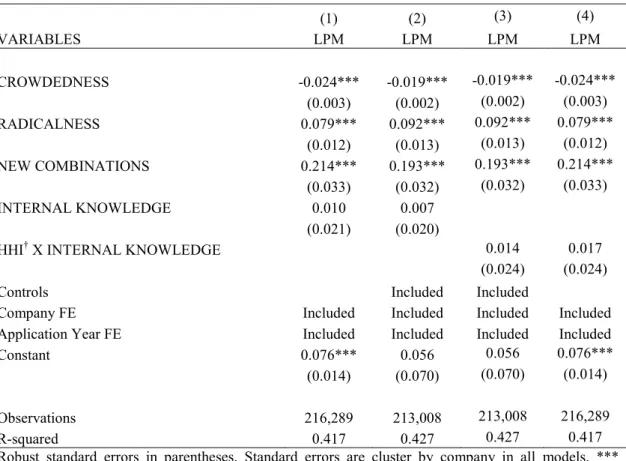
TABLE 1.5 – Drivers of opting-out. Singletons. Dependent variable: Published (0) or not-published (1) (1) (2) (3) (4) VARIABLES LPM LPM LPM LPM CROWDEDNESS -0.024*** -0.019*** -0.019*** -0.024*** (0.003) (0.002) (0.002) (0.003) RADICALNESS 0.079*** 0.092*** 0.092*** 0.079*** (0.012) (0.013) (0.013) (0.012) NEW COMBINATIONS 0.214*** 0.193*** 0.193*** 0.214*** (0.033) (0.032) (0.032) (0.033) INTERNAL KNOWLEDGE 0.010 0.007 (0.021) (0.020)
HHI† X INTERNAL KNOWLEDGE 0.014 0.017
(0.024) (0.024)
Controls Included Included
Company FE Included Included Included Included Application Year FE Included Included Included Included
Constant 0.076*** 0.056 0.056 0.076***
(0.014) (0.070) (0.070) (0.014)
Observations 216,289 213,008 213,008 216,289
R-squared 0.417 0.427 0.427 0.417
Robust standard errors in parentheses. Standard errors are cluster by company in all models. *** p<0.001, ** p<0.01, * p<0.05, a p<0.1.
†HHI=1-HHI
Additionaly, as opting out of earlier publication requires the inventor to forgo foreign publication, I restrict the sample to singleton patents, i.e., patents that do not belong to a patent family, only applied for in the US. Although one can think that the main reason to publish the patent application is to seek foreign protection, when considering only patents applied in the US 84.5% of the patents were published before grant. Therefore, by restricting the sample to patents only filed in the US I am comparing patents that could have been secret, but were published instead, to pre-grant secret patents.
On average, patents that were not published before grant took less time to issue25 and, therefore, pre-grant published patents may be underrepresented in my sample, as it includes patents granted up to 2010. In order to reduce this possible bias, all the regressions were re-estimated considering patents applied for between 2000 and 200726. Results are consistent with the results presented above.
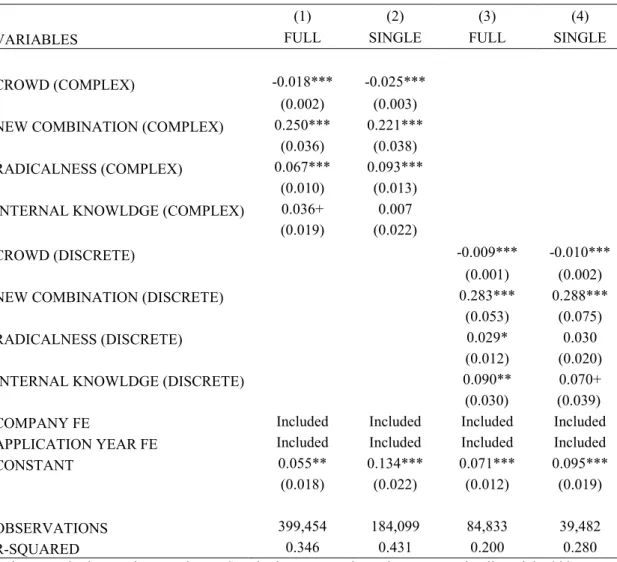
TABLE 1.6 – Drivers of opting-out. Dependent variable: Published (0) or not-published (1). Full sample and singleton subsample.
(1) (2) (3) (4)
VARIABLES FULL SINGLE FULL SINGLE
CROWD (COMPLEX) -0.018*** -0.025*** (0.002) (0.003) NEW COMBINATION (COMPLEX) 0.250*** 0.221***
(0.036) (0.038) RADICALNESS (COMPLEX) 0.067*** 0.093***
(0.010) (0.013) INTERNAL KNOWLDGE (COMPLEX) 0.036+ 0.007
(0.019) (0.022)
CROWD (DISCRETE) -0.009*** -0.010***
(0.001) (0.002)
NEW COMBINATION (DISCRETE) 0.283*** 0.288***
(0.053) (0.075)
RADICALNESS (DISCRETE) 0.029* 0.030
(0.012) (0.020)
INTERNAL KNOWLDGE (DISCRETE) 0.090** 0.070+
(0.030) (0.039) COMPANY FE Included Included Included Included APPLICATION YEAR FE Included Included Included Included
CONSTANT 0.055** 0.134*** 0.071*** 0.095***
(0.018) (0.022) (0.012) (0.019)
OBSERVATIONS 399,454 184,099 84,833 39,482
R-SQUARED 0.346 0.431 0.200 0.280
Robust standard errors in parentheses. Standard errors are cluster by company in all models. *** p<0.001, ** p<0.01, * p<0.05, a p<0.1.
I also test hypothesis 1 using two alternative measures of technological crowdedness. Calculating crowdedness index considering backward citations within a time lag difference of 10 and 20 years from the focal patent, respectively. One could
25 In our sample, the grant lag of not published patents is 2.68 years (1.36 years standard deviation)
whereas for published patents is 3.1 years (1.61 years standard deviation).
26 Results available upon request.
33
expect that the effect of crowdedness is stronger if we consider the more recent cited patents. However, results do not show a substantial difference, they remain qualitatively and statistically similar27.
Overall, the estimated results are qualitatively similar to the results for the full sample (table 1.5). However, the variable internal knowledge and the interaction term between HHI and internal knowledge, accounting for the use of internal knowledge in the patented invention becomes insignificant. This result suggests that, when there is no international competition for a given invention, internal knowledge is not a motive to opt-out of earlier patent application publication.
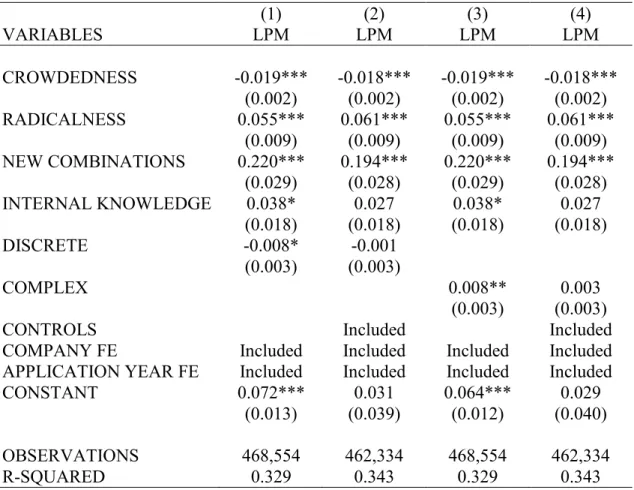
TABLE 1.7 – Drivers of opting-out. Dependent variable: Published (0) or not-published (1). Full Sample
(1) (2) (3) (4) VARIABLES LPM LPM LPM LPM CROWDEDNESS -0.019*** -0.018*** -0.019*** -0.018*** (0.002) (0.002) (0.002) (0.002) RADICALNESS 0.055*** 0.061*** 0.055*** 0.061*** (0.009) (0.009) (0.009) (0.009) NEW COMBINATIONS 0.220*** 0.194*** 0.220*** 0.194*** (0.029) (0.028) (0.029) (0.028) INTERNAL KNOWLEDGE 0.038* 0.027 0.038* 0.027 (0.018) (0.018) (0.018) (0.018) DISCRETE -0.008* -0.001 (0.003) (0.003) COMPLEX 0.008** 0.003 (0.003) (0.003)
CONTROLS Included Included
COMPANY FE Included Included Included Included
APPLICATION YEAR FE Included Included Included Included
CONSTANT 0.072*** 0.031 0.064*** 0.029
(0.013) (0.039) (0.012) (0.040)
OBSERVATIONS 468,554 462,334 468,554 462,334
R-SQUARED 0.329 0.343 0.329 0.343
Robust standard errors in parentheses. Standard errors are cluster by company in all models. *** p<0.001, ** p<0.01, * p<0.05, a p<0.1.
As the effectiveness of patent protection differ by the characteristics of the technology that is protected, motives to opt-out might differ by technology categories.
27 Results available upon request.
34
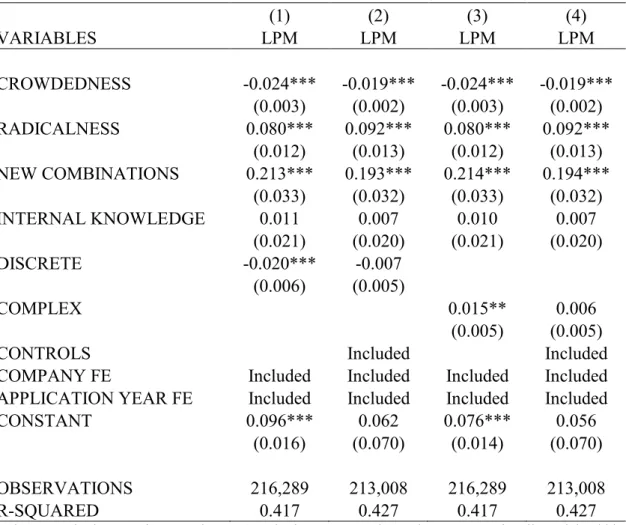
Results regarding technology moderation in the singleton subsample, complex or discrete, are displayed in table 1.6, model 2 and 4. Estimations resembled the ones described in the previous section for the full sample. In the case of the singleton patents subsample, however, two variables differ when considering the type of technology, while the other results are qualitatively and statistically similar. First, internal knowledge does not have a significant effect on the probability of keeping the patent secret before grant when the technology is complex. Second, when the technology is discrete, radicalness is not significant anymore.
TABLE 1.8 – Drivers of opting-out. Dependent variable: Published (0) or not-published (1). Singleton subsample.
(1) (2) (3) (4) VARIABLES LPM LPM LPM LPM CROWDEDNESS -0.024*** -0.019*** -0.024*** -0.019*** (0.003) (0.002) (0.003) (0.002) RADICALNESS 0.080*** 0.092*** 0.080*** 0.092*** (0.012) (0.013) (0.012) (0.013) NEW COMBINATIONS 0.213*** 0.193*** 0.214*** 0.194*** (0.033) (0.032) (0.033) (0.032) INTERNAL KNOWLEDGE 0.011 0.007 0.010 0.007 (0.021) (0.020) (0.021) (0.020) DISCRETE -0.020*** -0.007 (0.006) (0.005) COMPLEX 0.015** 0.006 (0.005) (0.005)
CONTROLS Included Included
COMPANY FE Included Included Included Included
APPLICATION YEAR FE Included Included Included Included
CONSTANT 0.096*** 0.062 0.076*** 0.056
(0.016) (0.070) (0.014) (0.070)
OBSERVATIONS 216,289 213,008 216,289 213,008
R-SQUARED 0.417 0.427 0.417 0.427
Robust standard errors in parentheses. Standard errors are cluster by company in all models. *** p<0.001, ** p<0.01, * p<0.05, a p<0.1.
Further, to understand the role of technology characteristics on the decision to opt out of earlier patent publication I estimate baseline and extended models (full sample and singleton patents subsample) including indicator variables for complex and
discrete technologies (one at a time). Table 1.7 and 1.8 display the results. When considering the differences in the technology protected by a patent, discrete technologies are more likely to be published before grant whereas complex technologies are more likely to be kept secret until grant. Nevertheless, adding the control variables the technology effects become statistically insignificant.
1.6 DISCUSSION AND CONCLUSION
This chapter investigates three hypotheses on publicly traded companies’ choice of delaying patent application publication – the effect of the competition faced by the invention or the effect of technological crowdedness, the effect of reliance on internal knowledge, and the effect of an important invention characteristic, radicalness.
Theoretical models illustrate the case where a leader and a laggard competing in a patent race may publish interim R&D results in order to raise the patentability bar by disclosing prior art and, therefore, preventing the rival firm from patenting (Baker and Mezzetti, 2005; Bar, 2006). However, these models usually focus on regular publication, e.g. scientific papers and company reports, as means of defensive publication. By analyzing firm’s choice of publishing or not the patent application before grant I find, support for hypothesis 1 which states that if an invention belongs to a technological area where there are many others operating, i.e., in a crowded technological space, the patent is more likely to be published before grant. This result is aligned with Henkel and Pangerl (2008) and Jell (2011) where they show that the patent system is used for defensive publishing.
While publishing interim R&D results may prevent rivals from patenting, firms may strategically hide their internal knowledge, securing competitive advantage. Estimations for the baseline model (without the controls) support hypothesis 2, suggesting that firms are more likely to opt for pre-grant secrecy the more they rely on internal knowledge. However, estimates for the singleton subsample indicates that patents only filed nationally (in the US), published or not before grant, do not differ regarding the use of firms’ own previous patents. Delaying the disclosure of a patent that builds on a firm’s internal knowledge might help the firm to hide its technology direction, preserving strategic knowledge embodied in the patent. Moreover, by publishing the patent application before grant, inventors face the risk of revealing how to further use internal knowledge without being awarded the exclusivity right.