Project Number 5521
Evaluation of on-farm labour saving strategies for optimisation of
herd size that could be managed by one operator
Authors
B. O’Brien, D. Gleeson and L. Shalloo
Dairy Production Research Centre, Moorepark, Fermoy, Co.Cork.
Teagasc,
Moorepark Dairy Production Research Centre, Fermoy,
Co.Cork. June, 2009.
Contents
1.
Summary
2.
Introduction
3.
Using milking frequency as a tool to reduce time associated with the milking
process on-farm
Effect of OAD milking throughout lactation on production
characteristics, milk quality and farm profit
Effect of OAD milking of heifers on 2
ndlactation
Effect of part lactation once-a-day milking at different
stages of lactation on milk production and quality
Effect of 13 times weekly milking on milk production and
quality
4.
Optimising labour efficiency in calving and calf rearing
Manipulating calving time to facilitate labour availability
Farm factors influencing labour required for calf care
Effect of frequency of milk feeding and weaning time on
calf performance
Calf feeding frequency with whole milk or milk replacer in
conjunction with indoor and outdoor rearing
5.
Economic analysis of different parlour types for different scales of a dairy
enterprise
6.
Conclusions
7.
References
8.
Publications
1. Summary
.Alternative milking frequencies
Once a day (OAD) milking throughout lactation of a herd (over 2 years, incorporating 24% heifers) resulted in loss in milk solids (MS) production of 17% per cow.
Milking cows OAD in their 1st lactation does not adversely impact on milk production in the second lactation, when changed to twice a day (TAD) milking but may lead to a higher mastitis incidence.
Changeover in milking frequency in mid lactation resulted in a similaryield of MS per cow for TAD milking for the full lactation (474 kg) and the TAD OAD group (TAD for the first 110 days and OAD for the remainder of the lactation) (469 kg).
Thirteen times weekly milking in late lactation (omitting the Sunday evening milking) compared to twice daily milking every day had no effect on milk yield or composition and maximum SCC observed during the trial was 270x103 cells/ml.
Once daily milking did not adversely affect the processability of milk. Once daily milking did not significantly increase milk SCC levels.
Alternative calf rearing systems
The improved efficiency increased herd size may be due to less use of buckets for calf feeding together with more frequent use of teat feeding from a container, automatic feeders and ad libitum feeding A study on OAD calf feeding (whole milk) demonstrated that calves can be reared with a OAD milk feeding system and weaned early (42 days) without adversely affecting performance
There was no difference in the live-weight gain of calves on once daily feeding, twice daily feeding or once daily feeding going outdoors after 28 days
Calf liveweight gain was greater with once daily feeding with milk replacer compared to once daily feeding with whole milk or once daily feeding with milk replacer going outdoors after 28 days
Economic analysis of alternative milking systems
When deciding on the type, size and level of technology in the milking parlour, the trade-off between labour requirement and cost and the initial capital investment requirement should be key in making the decision.
2. Introduction
The Dairy industry continues to be one of the most important enterprises in Irish Agriculture, both as a significant contributor to the economy (26% of Agri-Food Exports and 31% of Agricultural Output) (DAFRD, 2005) and as a source of income to approximately 21,000 farm households. While future competitiveness of the industry will largely be governed by EU and WTO events, a major factor underpinning the on-farm competitiveness of Irish Dairying will be the efficient utilisation and allocation of labour resources and practices. This is reflected by the “price/cost squeeze” which continues to erode farm incomes resulting in the need for stringent assessment of farm performance to ensure long term viability within the industry. Many dairy farmers will need to increase the scale of their operation to compensate for the effects of both a downward pressure on milk price and the effect of inflation on farm incomes. While this expansion means increasing output from the farm, there is also a realisation that the expansion will have to be undertaken at similar farm labour input levels as previously. Investment in labour is widely considered to be one of the most significant limiting factors to current production and particularly expansion, so it is crucial to research technical issues that would reduce labour/cost requirements. While there are indications that increased scale of enterprise may lead to improved labour efficiency, it may also lead to an increase in absolute labour demand. Maximising labour efficiency will mean the use of reduced levels of labour in a more productive manner. Many dairy farmers are spending several hours milking in systems designed to cope with herds much smaller than the current size. Previous farm labour research at Moorepark (O’Brien et al., 2005)
has indicated critical work areas that require considerable time input. The milking process accounts for 37 % of dairy labour input over a 12 month period, and 38 % (3.5 h) of daily labour input during the month of June. Although calf care accounted for 5 % of dairy labour input over a 12 month period, it accounted for 16 % (1.5 h per day) of daily labour input during the month of March. Thus, labour efficiency research at Moorepark has recently focused on the dairy tasks of milking and calf rearing. Research into milking labour input has also targeted alternative parlour designs from an economic perspective.
3.
Using milking frequency as a tool to reduce time associated with the
milking process on-farm
Effect of OAD milking throughout lactation on production characteristics, milk quality and farm profit
Introduction
Maintenance of a stable dairy industry is dependent on maintaining costs as low as possible, with increased labour efficiency being a priority, while simultaneously addressing the challenge of expansion of dairy herds and maintaining optimum milk quality. ‘Batch’ milking twice a day (TAD) impacts dramatically on labour requirements and general life-style in the on-farm sector. The hypothesis posed in this study was that labour efficiency on Irish farms may be increased by the introduction of a technology, such as once a day (OAD) milking. To test this hypothesis, firstly, it was necessary to acquire data on production characteristics of OAD milking. Secondly, it was critical that milk quality was not adversely affected by OAD milking so this was also evaluated. Thirdly, it was necessary to provide farm financial data from such a system and thus allow evaluation of OAD milking in terms of farm profitability.
Thus, the objectives of the research were: (i) To test the OAD milking concept from a production perspective, (ii) To quantify the impact of milking frequency (MF) on udder health
and milk processability, and (iii) To establish farm financial indicators for OAD milking technology.
Materials and methods
Sixty spring-calving, pluriparous Holstein-Friesian cows were blocked according to expected calving date, parity and previous lactation milk yield. Cows were assigned to a factorial arrangement of treatments after calving; TAD milking on a high or low nutritional level (NL); OAD milking on a high or low nutritional level. High and low nutritional levels were defined by a combination of grass allowance and concentrate offered throughout the lactation. The high and low nutritional level groups grazed grass to post-grazing heights of 75 and 55 mm and received 420 kg and 137 kg of concentrate per cow, respectively. Mean calving date for all cows was 11th March. Cows were inseminated after the morning milking, throughout a 13-week breeding season commencing on 26th April. A strict drying-off policy was adhered to, where milking ceased for cows on reaching a milk yield of 7 kg per day or a time interval of 10 weeks prior to next calving. Average milk yield/cow during the previous lactation was 6,234 kg. Individual cow milk yield was recorded daily. The milk fat, protein and lactose concentrations were determined weekly. Cow live-weight (LWT) and body condition score (BCS) were recorded weekly and fortnightly, respectively. Milk samples were analysed for progesterone levels to determine the onset of cyclicity. Submission, conception and pregnancy rates were recorded. Data were analysed according to factorial design using the PROC Mixed procedure in SAS.
Weekly SCC records were available up to 1 May and fortnightly thereafter. Clinical mastitis (CM) incidences were also recorded. Milk samples for processability analysis were collected from TAD and OAD cows at two consecutive milkings and at one milking fortnightly, respectively. Milks were analysed for gross milk composition, gel formation characteristics, N fractions and plasmin activity. Data were analysed using PROC Mixed procedure in SAS.
Economic analysis was carried out on the production data generated from this trial using the MDSM (Shalloo et al., 2004a) and farm profitability was determined for the TAD and OAD
milking frequencies at both the high and low nutritional levels. Land area was assumed to be 40 ha with surpluses and deficits treated as an opportunity cost. Thus, land could be rented in or leased out according to requirement at a prevailing rental value per ha. The key assumptions of the MDSM were similar to those used previously in the generation of farm financial indicators, except for adjustments to gross milk price and cull cow price. The average annual total dairy labour input per cow of 41.4 h (from the labour study data) for an average herd size of 77.4 cows was taken as representing a TAD milking herd. The labour input associated with OAD milking was calculated as being reduced by 25% /cow/year. This reduction in labour occurred largely due to elimination of all labour associated with the evening milking.
Results and Discussion
Production characteristics
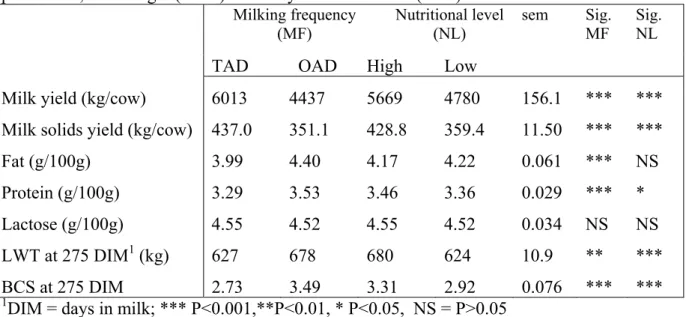
The effect of TAD and OAD milking frequencies at high and low nutritional levels on cow production and milk quality is shown in Table 1. OAD milking and a low nutritional plane reduced milk yield and yield of milk solids (MS) (P<0.001) compared to TAD milking and a high nutritional plane, respectively. Fat and protein contents of milk were increased (P<0.001) with OAD compared to TAD milking. Fat content was not affected by nutritional level, but protein content was reduced (P<0.05) at the low compared to the high nutritional level. Milk yield was 26% lower, while MS yield was 20% lower with OAD milking compared to TAD milking. Cow live-weight at the end of lactation was higher with OAD milking (P<0.01) and with the high nutritional level (P<0.001). Cow body condition score at the end of lactation was
also higher with OAD milking (P<0.001) and with the high nutritional level (P<0.001). Group dry matter intake (DMI) during the main grazing season, for cows on TAD and OAD milking, at high and low nutritional levels, were 19.7, 15.4, 19.0 and 14.9 kg DM/cow/day, respectively.
Table 1. Effect of milking frequency (MF) and nutritional level (NL) on mean cow milk production, live-weight (LWT) and body condition score (BCS)
Milking frequency (MF)
Nutritional level (NL)
TAD OAD High Low
sem Sig. MF
Sig. NL
Milk yield (kg/cow) 6013 4437 5669 4780 156.1 *** *** Milk solids yield (kg/cow) 437.0 351.1 428.8 359.4 11.50 *** *** Fat (g/100g) 3.99 4.40 4.17 4.22 0.061 *** NS Protein (g/100g) 3.29 3.53 3.46 3.36 0.029 *** * Lactose (g/100g) 4.55 4.52 4.55 4.52 0.034 NS NS LWT at 275 DIM1(kg) 627 678 680 624 10.9 ** ***
BCS at 275 DIM 2.73 3.49 3.31 2.92 0.076 *** ***
1DIM = days in milk; *** P<0.001,**P<0.01, * P<0.05, NS = P>0.05
The onset of cyclicity was evaluated by two measurements – the number of days to cycling and the proportion of cows cycling pre-MSD (mating start date). Generally OAD milked cows cycled sooner (P<0.1) and a greater proportion of them had cycled pre-MSD (P<0.05) compared to TAD milked cows (Table 2). Submission rate in the first three weeks after MSD and first service conception rate were not significantly affected by either milking frequency or nutritional level. However, the overall pregnancy rate was significantly higher (P<0.05) with OAD and the high nutritional level compared to TAD milking and a low nutritional level, respectively. Caution must be exercised with these results since cow numbers in the treatment groups are small, and these results need to be repeated before they may be interpreted fully. However, preliminary conclusions suggest no detrimental effects and some possible beneficial effects of once daily milking on reproductive performance.
Table 2. Effect of milking frequency and nutritional level on reproductive performance indicators of cows
Milking frequency (MF)
Nutritional level (NL)
TAD OAD High Low
Sig. MF
Sig. NL
CLA a (d) 30.4 25.3 27.6 28.1 + NS
Cows with CLA pre MSDb (%) 60 87 73 73 * NS Submission rate (21 d) (%) 63 73 63 73 NS NS First service conception rate (%) 50 40 50 50 NS NS Overall pregnancy rate (%) 73 90 93 70 * *
a CLA=commencement of luteal activity based on milk progesterone; b MSD=mating start date;
Udder health
Preliminary analysis revealed a positively skewed distribution for SCC. Hence the data were transformed by the natural logarithm so that it was normally distributed; this variable was subsequently referred to as somatic cell score (SCS). Milk SCS of non-infected cows only and of all cows was not significantly affected by MF but was higher in the low compared to the high NL (Table 3). Clinical mastitis was defined as one where a cow exhibited at least one case of CM during her lactation. Neither MF nor NL significantly affected the probability of contracting CM; proportionally 0.28 and 0.22 of lactations in the TAD and OAD groups, respectively, had at least one case of CM. However, this is a binary trait and this dataset is small. A final analysis was undertaken whereby sub clinical mastitis (SCM) was deemed to be present if a test-day had a SCC greater than 250,000/ml without an accompanying identified case of CM within five days of the date in question. Milking frequency or NL did not significantly affect the probability of SCM although the effect of NL did approach significance (P=0.09). The odds of a OAD milked cow exhibiting SCM was 0.95 (95% CI; 0.47 to 1.92) that of a TAD milked cow. The odds of a low NL cow exhibiting SCM was 1.83 (95% CI; 0.92 to 3.64) that of a high NL cow.
Table 3. Effect of milking MF and NL on somatic cell score (SCS units), in the first 30 weeks of lactation
Milking frequency Nutritional level SEM† Significance
TAD OAD High Low MF NL Non-infected cows 4.61 4.46 4.15 4.93 0.110 NS ***
All cows 4.77 4.82 4.64 4.94 0.077 NS **
†Standard error of the mean; *** = P<0.001, ** = P<0.01, NS = non-significant
Milk processability
Milk processability parameters as measured by gelation properties, casein content and plasmin activity are shown in Table 4 and gel strength is shown in Figure 1. Time until the onset of gelation was not affected by MF but was significantly shorter (improved) with the high nutritional level. Gel strength at 50 min was greater for OAD compared to TAD milking and at the high compared to the low NL. This may be partially due to the higher casein levels observed with OAD milking and the high NL. Plasmin activity was not affected by MF or NL.
Table 4. Effect of milking frequency and nutritional level on milk processability
a, b = significant difference minimum of < 0.05; *AMC = amino-methyl-coumarin, cGT = time until onset of gelation
(min) (shorter GT most desirable in cheese-making), d G′ = gel strength at 50 min (Pa) (higher G′ reflects higher gel
strength and is most desirable
Quality parameter Milking frequency, MF s.e.d. Nutritional level, NL s.e.d.
TAD OAD High Low
GTc, min 1183a 1163a 42.8 1111b 1235a 38.6 G′ d , Pa 85b 105a 1.42 104a 85b 3.8 Casein, g/100g 2.55b 2.76a 0.020 2.70a 2.60b 0.017 Plasmin activity, AMC* units/ml 0.329 a 0.276a 0.048 0.304a 0.301a 0.028
0 20 40 60 80 100 120 140 160 180 0 50 100 150 200 250 300
Stage of lactation, Days in milk
E las tic s hea r m odul us , G ′ (P a)
Figure 1. Effect of milking frequency on gel strength
Financial analysis
The effect of TAD and OAD milking frequencies on farm financial indicators are shown in Table 5. The number of cows required to produce the same EU fat adjusted milk quota in the TAD high nutritional level group was increased from 76 to 94, 95 and 111 for the OAD high, TAD low and OAD low treatments, respectively. Milk price was higher for the OAD milked groups due to higher milk constituents, however, milk sales were reduced compared to TAD groups. This reduction in milk sales was brought about because in the OAD system the fat concentration of the milk was higher therefore reducing the milk delivered because of the adjustments to fat quota. Thus, milk returns were similar for all groups. Even though labour costs per individual cow were lower for OAD groups, the increased cow numbers required to fill the milk quota of 454x103 l meant that total costs, incorporating labour and building costs, were higher for the OAD compared to the TAD groups at each nutritional level. Thus, farm profit was reduced for OAD compared to TAD groups by €4,205 and €4,630 at the high and low nutritional levels, respectively.
Table 5. Effect of milking frequency and nutritional level on farm financial indicators
TAD High OAD High TAD Low OAD Low
Cow number 76 94 95 111 Milk price c/l 23.7 25.9 23.4 26.7 S.R. Lu/ha 2.34 2.57 2.55 2.66 Milk sales kg 439,737 408,744 443,200 388,232 Milk Returns € 104,216 105,648 103,822 103,716 Total Costs € 121,732 136,492 139,355 152,278 Labour Costs € 34,651 34,156 39,233 38,256 Farm profit € 17,338 13,133 7,842 3,212 Overall discussion
The conventional TAD milking frequency ritual is being challenged as dairy farmers strive to improve their profitability and lifestyle. OAD milking may provide an opportunity to achieve both objectives. Potential benefits from OAD milking include increased labour productivity, reduced milking parlour expenses and improved lifestyle for farm families and staff, as observed by Clarke et al. (2006). These potential benefits may also apply in Ireland together with the
Clarke et al. (2006) showed that Holstein Friesian cows when milked OAD produced 31.2 % less
milk and 29.4 % less MS/cow than their TAD counterparts. French studies by Remond and Pomies (2004) have also showed reductions in milk yield of between 40 % and 20 % with OAD milking, depending on the stage of lactation at which OAD milking was commenced. The Irish study has shown reductions of 26 % and 20 % in milk yield/cow and MS/cow, respectively, with OAD compared to TAD milking (O’Brien et al., 2005).
There are at least three different dairy farm scenarios within which OAD milking may represent a feasible management tool in reducing the constraint of milking and developing other opportunities on the farm. The economic indicators developed in the current study showed that OAD milking would result in reduced milk receipts and farm income. An income reduction of 25 % was associated with OAD milking where milk quota of 464x103 l was still produced under such a milking regime. In this case, the reduced yield associated with OAD may be partially compensated by increased cow numbers, assuming that land is not limiting. In this scenario, herd size was increased while maintaining similar labour levels and OAD milking resulted in some loss in income, but increased flexibility with regard to time and labour within the system. If a low cost building approach was used to accommodate the extra cows, then profitability would be more favourable for OAD milking. Additionally, OAD would be ergonomically advantageous to the operator, which could be of great importance with advancing age of the workforce. A further scenario may involve OAD milking while retaining a similar herd size to the TAD milking regime. In this case, milk receipts would be reduced significantly. However, this option would allow flexibility to explore the possibility of carrying out some degree of alternative enterprise on or off-farm. This additional income would partially compensate for the income loss from OAD and would positively contribute to family farm income (FFI). Alternatively, the extra time saved with OAD milking may be spent as leisure time.
Milking OAD will only suit the goals of some dairy farmers. The decision to change from TAD to OAD milking requires a calculation of the trade-off between economic and lifestyle goals. The balance of the economic factors associated with OAD milking, such as lower milk production, lower labour requirement, reduced operating expenses, potentially lower health costs associated with lameness and fertility and better use of capital investments on the farm, must be set against the increased flexibility and time saving that may be achieved with OAD milking.
Effect of OAD milking of heifers on 2nd lactation production characteristics Introduction
The use of OAD milking may suit a particular dairy farm situation at a particular time, but the milk producer may wish to revert to TAD milking for a future lactation. However, this could adversely affect milk production of cows that had been milked OAD as heifers compared to those milked TAD in their first lactation. The literature indicates that mature cows and heifers react differently to OAD milking. Claesson et al. (1959) found that milk yield was reduced by up
to 50 % with OAD milking of 1st lactation cows. Thus, it is important to establish the effect of OAD milking of heifers on subsequent TAD milking lactations. The objective of this study was to examine the effect of OAD milking of heifers on milk production in the 2nd lactation when TAD milking was applied.
Materials and methods
In year 1, thirty-two spring-calving heifers were assigned to treatments from calving; TAD milking on a high or low nutritional level (NL); OAD milking on a high or low NL. NL was defined by post-grazing sward height (82 or 67 mm) and concentrate (458 kg or 228 kg). Heifers had an average calving date of 9th March, 2005. In year 2, nine 2nd lactation cows were selected
Cows had an average calving date of 19th February, 2006. Nutritional level may be described as cows grazing to a post grazing height of 70mm and receiving 450 kg concentrate/cow during the subsequent lactation.
Milk yield was recorded daily, while milk composition was measured weekly. Cow live-weight (LWT) and body condition score (BCS) were recorded weekly and fortnightly, respectively. Somatic cell count (SCC) was analysed weekly up to 1 May and subsequently on a fortnightly basis. Clinical mastitis cases were recorded. Mixed models with block included as a random effect were used to determine the effect of treatment.
Results and Discussion
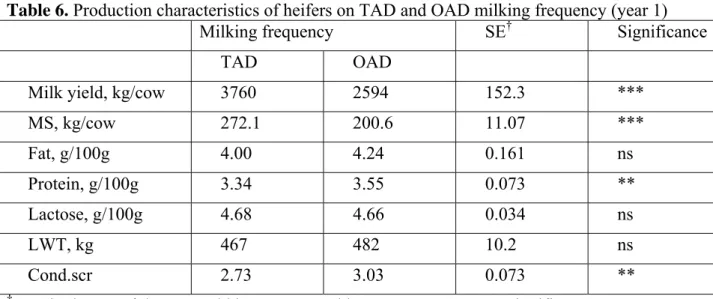
In year 1, milk yield was reduced with OAD (2594 kg) compared to TAD (3760 kg) milking (P<0.001) (Table 6). Milk protein content was higher with OAD (3.55%) compared to TAD (3.34%) milking (P<0.01). Fat content was not affected by MF (TAD=4.00%, OAD=4.24%). In year 2, milk yield and protein content were not affected by the MF applied in year 1 (TAD year1= 6630 kg, OAD year 1= 6451 kg) and (TAD year1= 3.48 g/100g, OAD year 1=3.45 g/100g), respectively (Table 7). Fat content and lactation length were also not affected by MF. Thus, milking heifers OAD in their 1st lactation did not adversely impact on milk production in the subsequent lactation when changed to TAD milking. The OAD heifers had the highest BCS averaging 3.22 and the TAD group had the lowest BCS averaging 2.95 in year 1. BCS of the OAD heifers was then manipulated by diet over the dry period in order to commence the 2nd
lactation at similar BCS and live-weight. BCS and liveweight were not affected in year 2 by MF in year 1.
The milk yield profile of the 2 treatment groups in each trial year are shown in Figure 2. There was a loss of 31% in milk yield for OAD compared to TAD heifers in year 1. There was a difference of less than 3% between the two groups in year 2.
Table 6. Production characteristics of heifers on TAD and OAD milking frequency(year 1)
Milking frequency SE† Significance
TAD OAD
Milk yield, kg/cow 3760 2594 152.3 ***
MS, kg/cow 272.1 200.6 11.07 *** Fat, g/100g 4.00 4.24 0.161 ns Protein, g/100g 3.34 3.55 0.073 ** Lactose, g/100g 4.68 4.66 0.034 ns LWT, kg 467 482 10.2 ns Cond.scr 2.73 3.03 0.073 **
Table 7. Production characteristics of 2nd lactation cows on TAD milking frequency of which 50% were milk OAD and TAD in their 1st lactation(year 2)
Milking frequency SE† Sig.
TAD (TAD) TAD (OAD)
Milk yield, kg/cow 6630 6451 228.7 NS
MS, kg/cow 488.8 466.2 14.79 NS Fat, g/100g 4.01 3.92 0.157 NS Protein, g/100g 3.48 3.45 0.050 NS Lactose, g/100g 4.63 4.49 0.046 NS LWT, kg 546 547 10.8 NS Cond.scr 2.69 2.65 0.074 NS
†Standard error of the mean; NS = non-significant
0.0 5.0 10.0 15.0 20.0 25.0 30.0 35.0 0 5 10 15 20 25 30 35 40 DIM k g /c o w /d ay
TAD 05 OAD 05 TAD 06 (TAD) TAD 06 (OAD)
Figure 2. Profile of daily milk yield for two treatment groups over the two trial years
Even though new infection incidence was similar for TAD and OAD milked heifers in year 1, there was a considerable increase in infection incidences in year 2 for the group that had previously been milked OAD (Table 8).
Table 8. Infection incidences of 2nd lactation cows on TAD milking frequency of which 50% were milk OAD and TAD in their 1st lactation
Year 1 - 2005 TAD OAD
(64 quarters/group) 3 2
Year 2 - 2006 TAD (TAD) TAD (OAD)
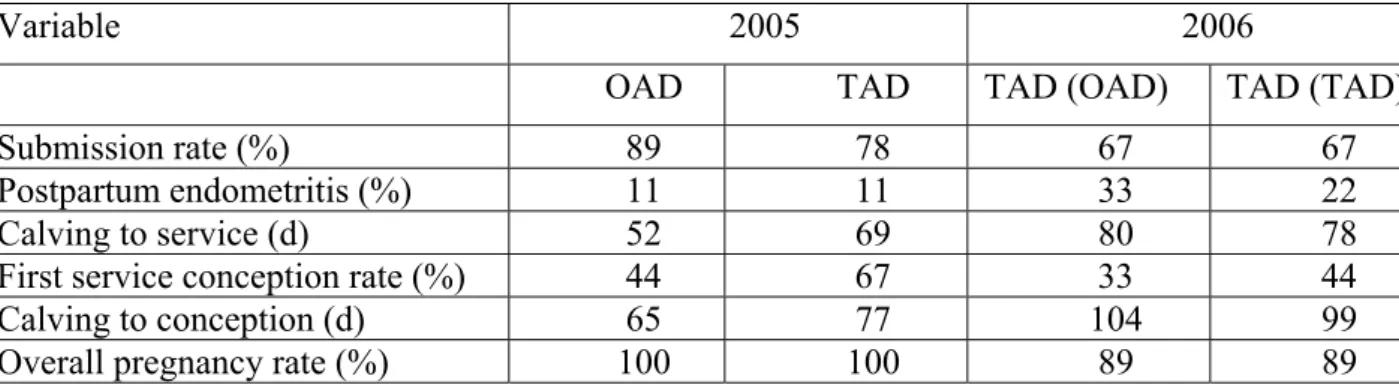
The milk SCC profiles throughout the lactation in year 1 were very similar and generally under 300,000/ml. The milk SCC profiles throughout the lactation in year 2 did reflect the different levels of new infection and the milk SCC for the group that had been milked OAD in year 1 was considerably higher in year 2. There was no apparent effect on reproductive performance but there were limited experimental units in the trial (Table 9).
Table 9. Reproductive performance of 2nd lactation cows on TAD milking frequency of which 50% were milk OAD and TAD in their 1st lactation
Variable 2005 2006
OAD TAD TAD (OAD) TAD (TAD)
Submission rate (%) 89 78 67 67
Postpartum endometritis (%) 11 11 33 22
Calving to service (d) 52 69 80 78
First service conception rate (%) 44 67 33 44
Calving to conception (d) 65 77 104 99
Overall pregnancy rate (%) 100 100 89 89
Milk solids were reduced by 26% with OAD compared to TAD milking in year 1. There was a difference of less than 5% between the two groups in year 2. There was a large divergence in milk protein content between OAD and TAD heifers as would be expected from other studies – 0.21% in this case. There was a difference of 0.03% (negligible) between the two groups in year 2. In fact any of the production characteristics were not significantly different in year 2. Heifers more sensitive to OAD than mature cows and this is in agreement with what other studies found. Knight and Wilde (1993) suggested that it may be due to more development of the udder, such as cellular multiplication and cistern enlargement, i.e. a greater focus on development in the first year of milk production. The fact that milk production was not adversely affected in year 2 by OAD milking in year 1 is in agreement with the French studies, which indicate that there is no cumulative negative impact of OAD milking on the udder’s milk producing capacity. Similar mastitis infection incidence and SCC for TAD and OAD heifers in year 1 is in agreement with the results of Clarke et al. (2006) and Remond et al. (2004). Currently, there no explanation for
the higher infection incidence and SCC in year 2. This result should be tested again, since cow numbers were small and drying-off policy may have a significant impact. But in light of the current result, caution should be exercised. The farm operator should have a long-term planning strategy regarding milking frequency or have a policy of introducing only 2nd lactation cows that have been milked TAD in their first lactation to the herd.
Comparison of whole lactation twice-a-day milking with part lactation once-a-day milking at different stages of lactation
Introduction
While OAD milking may offer the benefits of increase labour productivity and reduced costs, it also has the disadvantage of cows producing less milk and therefore less profit. However, there is a further alternative, i.e. to change milking frequency in mid lactation with which the negative effects may be partially offset by milking OAD for part of the lactation only. OAD milking in early lactation allows easier management of the labour peak in spring time calving systems, while there is also anecdotal evidence of improved body condition and reproductive performance. Alternatively, OAD in late lactation can mean less reduction in milk produced and
less labour demand over a longer period. This has not been widely studied. Thus, the objective of the present study was to compare whole lactation twice-a-day milking with part lactation once-a-day milking at different stages of lactation.
Materials and methods
This study investigated the effect of whole lactation twice-a-day (TAD) milking or part lactation once-a-day (OAD) milking at different stages of lactation on milk production characteristics and reproductive performance. Spring-calving, pluriparous Holstein-Friesian cows (n=42) were assigned to treatments after calving (mean=2nd March): whole lactation TAD milking; TAD milking until 21st June (110 DIM) followed by OAD milking for the remainder of the season (TAD/OAD); OAD milking until 21st June (110 DIM) followed by TAD milking for the remainder of the season (OAD/TAD). Groups TAD, TAD/OAD and OAD/TAD each received 625 kg concentrate and post-grazing sward height was managed at 60mm. Milk yield and composition, cow live-weight and body condition score were recorded. Milk quality was observed in terms of somatic cell count (weekly initially and subsequently fortnightly) and clinical mastitis incidence. Data were analysed using PROC Mixed (SAS).
Results and Discussion
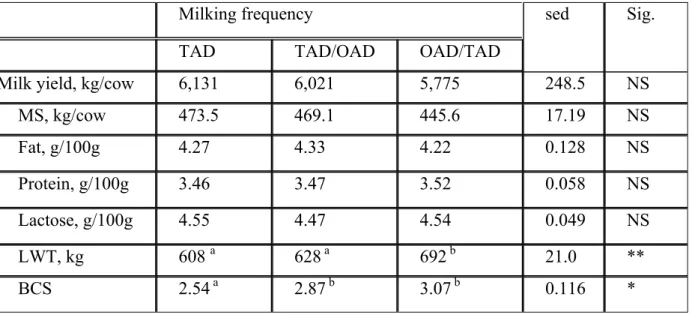
Cumulative milk yield over the complete lactation was similar for groups milked TAD throughout the lactation, milked TAD initially and changed to OAD and milked OAD initially and changed to TAD (Table 10) (Figure 8). Yield of milk solids was also similar for these different groups. Milk fat, protein and lactose contents were also similar. However, cow liveweight and BCS at lactation end were affected. While cow LWT was similar for the TAD group and the TAD OAD group, the cows milked OAD initially and changed to TAD had a significantly higher LWT at end of lactation. Similarly, while BCS was similar for the TAD group and the TADOAD group, the cows milked OAD initially and changed to TAD had a significantly higher BCS at end of lactation. The BCS of OAD milked cows started to increase significantly higher than that of the other 2 groups even from very early in lactation (Figure 9). Also, that group retained its higher BCS even when the cows were changed to TAD. TAD/OAD cows had the lowest submission rate, longest calving to service interval and lowest overall pregnancy rate.
Table 10. Effect of changing milking frequency in mid lactation on production characteristics of cows over the complete lactation
Milking frequency
TAD TAD/OAD OAD/TAD
sed Sig.
Milk yield, kg/cow 6,131 6,021 5,775 248.5 NS MS, kg/cow 473.5 469.1 445.6 17.19 NS Fat, g/100g 4.27 4.33 4.22 0.128 NS Protein, g/100g 3.46 3.47 3.52 0.058 NS Lactose, g/100g 4.55 4.47 4.54 0.049 NS LWT, kg 608 a 628 a 692 b 21.0 ** BCS 2.54 a 2.87 b 3.07 b 0.116 * ** = P<0.01, NS = non-significant
Figure 8. Effect of changing milking frequency in mid lactation on milk yield profile of cows
Figure 9. Effect of changing milking frequency in mid lactation on body condition score (BCS) profile of cows
Clarke et al. (2007) indicated that in a similarly designed trial in New Zealand a TADOAD herd
produced significantly more MS per cow (12%) than a OAD milked herd. However, the stocking rate of the OAD herd was set at 10% higher (4.4 versus 4.0 cows/ha) than the TADOAD group. The OAD herd produced milk with a significantly higher fat (+0.34%) and protein (+0.26%) concentration than the TADOAD group. A comparison of TADOAD with full lactation TAD milking was not carried out within that trial.
In the period from the start of the current trial to 21 June (phase 1) milk yield was similar for the TAD and the TAD OAD groups while the OADTAD milk yield was reduced (Table 11). However, the milk yield of those cows increased during phase 2 when they were changed to TAD, to the same level as the cows that were milked TAD from the start of lactation. Such a change was also observed by Clark (pers comm., 2005). Yield of milk solids followed a similar pattern. Milk fat, protein and lactose contents were similar across all three groups. In the period from 21 June to the end of the trial (phase 2) milk yield was similar for groups TAD and OADTAD but milk yield was numerically reduced for the TADOAD group (Table 12). Yield of milk solids was also similar for these different groups. The OADTAD group had a significantly lower fat % than the TADOAD group during phase 2. Lactose level was also significantly lower for the TADOAD group compared to the other groups during this period (Figure 4). Protein content of all 3 groups was similar.
Table 11. Effect of different milking frequencies on production characteristics of cows between calving and 110 DIM
Milking frequency
TAD TAD/OAD OAD/TAD
sed Sig.
Milk yield, kg/cow 2,944 a 3,159 a 2,561 b 160.0 *
MS, kg/cow 225.1 a 236.6 a 199.6 b 10.44 * Fat, g/100g 4.28 4.21 4.41 0.150 ns Protein, g/100g 3.39 3.33 3.41 0.048 ns Lactose, g/100g 4.58 4.56 4.53 0.057 ns LWT, kg 581 541 633 38.0 ns BCS 2.57 a 2.63 a 3.05 b 0.108 * * = P<0.05, NS = non-significant
Table 12. Effect of different milking frequencies on production characteristics of cows between 110 DIM and end of lactation
Milking frequency
TAD TAD/OAD OAD/TAD
sed Sig.
Milk yield, kg/cow 3,159 2,799 3,159 184.5 ns
MS, kg/cow 245.8 226.7 241.3 13.46 ns
Fat, g/100g 4.29 a b 4.47 a 4.07 b 0.148 *
Protein, g/100g 3.54 3.64 3.60 0.080 ns
Lactose, g/100g 4.52 b 4.33 a 4.55 b 0.051 ** ** = P<0.01, ** = P<0.05, NS = non-significant
Figure 10. Effect of changing milking frequency in mid lactation on profile of milk lactose content
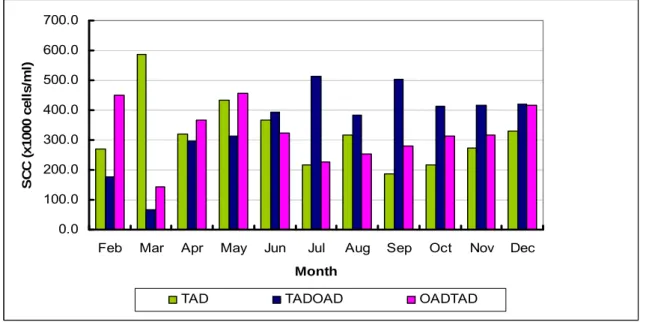
The SCC of the TAD and OADTAD groups were generally similar. However, the SCC of the TADOAD increased during the OAD milking period (phase 2) (Figure 11). The number of new infections were lowest with cows milked TAD throughout lactation; 8, 12 and 11 new infections were recorded for the TAD, OADTAD and TADOAD groups, respectively.
0.0 100.0 200.0 300.0 400.0 500.0 600.0 700.0
Feb Mar Apr May Jun Jul Aug Sep Oct Nov Dec
Month S C C ( x1 0 00 ce ll s /m l)
TAD TADOAD OADTAD
Figure 11.Effect of changing milking frequency in mid lactation on profile of milk somatic cell count (SCC)
Comparison of 13 times weekly milking at various stages of lactation with normal TAD milking in terms of milk production characteristics, milk quality and reproductive performance
Introduction
For those milk producers who do not wish to milk OAD due to potential loss in profit, an alternative milking frequency regime, such as thirteen times weekly milking may have the positive aspect of reduced farm labour input requirement. Thus the objective of this study was to examine the effect of milking cows thirteen times weekly (rather than fourteen times weekly), commencing in early lactation (50 DIM) and later (180 DIM) in lactation, on milk production characteristics.
Materials and methods
Thirty-six spring-calving, pluriparous Holstein-Friesian cows were assigned to one of three treatments after calving; normal TAD milking (TAD); 13TWM commencing at approximately 50 days in milk (DIM) (13TWM 50); 13TWM commencing at approximately 180 DIM) (13TWM 180), balanced for calving date, cow breed, somatic cell count (SCC), lactation number and milk yield in previous lactation. Average milk yield/cow during the previous lactation was 5,842 kg. Cows were blocked onto the milking treatments across existing grazing treatments on the 1st April and as calving occurred thereafter. In the 13TWM treatments one milking weekly was eliminated from the milking routine, i.e. cows were not milked on Wednesday afternoons. There were three grazing treatments with post grazing heights of 4,5, or 6 mm. Mean calving date for all cows was 20th February. A strict drying-off policy was adhered to where milking ceased when cows reached a milk yield of 7 kg/day. Individual cow milk yield was recorded daily. The milk fat, protein and
lactose concentrations were determined weekly. Cow live-weight and body condition score were recorded weekly and fortnightly, respectively. Bulk milk SCC was measured weekly. Clinical cases of new infection were also recorded.
Results and Discussion
The effect of thirteen times weekly milking compared to normal TAD milking on milk production characteristics is shown in Table 13 and Figure 12. Cumulative milk yield, yields of milk solids (MS) and fat, protein and lactose concentrations were not different for the three treatments. Cow live-weight and BCS were similar for the three treatments. Average milk SCC of the treatment groups TAD, 13TWM 50 and 13TWM 180 were 163x103, 164x103 and 147x103 cells/ml, respectively. Only minor changes in SCC were observed on the day after the omitted milking. The relatively low SCC levels may be influenced by the fact that only cows with SCC <200x103 cells/ml in the previous lactation and during the pre-trial period were used. However, the profile of lactose concentration associated with the 13TWM 180 treatment indicated lower lactose levels in late lactation compared to the other two groups (Figure 13). This could have implications for milk processability.
Table 13. Effect of thirteen times weekly milking (13TWM) commencing at 50 and 180 days in milk compared to normal TAD milking on milk production characteristics
TAD 13TWM 50 13TWM 180 SE Significance Milk yield, kg/c 6128 6498 6352 274.6 NS Milk solids, kg/c 477 502 481 20.6 NS Fat, g/100g 4.16 4.11 4.00 0.115 NS Protein, g/100 g 3.61 3.64 3.60 0.040 NS Lactose, g/100 g 4.53 4.54 4.55 0.025 NS Live-weight, kg 655 655 642 16.8 NS
Body condition score 2.95 2.95 2.96 0.058 NS NS = P>0.05 Milk yield 0.00 5.00 10.00 15.00 20.00 25.00 30.00 35.00 1 3 5 7 9 11 13 15 17 19 21 23 25 27 29 31 33 35 37 39 41 43 Lactation w eek k g m ilk / d a y 13TWM APR 13 TWM AUG TAD
Figure 12. Milk yield profile of cows on normal TAD milking, thirteen times weekly milking (13TWM) commencing at 50 and 180 DIM
M ilk Lactose % 4.00 4.10 4.20 4.30 4.40 4.50 4.60 4.70 4.80 4.90 1 3 5 7 9 11 13 15 17 19 21 23 25 27 29 31 33 35 37 39 41 43 Lactation week M ilk la c to s e % 13TWM 50 13 TWM 180 TAD
Figure 13. Profile of milk lactose concentration of cows on normal TAD milking and thirteen times weekly milking (13TWM) commencing at 50 and 180 DIM
4. Optimising labour efficiency in calving and calf rearing
Manipulating calving time to facilitate labour availability Introduction
The high labour demand associated with the calving period may be reduced, and monitoring of calvings would be facilitated, if a management practice could be applied which would minimize the incidence of calvings at night. The practice of feeding cows in late evening is considered by many farmers to inhibit night-time calving. Thus, the objective of this study was to establish the effect of altering silage feeding time prepartum on time of calving and on calving performance. Materials and methods
Two grass silage-feeding regimes were imposed on housed spring-calving cows (n=250). One group of cows did not have access to the feed face between 1030 h and 2030 h. Access to the feed face was controlled by closing cows into the cubicle house. During the designated silage feeding time adequate headspace was allocated to allow all cows feed at the same time. A second group of cows had continuous access to silage over a 24 h period. Cows remained on their respective feeding regimes until time of calving (mean days on treatment = 45). Day-time and night-time calvings were defined as calvings occurring between the hours of 0630 and 0029 and 0030 to 0629, respectively. Both groups had grass silage delivered to the feed passage daily at 1030 h.
Results and Discussion
Restricting silage feeding time to between 2030 and 1030 h resulted in 9% less calvings at night compared to cows with full access to silage (Table 14). Calvings peaked at 1100 and 1800 h, with 9 calvings per hour, respectively, for cows on a restricted silage feeding time. These peaks in calving occurred shortly after silage access was denied in the morning and after the evening
milking was completed. The lowest period of calving activity occurred at 0100 and 0300h with 0 and 1 calvings per hour, respectively. Calf mortality was 5 and 4 % for restricted silage access and for ad-lib access, respectively.
Table 14: Effect of feeding regime (restricted silage access; ad-lib silage access) on calving performance
Restricted silage access
(n=125) Ad-lib silage access (n=125) Night calvings* (% of cows) 17 26
Cow weight post-calving (kg) 578.8 591.3
Gestation (days) 283.1 283.4
Assisted calvings 0.14 0.15
Calf mortality 0.05 0.04
Calf weight (kg) 42.8 42.8
* 0030 h to 0629h
Farm factors influencing labour required for calf care Introduction
Calf rearing accounts for a large proportion of labour associated with the dairy enterprise during the spring period. The labour requirement for calf rearing may be reduced by selecting different calf feeding methods. To establish the factors influencing the labour requirement for calf care a study was undertaken on spring-calving dairy herds during the peak time for calf care from February to April.
Materials and methods
The study incorporated 129 farms selected to take part in a farm labour study and which represented a large number of dairy farms nationally. Herds were categorized into three groups depending on herd size (small= <50 cows, medium = 50 to 80 cows, large = >80 cows). There were 32, 55 and 42 herds in the small, medium and large herd-size groups, with average herd sizes of 43, 63 and 136 cows and farms ranged in milk quota size from 135×103 to 1500×103l. These herds had an average calf number of 25, 35, and 53, respectively. The total labour input per day associated with all tasks related to calf care, e.g. calf-feeding, calf house bedding and cleaning and veterinary attention was recorded on the herds. The calf labour input per day referred to the management of all calves (0 to 8 weeks) including the feeding of newborn calves. Labour input required for individual tasks associated with calf care were not recorded. Total calf labour input in each herd was recorded using a timesheet for each of 3 consecutive days, on one occasion per month during the calving season (February, March and April). A questionnaire survey on the management of calves was completed for each farm.
Results and Discussion
The average time consumed by calf care peaked in April with herds in the small, medium and large groups taking 63, 74, and 112 min per day, respectively. The total average time consumed by calf care per farm increased with herd size and the average time consumed per calf was highest in the small herd group (2.1, 1.7, 1.8 min/day for small, medium and large herds, respectively). The improvement in efficiency that was evident with herd size may be due to less use of buckets for calf feeding and for milk transfer from the dairy to the calf house (Table 15).
This also coincided with significantly more use of teat feeding from a container, automatic feeders and ad libitum feeding. Large farms were more likely to feed cold milk to calves; this
allowed the task of calf feeding to be carried out during an off peak labour time during the day. There were no differences in the use of mechanisation to clean calf houses. Inadequate access to calf houses to operate mechanical cleaning was the main factor why manual cleaning was used. A significant reduction in labour input per calf was shown where loaders could be used for the complete cleaning process The large herds also tended not to clean pens daily and tended towards cleaning on a monthly basis.
When the labour input of different calf feeding systems were compared, a higher labour requirement was needed for bedding and cleaning calf houses with automatic feeding system and lowest for the once a day feeding system. This is due to the extra urine and wet bedding with the automatic system. Farms feeding milk to calves once a day had a lower labour input per calf for total calf care (total feed time, bed and clean pens, veterinary) compared to farms feeding calves twice daily using buckets. In addition, this feeding system allowed the flexibility to carry out calf feeding tasks at an off-peak time of the day.
O'Shea et al. (1988) concluded that most farm tasks other than calf rearing were carried out more
efficiently as herd size increased. As it is necessary for each calf to be individually managed for a period after birth, this may explain why the increase in efficiency was not greater with scale. Table 15. Proportion of herds practising different calf rearing methods within small, medium and large herd sizes
Small (< 50 cows) (n=32) Medium (50 to 80 cows) (n=55) Large (> 80 cows) (n=42)
Milk transfer method
Bucket 0.53 0.52 0.39
Pump 0.16 0.25 0.20
Mechanical 0.31 0.23 0.41
Milk temperature fed to calves
Cold 0.03 0.15 0.23
Warm 0.97 0.85 0.77
Calf feeding method
Bucket 0.50 0.33 0.25 Teats or Automatic 0.19 0.45 0.49 Trough 0.31 0.22 0.26 Feed frequency Ad libitum 0.20 0.47 0.50 Twice daily 0.80 0.53 0.50
Calf house cleaning frequency
Daily 0.22 0.09 0.10
Weekly 0.34 0.65 0.40
Effect of frequency of milk feeding and weaning time on calf performance Introduction
The labour requirement for calf care may be reduced by altering calf feeding methods (Gleeson
et al., 2002). Studies of once daily feeding of calves in individual pens have shown no adverse
affect on calf performance (Williams et al., 1986). However, there is limited knowledge on the
effect of feeding cold whole milk to calves as a group. The objective of this study was to evaluate the effect of feeding cold whole milk, once daily by teat to calves in a group, with respect to calf performance, health, labour requirement and costs of production.
Materials and Methods
Female dairy calves (n=54) were randomly assigned to one of three whole milk feeding treatments based on calf weight (mean weight = 42 kg) and sire breed. Treatment 1 consisted of once a day feeding and weaning at 42 days; Treatment 2 consisted of once a day feeding and weaning at 56 days and Treatment 3 consisted of twice day milk feeding regime and weaning at 56 days. Sire breeds included Holstein Friesian (n=36), New Zealand x Friesian (n=12) and Montebelliarde x Friesian (n=6). At an average age of 8 days calves were assigned to group pens containing nine calves and each group pen was replicated. Calves remained in their respective group pens for 70 days. Calves were offered cold milk (<10oC) without additives using a mobile
teat feeder (12 teats) mounted on the front gate of the pen. Calves which were fed milk twice daily received 2.5 l per feed and those fed once daily received 5 l. Calfrations (18% protein) and
fresh water were available ad-lib to all calves from day 8 until day 70. Calves were bedded using sawdust and the total area available per calf was 4.22 m. Calf house and milk temperature was recorded daily. Individual calf live-weight was recorded on the start date and fortnightly thereafter. Weekly group intakes of milk, concentrate and hay were recorded. Health parameters recorded included the incidence of individual and group diarrhoea and calf mortality. Thelabour input per day for tasks related to calf care was recorded on fifteen occasions. To establish the costs of calf rearing for 70 days, the total quantities of milk (26 cent/l), concentrate (€375/t), hay
(€0.16/kg), sawdust (€20/t) and labour (€10.96/h) required per calf were calculated.
Data was analyzed using a mixed model (proc mixed SAS, 2006) with treatment as the fixed effect and pen as the random effect. Average daily gain was calculated by fitting a linear regression through the fortnightly weights for each calf.
Results and discussion
There were no differences in calf live-weight or daily live-weight gain between treatments (Table 16). The overall weight gain was 47.1, 47.5, and 48.3 kg/calf with feeding once a day and weaned at 42 days, and with feeding once a day and twice a day, and weaned at 56 days, respectively. The lower weaning weight (63kg) due to early weaning had no affect on the subsequent calf performance as the early weaned calves were consuming 1kg of concentrate per calf/day at weaning and 3.1kg at week 10. The early weaned calves had a lower total intake of milk per calf (182 l) compared to calves weaned at 56 days and fed milk either once (252 l) or
twice a day (252 l). The early weaned calves had higher total intakes of concentrates per calf
(91kg) compared to calves weaned at 56 days and fed milk either once (80.4kg) or twice a day (82.3kg). The early weaned calves consumed slightly more hay (8.9kg) compared to calves fed once a day and weaned at 56 days (8.1kg) and those fed twice a day (7.5kg).The proportion of calf deaths (0.05) did not differ between treatments. However, a proportion of calves (0.11) from each treatment did not adapt to group feeding of cold milk and was withdrawn from the study.
Instances of group diarrhea occurred during periods of very cold weather when both the calf house and milk temperature were low (-1 to 4oC). The lowest daily labour input per calf (83sec) was observed with once daily milk feeding when calves were weaned at 42 days compared to once a day feeding when calves were weaned at 56 days (105sec) or with twice a day feeding (120sec).The production costs for the 70 day rearing period were €104, €122 and €126 for once a day weaned at 42 days, and with once a day and twice a day weaned at 56 days, respectively.
Table 16. Effect of frequency of milk feeding and weaning time on calf performance Once a day (T1) (weaned at 42 days) Once a day (T2) (weaned at 56 days) Twice a day (T3) (weaned at 56 days) s.e. Sig Weaning weight (kg) 63.6 77.5 76.7 2.56 *** Weight at 70 days (kg) 89.5 89.5 90.7 2.49 NS
Weight gain per day
(kg) 0.71 0.74 0.78 0.05 NS
*** = P<0.005, NS = P>0.05
Calf feeding frequency with whole milk or milk replacer in conjunction with indoor and outdoor rearing
Introduction
Feeding whole milk (WM) to calves once daily (OD), indoors does not adversely affect calf performance (Gleeson et al., 2007). There is limited knowledge on the effect of OD group
feeding calves combined with an early turnout on calf performance. With an increase in the value of whole milk and concerns about the potential spread of Johnes disease, there is also a
renewed interest in the feeding of milk replacer (MR). The objective of experiments 1 and 2 of the current study, respectively, was to evaluate the effect of group feeding calves once daily with (1) WM outdoors from day 30 and (2) MR, indoors and outdoors, with respect to calf performance.
Materials and Methods
In Experiment 1, female calves (n=54) were randomized and assigned to three whole milk feeding treatments, based on date of birth, calf live-weight and sire breed. Calves were assigned to treatments at an average age of 10 days and remained on treatment for 70 days. The treatments were (i) once daily feeding (OD), (ii) twice daily feeding (TD) or (iii) OD feeding going outdoors after 28 days (ODO). In Experiment 2, female calves (n=54) were assigned to one of three milk feeding treatments using the same criteria as with Experiment 1. The milk feeding treatments applied were (i) OD feeding with WM (OD), (ii) OD feeding with MR (ODMR) or (iii) OD feeding with MR going outdoors after 28 days (ODMRO). Calves offered WM once or twice daily received a mean daily allowance of 4.5 litres/head. Calves offered MR (Heiferlac) received a mean daily allowance of 275 gms in 2.75 litres of water. In both experiments, calves were penned in two groups of nine for each treatment until day 28 and fed milk using a mobile teat feeder. Calves were weaned off milk at 56 days. Calves were offered a calf starter ration ad-lib from day 10 until day 56 and a commercially available calf pellet thereafter. Perennial ryegrass hay was offered ad-lib to all calves indoors and grass was available to calves outdoor from day 28. Individual calf live-weight was recorded at the start and fortnightly thereafter until day 70. Weekly group intakes of concentrates were recorded. Daily health parameters such as the incidence of calf diarrhoea, pneumonia and calf deaths were recorded. Liveweight performance data were analyzed using mixed models with the Mixed procedure of SAS (SAS, 2006).
Results and Discussion
Experiment 1: There was no difference (P>0.05) in the live-weight gain (LWG) of calves during the trial period (Table 17). The final liveweight (LW) at day 70 was 86, 89 and 85 kg for OD, TAD and ODO, respectively. The ODO calves had lower (P<0.01) ADG from day 28 to day 42 and consumed less concentrate compared to OD or TD during this period. Experiment 2: LWG (1-70d) was higher (P<0.05) for ODMR compared to OD or ODMRO calves (Table 18). The final calf liveweight at day 70 was 87, 95, and 88 kg for OD, ODMR and ODMRO, respectively. The total concentrate intake per calf (1-70d) was 70, 102 and 75 kg for OD, ODMR and ODMRO, respectively. The increased concentrate intake which mainly occurred during the post weaning period (Figure 14) may account for the tendency towards increased performance of the ODMR calves. There were no differences in health parameters measured.
Table 17. Effect of frequency of daily milk feeding and rearing environment on calf performance
** = P<0.005, NS = P>0.05
Experiment 1
days OD TD ODO s.e Sig
LW 1 39.8 40.4 39.4 2.23 NS
LWG 1-70 46.6 48.7 45.1 2.32 NS
ADG 28-42 1.01 a 0.96 a 0.66 b 0.07 ** ADG 43-56 0.57 a 0.97 b 0.59 a 0.07 ** ADG 57-70 0.72 b 0.63 b 1.26 a 0.08 **
Table 18. Effect of milk feed type (once daily) and rearing environment on calf performance
*** = P<0.005, * = P<0.05, NS = P>0.05
Experiment 2
days OD ODMR ODMRO s.e Sig
LW 1 39.1 39.7 39.3 NS LWG 1-70 47.7 b 55.4 a 48.9 b 2.38 * ADG 28-42 0.85 b 0.56 a 0.85 b 0.09 * ADG 43-56 0.75 b 1.27 a 0.68 b 0.09 *** ADG 57-70 0.80 a 0.97 ab 1.09 b 0.07 * 0.00 0.50 1.00 1.50 2.00 2.50 3.00 3.50 4.00 1 2 3 4 5 6 7 8 9 10 w e e ks O DMR O DMRO O DWM
5.
Economic analysis of a rotary and herringbone parlour at different
scales of a dairy enterprise
Introduction
The Irish dairy industry is facing into an era of substantial change driven by developments in EU milk quota policy and potentially a new world trade agreement. European farmers are now going to be exposed to a more competitive, volatile market so the challenge for these producers is to increase their levels of competitiveness through the lowering of costs, innovation and increased productivity (Shalloo et al., 2004b). As a result of CAP reform (milk quota policy
changes) there will be an opportunity for the first time since 1984 for many dairy farmers to expand their dairy enterprise. As a result, dairy farmers will be faced with questions around whether to expand their dairy businesses. If they decide to expand their dairy business a whole serious of questions will arise in relation to type of milk production system, genetics, housing requirements and type and level of mechanisation included in the milking parlour. This study seeks to investigate the optimum economic relationship between labour input, capital investment in the milking facility and scale (herd size).
Materials and Methods
Six herd size categories (150, 250, 350, 450, 550 and 650 cows) were selected to investigate the relationship between scale, capital investment and labour input. Three parlour scenarios were investigated; (S1) assumed a 50 unit rotary parlour at a cost €350,000 with automatic cluster
removers (ACRs). (S2) assumed a 50 unit rotary at cost €320,000. ACR’s were not installed in
the parlour however an additional operator was required during the milking process to remove clusters and carry out teat disinfection. (S3) assumed a herringbone parlour at a cost of €200,000.
Milking times were ascertained from the Moorepark labour study (O’Donovan, 2008) and from this, the baseline labour requirement for a herd size of 150 cows was calculated. The labour study showed that the milking time required for a rotary and herringbone milking parlour was 4.1 and 7.1 (hr/cow/year), respectively. According to a number of studies (O’ Donovan 2008; Dillon et al., 2005; IFCN 2005), the calculation of milking time would need to be modified for
different herd sizes and this was included in the analysis. The Moorepark Dairy Systems Model (MDSM) (Shalloo et al., 2004) was used to determine the impact of capital investment decision
on overall farm profitability. A 15 year bank loan was used to fund the investment at an interest charge of 6.5%. A number of economic indicator variables (e.g. profit before and after tax) were outputted from the MDSM with (discounted) net cash flow over a 15 year period.
Results and Discussion
Total discounted farm cash-flow over a 15 year period for three different milking parlours across 6 herd sizes is shown in Table 19. Total cash flow was greater in a rotary parlour with ACR’s (S1) than a herringbone parlour (S3) at herd sizes of 450 cows and greater. When total discounted profit after tax was taken into consideration, a rotary with ACR’s (S1) was most profitable at herd sizes of between 250 and 350 cows. A rotary without ACR’s (S2) was shown to be less profitable than a rotary with ACR’s (S1) or a herringbone parlour (S3) at all herd sizes for all indicators of profitability used. Therefore if an additional operator is required in place of automated cluster removal and teat disinfection within a rotary parlour, then that rotary milking parlour is not viable across the herd sizes analysed. Cash flow is one of the most important indicator’s of investment appraisal as it determines the overall liquidity of the capital investment and also it ensures the short term sustainability of the business (Gilchrist and Himmelberg, 1995). A business could show good profit potential both before and after tax while if there is not a cash surplus to meet costs the liquidity of the overall business may cause it to fold.
It is important to note that the selection of milking equipment can have a major affect on the milk quality and on the number of units an operator can comfortably handle (O’Brien, 2004). The installation of automation to the milking process should not compromise milk quality standards and this should be carefully planned before any investment is carried out (Bickert, 1994). The milking process should consider appropriate management of somatic cell count (SCC) and mastitis while also paying attention to milking time and careful maintenance of all milking equipment (Mikkelson, 2008).
This study looked at two alternative capital investment decisions in relation to milk quality in the milking parlour. Scenario 1 assumed that automated teat spraying post milking was installed with the ACR’s (at an additional cost of €600 per unit) while scenario 2 assumed no ACR’s in the rotary; however an additional operator was present whose duty it was solely to remove clusters and manually teat disinfect cows. The importance of post milking teat disinfection in relation to enhancing milk quality is paramount (Mottram, 1997) and thus it is essential that automation of this task is precise. Pocknee (2003) has stated that reducing the thoroughness of any element of the work routine time (WRT) may affect udder health, and consequently impact negatively on profits. Previous research would suggest that methods of automatic post disinfection do not always achieve full teat coverage (Kingwell, 1980) while Hillerton (1993) suggested that walk through teat sprayers may not be effective in preventing Corynbacterium bovis infections. However, technology to improve the accuracy and effectiveness of automatic teat disinfection is currently being developed. At the present time implementation of automatic teat spraying to the rotary may have negative implications on milk quality and thus the requirement for an additional operator in the parlour may have to be considered if milk quality were to be adversely affected.
Table 19. Total discounted net profit (‘0000 €) (before and after tax) and total discounted cash flow for Rotary (S1, S2) and Herringbone (S3) milking parlours over a 15 year
period across 6 herd sizes
*(€1 ,000) 150 cows 250 cows 350 cows 450 cows 550 cows 650 cows
S1 S2 S3 S1 S2 S3 S1 S2 S3 S1 S2 S3 S1 S2 S3 S1 S2 S3 Before tax 89 88 104 198 193 208 312 304 317 432 421 433 558 543 554 681 663 673 After tax 80 79 90 154 150 156 230 225 229 310 302 306 393 383 387 469 457 460 Cash flow 97 95 111 208 204 218 326 317 331 448 437 449 577 562 573 703 684 694
6.
Conclusion
OAD milking was associated with reduced milk yield and increased concentration of milk constituents. For a complete herd incorporating 24% heifers (calculated over a two year period), milk yield was reduced by 24% and MS yield by 17%. For the heifer group alone, OAD milking resulted in milk yield being reduced by 31% and MS yield by 27%. There was no difference in the level of clinical or sub-clinical infection between OAD and TAD milked cows in these studies. The OAD milking increased the concentrations of protein, casein and fat and improved the gelation properties (ability of milk to form good gel during cheese-making). It did not affect the SCC or plasmin activity in milk.
Milking heifers OAD in their 1st lactation did not adversely impact on milk production in the subsequent lactation when changed to TAD milking. However, number of new infections and average milk SCC was higher in year 2 for the cows milked OAD in year 1. This requires further investigation, as only a relatively small number of cows (n=18) were carried in this study. It does point towards exercising caution with OAD milking, either a long-term planning strategy on milking management must be implemented or alternatively, all cows could be milked TAD in their 1st lactation.
OAD in early or late lactation (before or after 110 DIM) reduced milk yield/cow and milk solids/cow by 5% or less. SCC of milk and infection incidences higher in the cow group that changed from TAD to OAD milking . The lower milk lactose levels experienced in that group (TAD/OAD) in late lactation could have implications for milk processability and milk price (penalty < 4.2%). OAD milking in early lactation had a positive pronounced effect on BCS which remained throughout lactation.
Omitting one milking weekly did not significantly affect milk yield, yields of milk solids (MS) and fat, protein and lactose concentrations over the complete lactation.
The changes in milking frequency tested generally responded well in terms of milk production and milk quality characteristics. However, it is important to note that only cows with relatively low (<250x103 cells/ml SCC were used in these trials. Milking labour was also reduced by OAD but this was associated with some reduction in income and would therefore only be suitable for some dairy farm situations.
Restricting cows access to grass silage to between 2030 and 1030 h pre-calving tended to reduce the number of cows calving at night and as a consequence the labour requirement during night-time hours was reduced.
The main factors influencing labour input associated with calf care are herd size, calf feeding system and calf house cleaning methods. As herd size increased labour saving practices such as ad libitium feeding of milk, mechanical milk transfer and feeding of cold milk are more likely to be used. Calves can be reared successfully using a once a day whole milk feeding system when calves are fed as a group and weaned from milk early (42 days) with a reduced labour requirement. An advantage of OAD feeding is that the task of feeding calves can be completed at one occasion with the once daily feeding system. Reduced labour input was required for
bedding/cleaning of calves fed on a once daily basis and farmers also tended to put these calves outdoors at an earlier stage. Calves fed whole milk once daily outdoors showed similar performance at 70d to those fed twice or once a day indoors. Calves fed milk replacer indoors had better performance than calves fed outdoors. Thus, it is possible to improve time efficiency of calf care by selecting time efficient methods of calf feeding and housing without affecting calf performance, however, the calf rearing system chosen should be operated within the European Communities Regulations, 1995/98 for the welfare of calves.
Dairy farmers that are expanding will have to make decisions on the types of investment on their farms. The trade-off between labour requirement and cost and the initial capital investment requirement within the milking process should be key in deciding the type, size and level of technology in the milking parlour. Total net profit before and after tax and cash flow was highest in a rotary with ACR’s at herd sizes over 450 cows. Total discounted profit after tax was highest for the rotary with ACR’s at herd sizes of between 250 and 350 cows. A rotary without ACR’s was less profitable than a rotary with ACR’s or a herringbone parlour at all herd sizes. It is important to stress that any investment in milking facilities should not be shown to compromise milk quality within the herd.
7.
References
Bickert, W.G. (1994). Designing dairy facilities to assist in management and to enhance animal environment. Page 111 in Dairy Systems for the 21st Century. American Society of Agricultural Engineers. Publication no. 02-94. American Society of Agricultural Engineers., St. Joseph, MI.
Claesson, O., A. Hansson, N. Gustafsson and Brannang, E. (1959). Studies on monozygous cattle twins. XVII. Once-a-day milking compared with twice-a-day milking, Acta Agric. Scand. 9
(1959), pp. 38–58.
Clarke, D., Phyn, C.V.C., Tong, M.J., Collis, S.J., and Dalley, D.E. (2006). A systems comparison of once- versus twice daily milking of pastured dairy cows. Journal of Dairy Science,
89:1854-1862
Clarke, D., Dalley, D., Hofmann, L. and Frost, B. (2007). Milk production from once a day (OAD) milking. Proceedings of Once a Day Milking Conference, DairyNZ, New Zealand. pp. 3-8. DAFRD [Department of Agriculture Food and Rural Development], (2005). Annual Review and
Outlook 2004/2005 DAFRD, Dublin. http:www.agriculture.gov.ie
Dillon, P., Roche, JR., Shalloo, L., Horan, B. (2005). Optimising the financial return from grazing in temperate pastures. Proceedings of a satellite workshop of the XXth International Grassland Congress, July 2005, Cork, Ireland.
Gilchrist, S., Himmelberg, S.P. (1995). Evidence of the role of cash flow for investment. Journal of Monetary Economics 36 (3): 541-572.
Gleeson, D., O’Brien ,B., O’Donovan,K., Ruane, D. and Kinsella, J. (2002). Factors affecting labour requirements associated with calf care on dairy farms. In: Agricultural Research Forum,